One of the most common questions I have gotten from readers is:
Would it be better to invest more money following a market decline?
For example, if you were originally investing $500 a month, should you double it to $1,000 a month once the market is down 20%, 30%, etc.?
Logically, this seems to make sense. After all, most market declines are short-lived, so buying after a decline is the same as buying at a temporary discount, right? What’s not to love?
Unfortunately, the data only seems to agree in the extremes. For example, going back to 1926, future returns only seem to increase during the largest of declines (40% or more). We can see this by examining the future one, three, and five year annualized returns in the S&P 500 broken out by drawdown level (i.e. percentage from all time-highs):
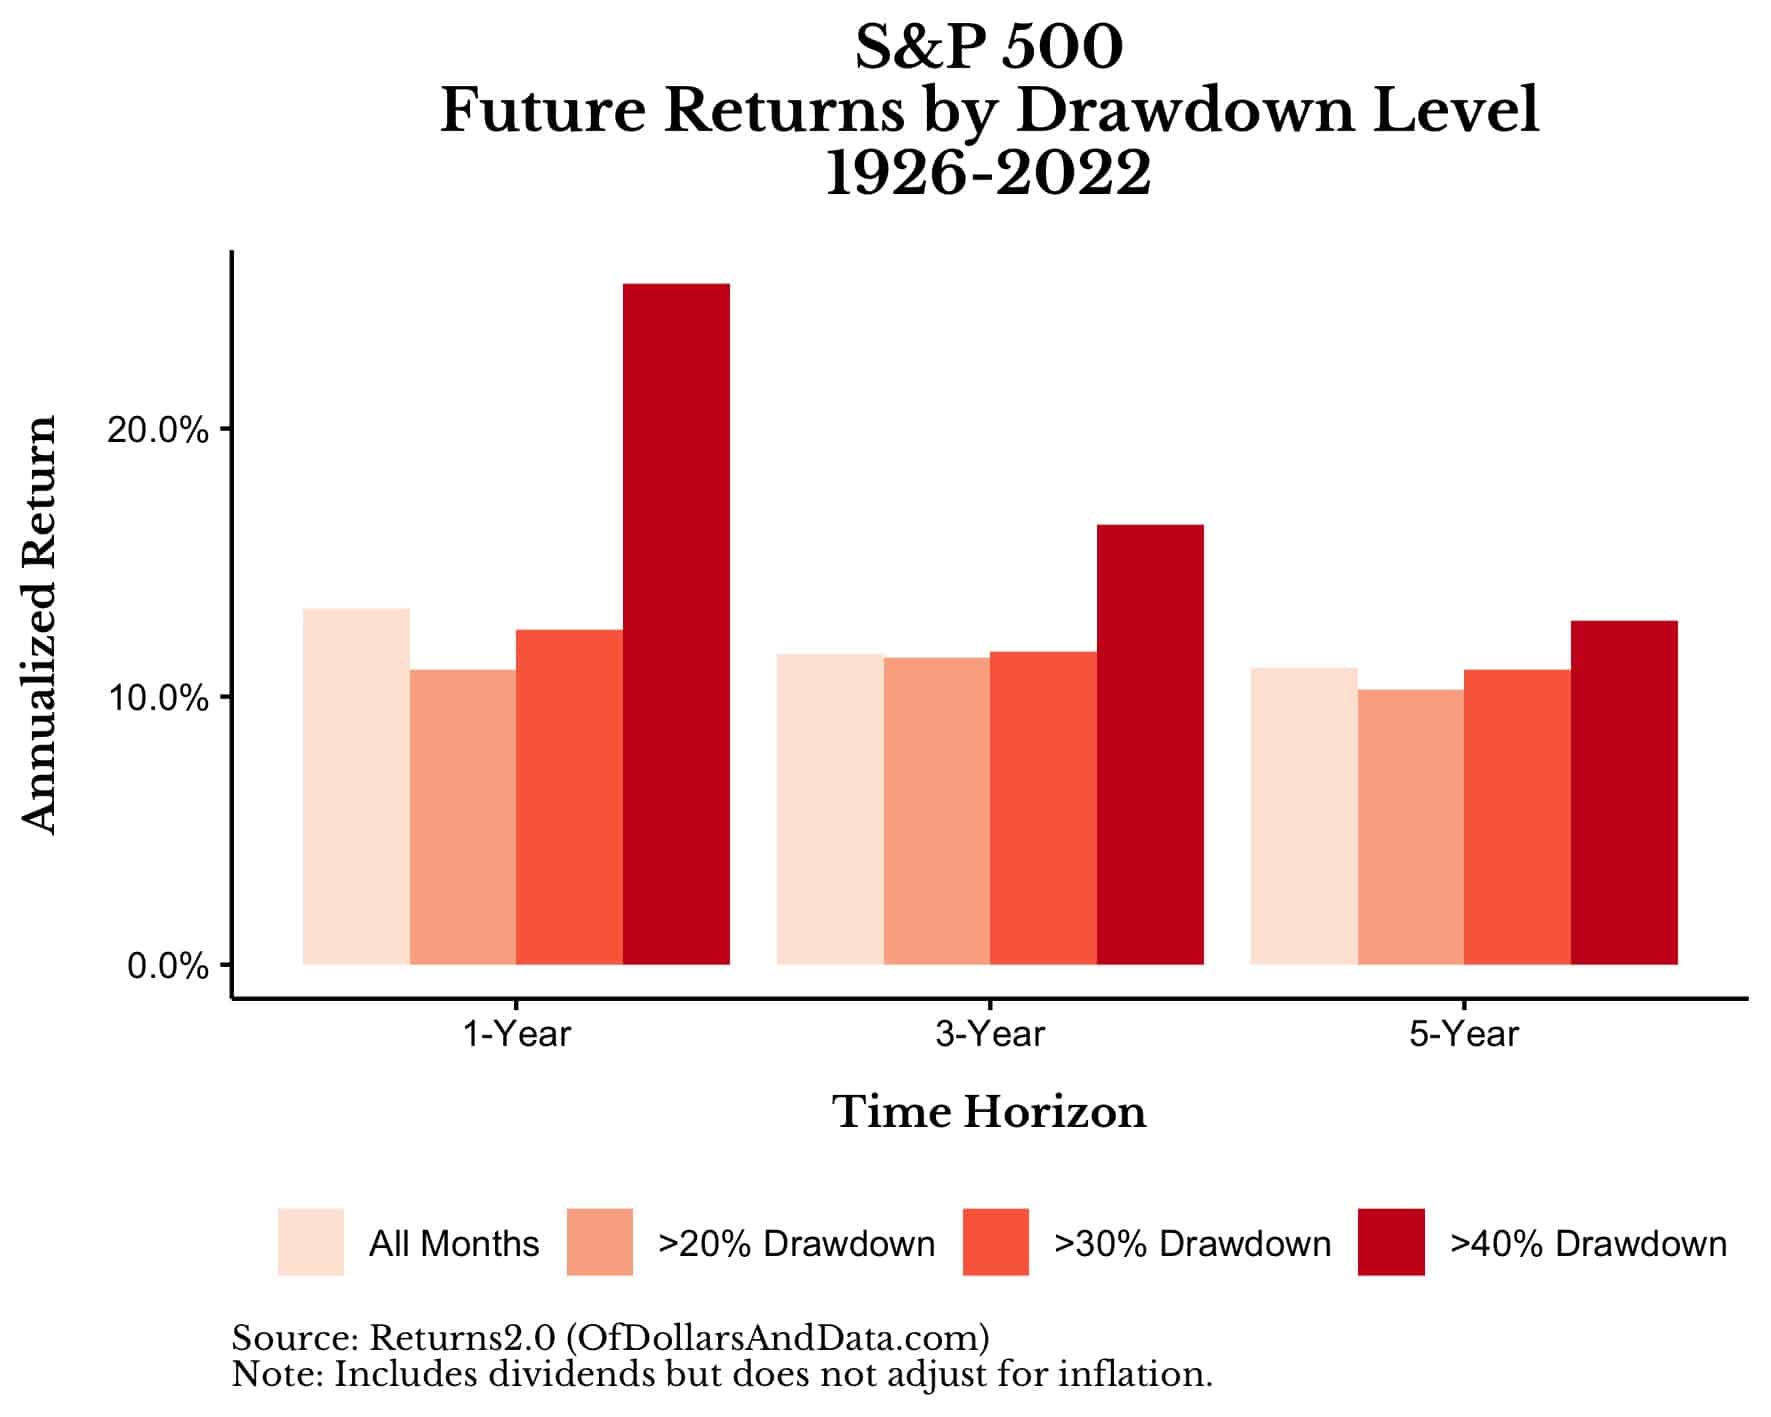 As you can see, the median annualized one, three, and five-year returns when the market is down by >20% or >30% is nearly identical to the returns during all months. This suggests that there is no added benefit of investing more during drawdowns of this magnitude.
However, once the market has declined by 40% (or more) from all time-highs, everything changes. At this point, it seems like the benefit of doubling down is quite large. In particular, following a 40%+ decline, the S&P 500 tends to return 25% over the next year compared to 13% (across all months) and 12.8% annually over the next five years compared to 11.1% (across all months). This suggests that there is a huge benefit to “buying the dip” during the biggest of declines.
But, maybe we should use a time period that is more comparable to modern times. Though I regularly rely on data going back to the 1920s, some have made the argument that this data isn’t as useful because of how much the U.S. stock market has changed since then. I see their point. Therefore, I have run the same analysis as above, except this time I started the data in 1988 (I will explain why I chose 1988 in a moment).
When starting in 1988, we can see that there is now a benefit to investing in the S&P 500 following a 30% (or greater) decline in addition to the benefit of investing following a 40% (or greater) decline:
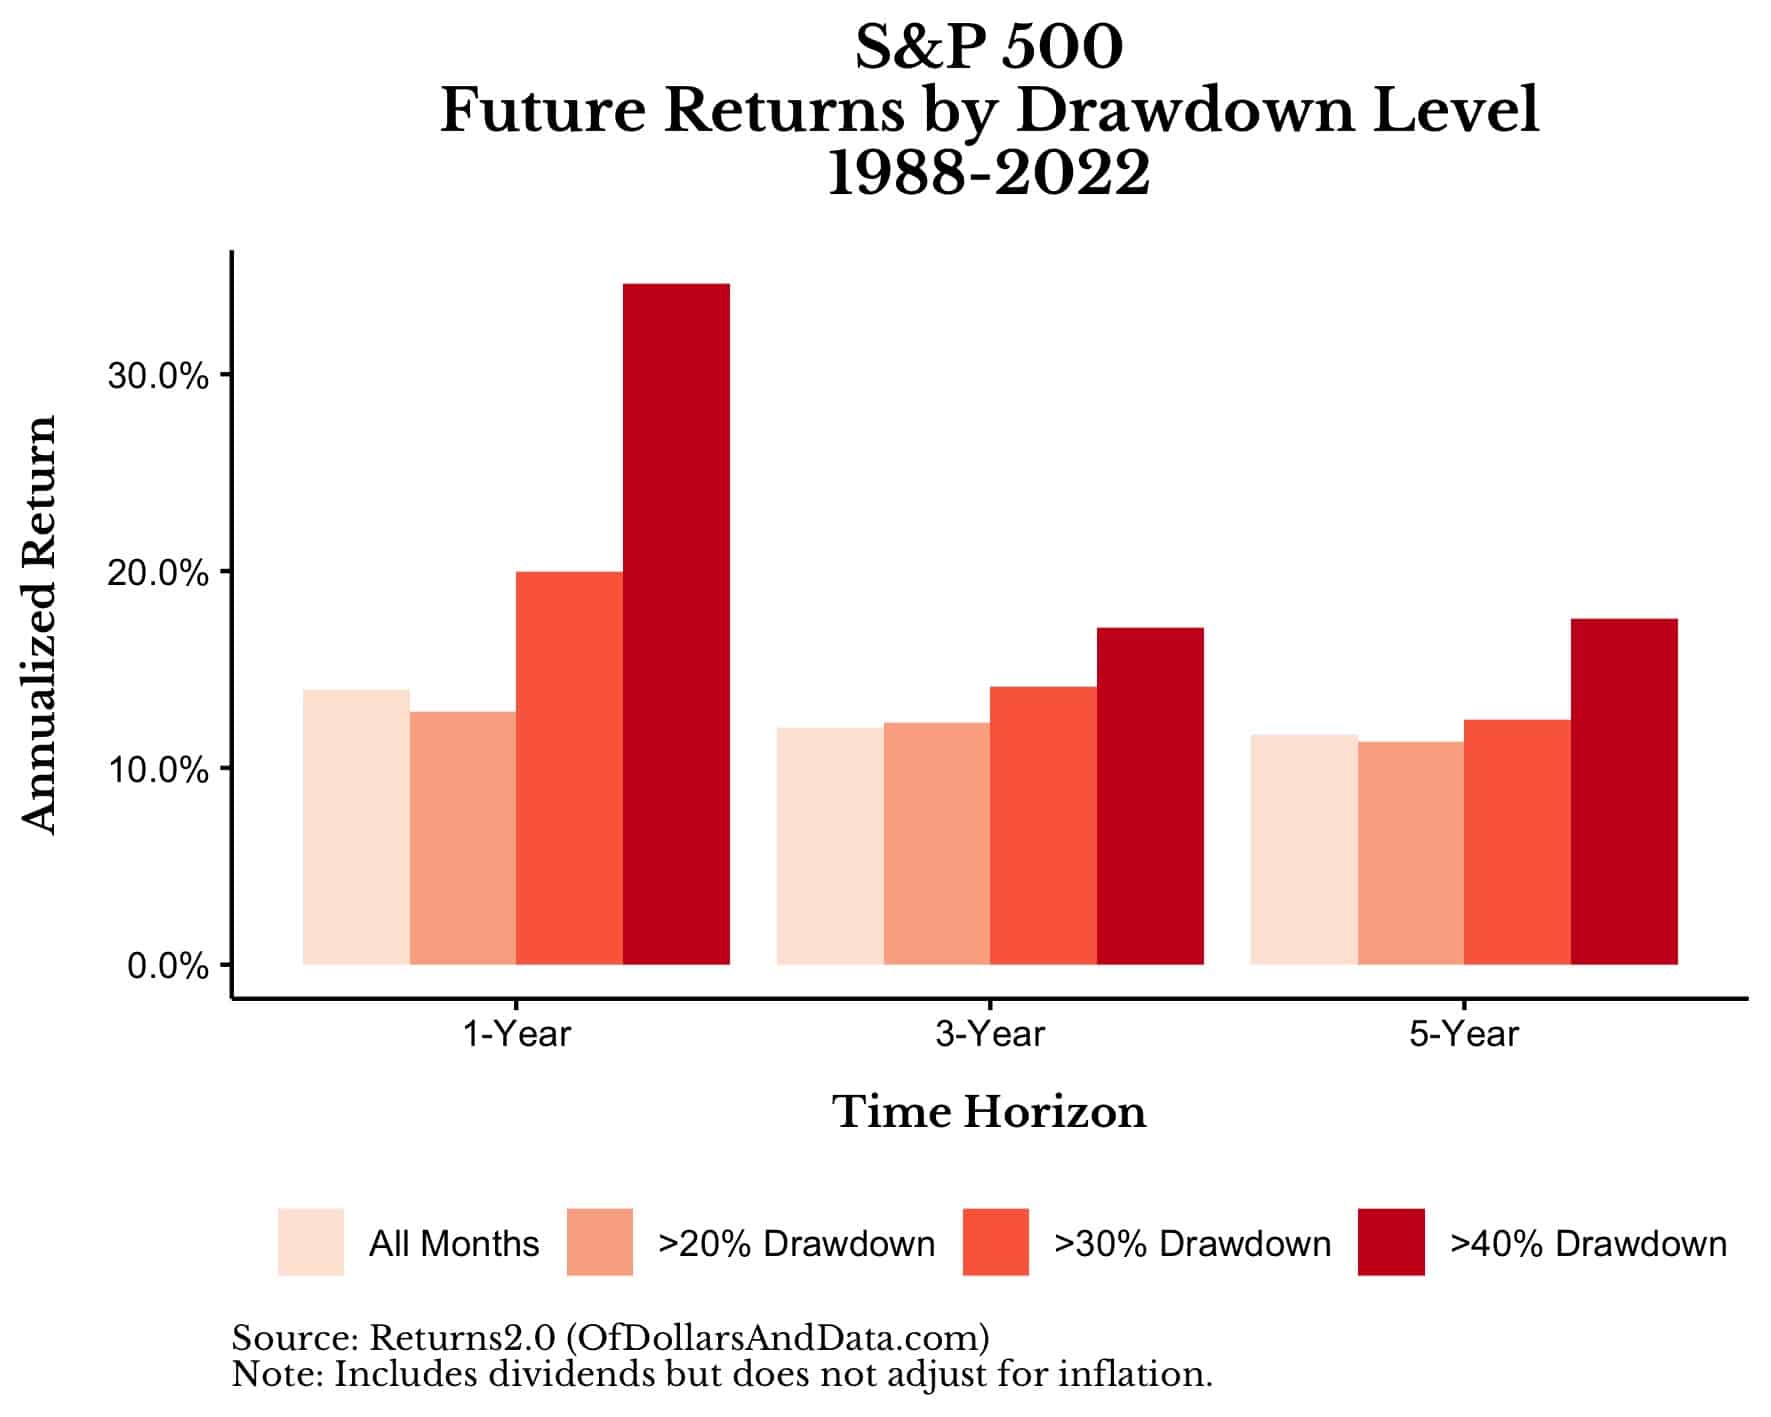
In fact, following a 30% decline since 1988, the S&P 500 has returned 20% over the next year compared to 14% (across all months) and 12.4% annually over the next five years compared to 11.7% (across all months). This suggests that there might be some short/medium-term benefits to investing more following 30%+ declines, but who knows? After all, a limited time period from a single equity market doesn’t feel like enough data to determine whether we should invest more following a market decline.
Therefore, I have also run the same analysis on the All Country World Index ex US (“ACWI ex US”) starting in 1988, when the ACWI ex US data begins. And, based on the data below, it looks like the benefit of investing following a decline in international equities is even larger than the benefit found in the US:
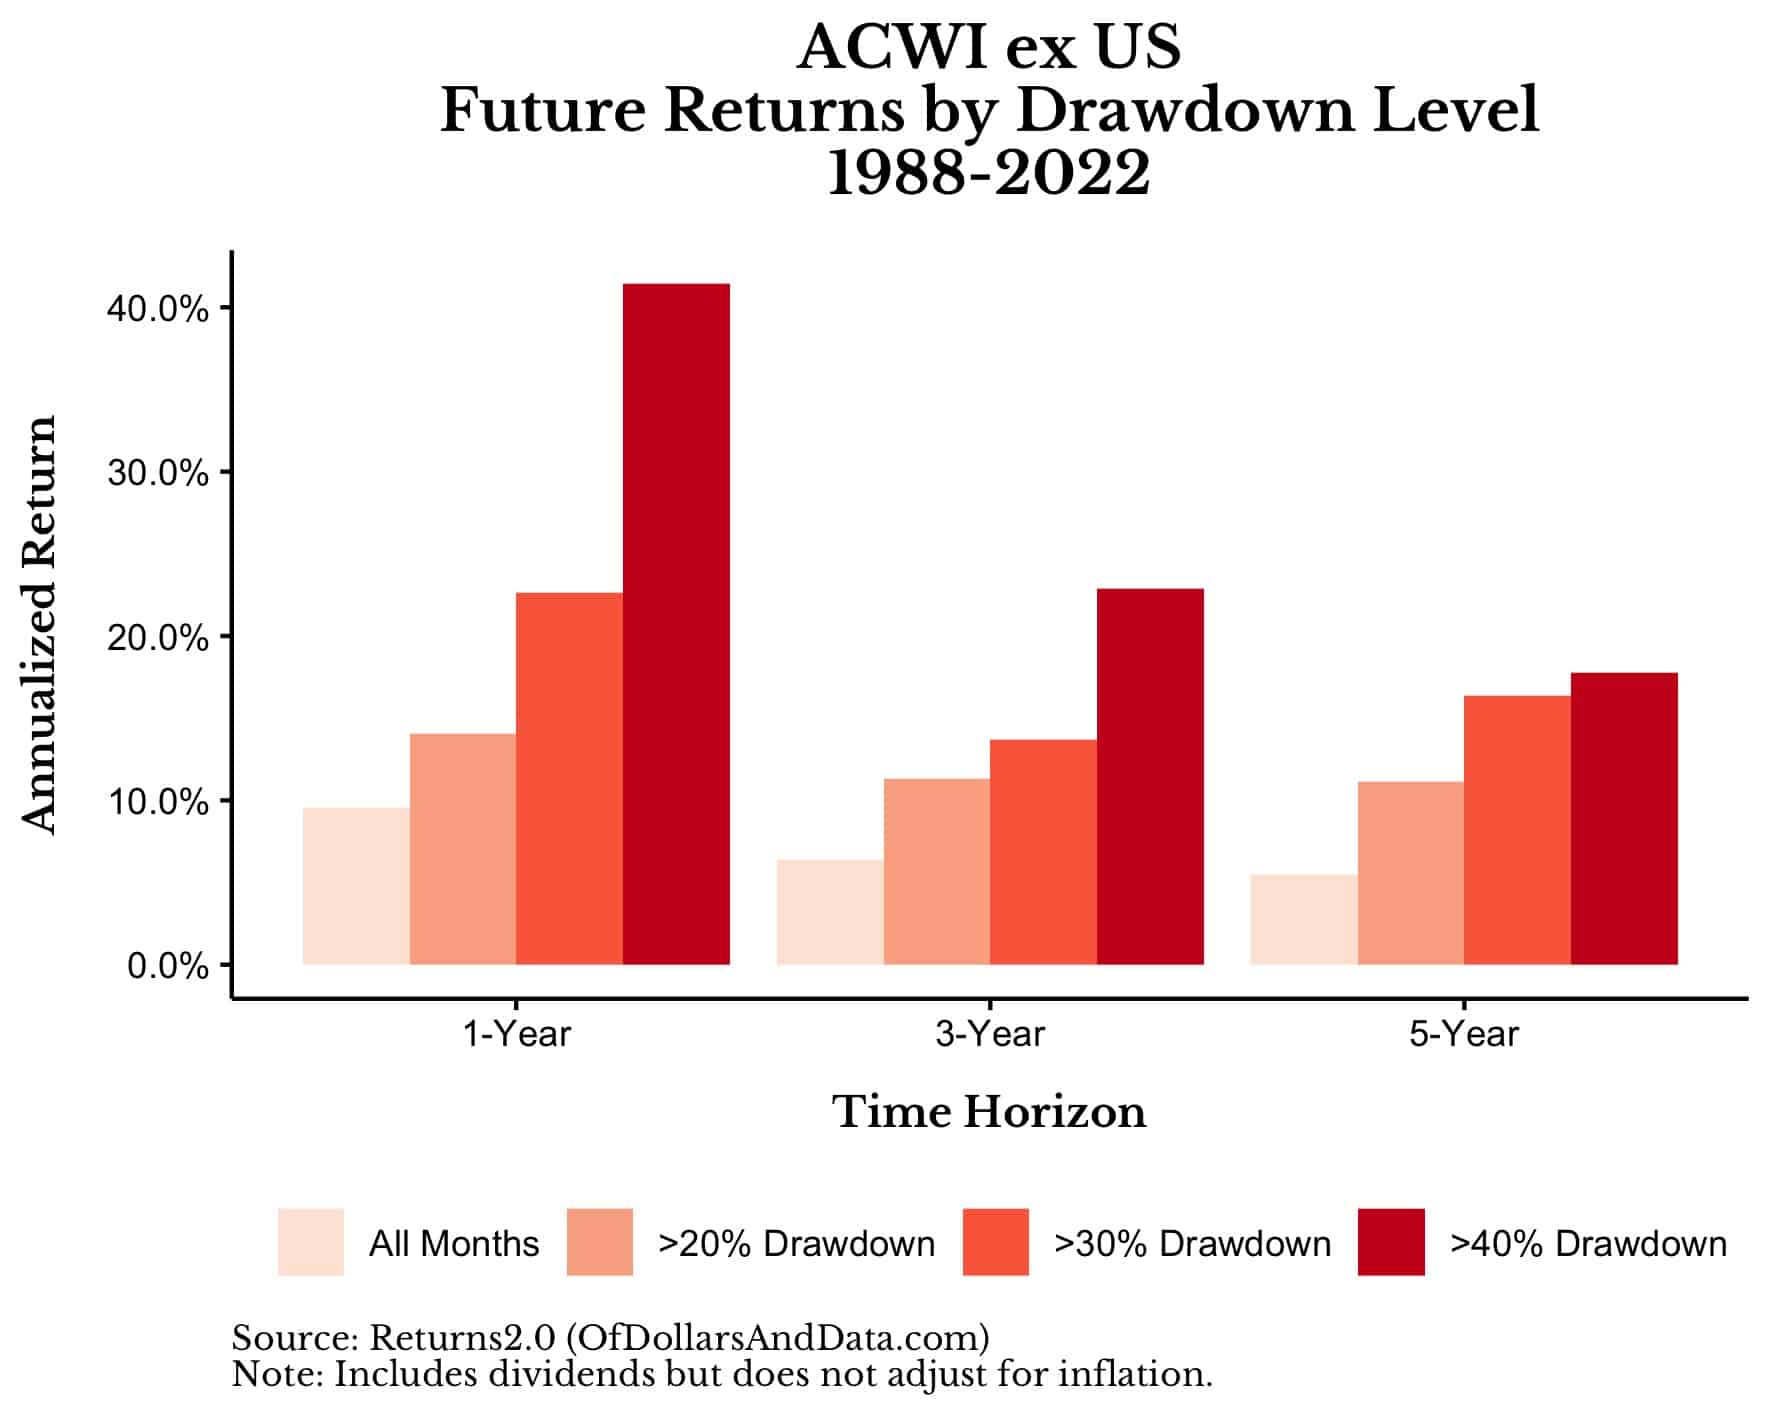
As you can see, across all drawdown thresholds tested, the future returns over the next one, three, and five years are higher than during all other months. If anything, this means that buying the dip in international equities worked better than buying the dip in the US since the late 1980s.
Given the information above, investing more after a market decline (especially a big decline) seems like a no-brainer. I don’t disagree with the data. However, there is one major issue that this strategy fails to address.
The Problem with Investing “More” After the Market Declines
So far we have demonstrated that future returns tend to be higher following a larger market decline. This implies that we should invest more money when markets are in turmoil. But, as logical as this strategy seems, it contains a fatal flaw—it creates money out of thin air. Let me explain.
Let’s go back to the example at the beginning of this article and assume you are investing $500 a month into the S&P 500. Let’s also assume that if the market declines by 40%, you will double your contributions and invest $1,000 a month going forward. My question is: where do you get this extra $500 a month from?
Do you conjure it up with a spell? Do you print it at home? Do you raise it from friends and family?
All jokes aside, this is the primary issue with this “invest more during declines” strategy. It has to have money sitting on the sidelines waiting to be invested in order to succeed. However, as I have illustrated before (see here, here, and Ch. 14 of Just Keep Buying), this will lead to less money most of the time.
You might counter that you don’t have to have “cash on the sidelines” because you could just cut your spending or raise your income once the market has declined. Yes, this is true. However, I’d counter that if you could cut your spending or raise your income at some point in the future, then you could do the same thing right now instead.
After all, why not make those changes now and start investing that extra money today? Statistically, you would be better off around 80% of the time and you wouldn’t have to wait for a future dip either. Of course, this doesn’t feel as good as investing during a “generational buying opportunity” or telling your friends that you “bought the dip,” but you can’t have it all.
No matter what you decide to do, increasing your contributions after a severe market decline is likely to be more rewarding than buying during normal times. However, don’t forget that if you can find extra cash during a decline, you can probably find that extra cash now as well.
Happy investing and thank you for reading!
If you liked this post, consider signing up for my newsletter.
This is post 312. Any code I have related to this post can be found here with the same numbering: https://github.com/nmaggiulli/of-dollars-and-data

