It had been nine days since Volkert Evertszoon and his fellow shipmates had consumed anything other than their own urine. The men were on death’s door as their longboat floated helplessly throughout the western part of the Indian Ocean. Then…a miracle occurred. After washing ashore a remote islet on the north eastern side of Mauritius, they spotted the answer to their prayers. Enter the dodo:

Though the dodo was first spotted in the 1590s, and subsequently hunted to extinction throughout Mauritius, these flightless birds still roamed free on the island where Evertszoon and his men had landed. However, this wouldn’t last long.
The dodo had no fear of humans and approached Evertszoon and his shipmates as soon as they arrived. Evertszoon describes the interaction, which was the beginning of the end for the dodo:
We could catch them with our hands…[and after catching one flock, another flock] came running as fast as they could to its assistance, and by which they were caught and made prisoners also.
The men feasted on the birds for months during the spring of 1662 in what became the last recorded sighting of the dodo before it went extinct.
The story of the dodo’s last stand is told in When Hitler Took Cocaine and Lenin Lost His Brain: History’s Unknown Chapters by Giles Milton, and provides an important lesson on the power of expectations. From the perspective of the dodo, the arrival of humans (or any other large predator) was outside the realm of its evolutionary grasp. Anything the dodo had approached previously had not tried to eat it. However, the arrival of humans broke the old pattern. It was beyond all expectations.
This idea is directly relevant to how investors use historical financial data to make decisions about the future. We assume that history is a great guide for what is to come, which is only sometimes true. We rely heavily on previous patterns…until they break. This is the classic black swan problem explained by Nassim Taleb, and highlights the difficulty with relying on financial history to make predictions.
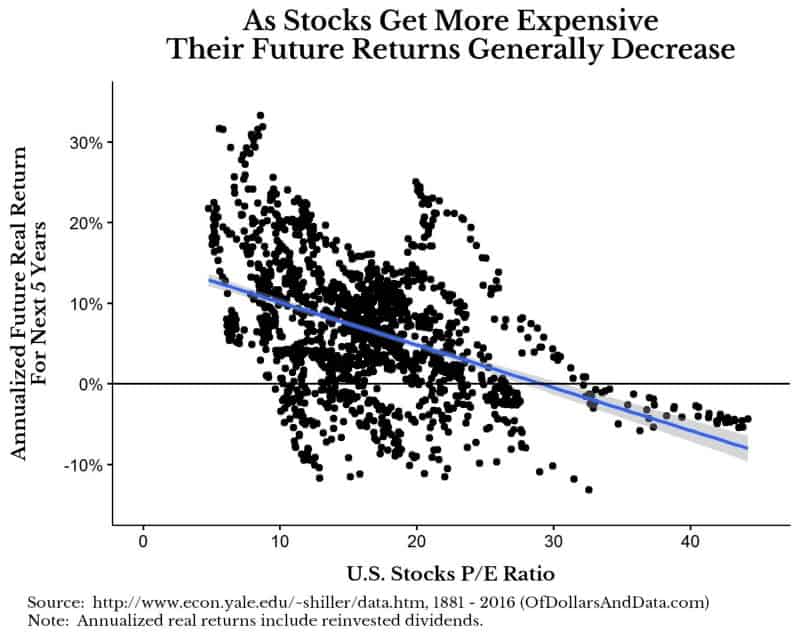
For example, let’s consider one piece of financial data that is thrown around a lot and seems unhelpful most of the time: cyclically adjusted price-to-earnings ratio or CAPE. The CAPE for U.S. stocks as of early December 2017 stands at ~32. Many investors assume this means that the market must be overvalued. The old pattern is: high CAPE = bubble. I understand the logic. I have shown previously that there is a negative relationship between the current valuation (i.e. CAPE) of U.S. stocks and their real returns for the next 5 years:
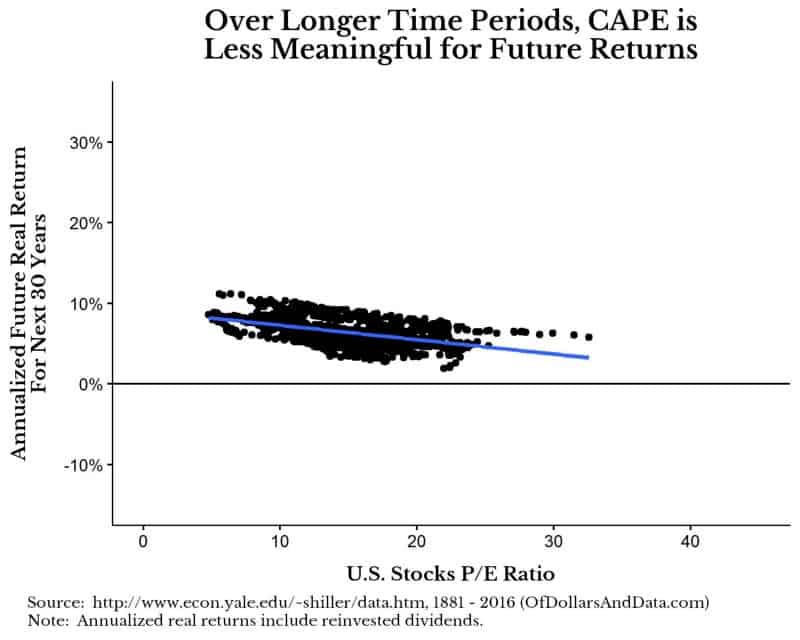
However, when we look over longer time periods, this relationship breaks down. Below is the same chart as the one above, but for real returns over the next 30 years:
Yet, we can take this idea one step further and show U.S. stock prices with regards to CAPE since 1900. Below I plotted the real price + dividends of U.S. stocks (index is on a log scale) with a heatmap in the background that corresponds to the current CAPE value during that month. Note that higher CAPE values are red and lower CAPE values are blue:
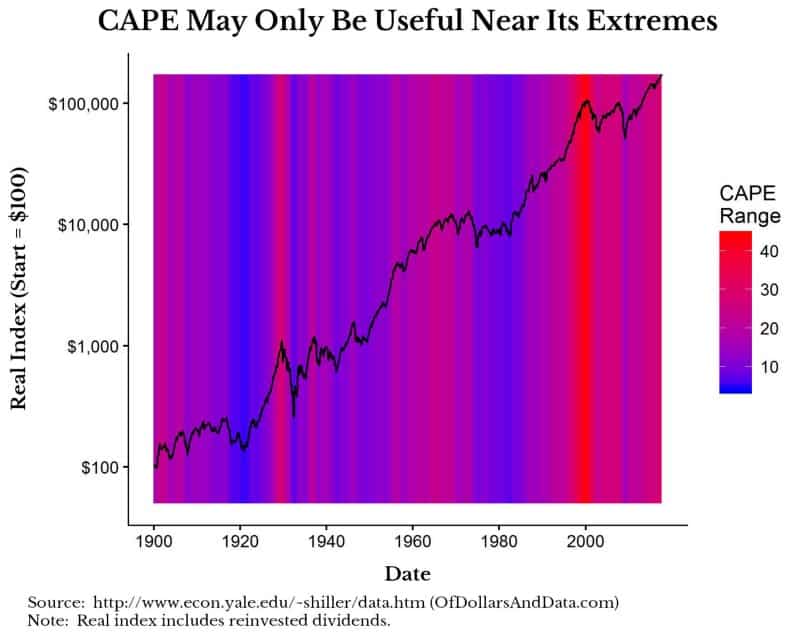
As you can see, a higher CAPE ratio is typically correlated with stock market peaks, but this is not always true. The problem with these charts is that the conclusions we could draw from them are limited. Why? Nearly all of the months with a CAPE > 30 occurred in just two time periods: the Great Depression (1929) and the DotCom Crash (1999). So as “predictive” as they might seem, we simply don’t have enough U.S. market history to examine.
So does the current CAPE > 30 = bubble? I don’t know, but there doesn’t seem to be enough data to justify it with a high degree of certainty. In addition, how CAPE is defined has technically changed over time. Jeremy Schwartz, Director of Research at Wisdom Tree, recently discussed how changing earnings definitions could affect the measurement of CAPE. Therefore, the jury is still out. Personally, when it comes to CAPE or other financial data, I take Cliff Asness’ view of only getting excited around the 150th percentile (i.e. 150% of the prior 100th percentile, or something we’ve never experienced before).
What does this mean for you as an investor? It means to expect the unexpected. Who thought Trump would be the President? Who thought the Patriots would come back to win Super Bowl 51? Who thought Bitcoin would hit $10,000? Very few. So why should CAPE > 30 be any different? As Josh Brown (or Morgan Housel) famously said:
Not only is this time different, every time is different.
The False Sense of Security
Despite my arguments against the helpfulness of some financial data, I don’t think financial data is useless (this is of Dollars and Data after all). However, I do think financial history gives us a false sense of security. Humans excel at pattern recognition, which is the very thing that has led to many of the biggest blunders in investment history. Consider a few of the more famous failures of pattern recognition:
- Housing prices can’t fall across the U.S. at the same time…until they do.
- Long Term Capital Management (LTCM) couldn’t lose more than $35 million in a single day…until they lost $553 million on a Friday in August 1998. This was based on their expectations about interest rate spreads.
- When the internet was first available for public commercial use in mid-1989, I would bet that over 99% of DCF valuation models did not include it in their calculations. The internet broke the old pattern of valuation and then broke it again when the dotcom bubble burst.
This reminds me of a joke Howard Marks told in The Most Important Thing:
I tell my father’s story of the gambler who lost regularly. One day he hears about a race with only one horse in it, so he bet the rent money. Halfway around the track, the horse jumped over the fence and ran away.
This is the pattern breaking that has come to define our world. Just like the dodo, investors are on their own island of financial history with no clue what will wash ashore from the seas of tomorrow. We feel safe on our island, but the ocean will continue to bring chaos. We learn from the past though our returns come from a future that is inherently uncertain. We can hold onto our old beliefs…until something comes along and makes them go the way of the dodo. Thank you for reading!
If you liked this post, consider signing up for my newsletter.
This is post 49. Any code I have related to this post can be found here with the same numbering: https://github.com/nmaggiulli/of-dollars-and-data

