The goal of this post is to change the way you think about buying assets during a panic. But first, some context.
How Bad is this Decline?
As of this morning (3/23/2020), the Dow Jones is 35% off its highs, in what has been one of the worst months in U.S. stock market history.
If we analyze every decline greater than 30% back to 1915, you can see that our current crash is one of the fastest ever:
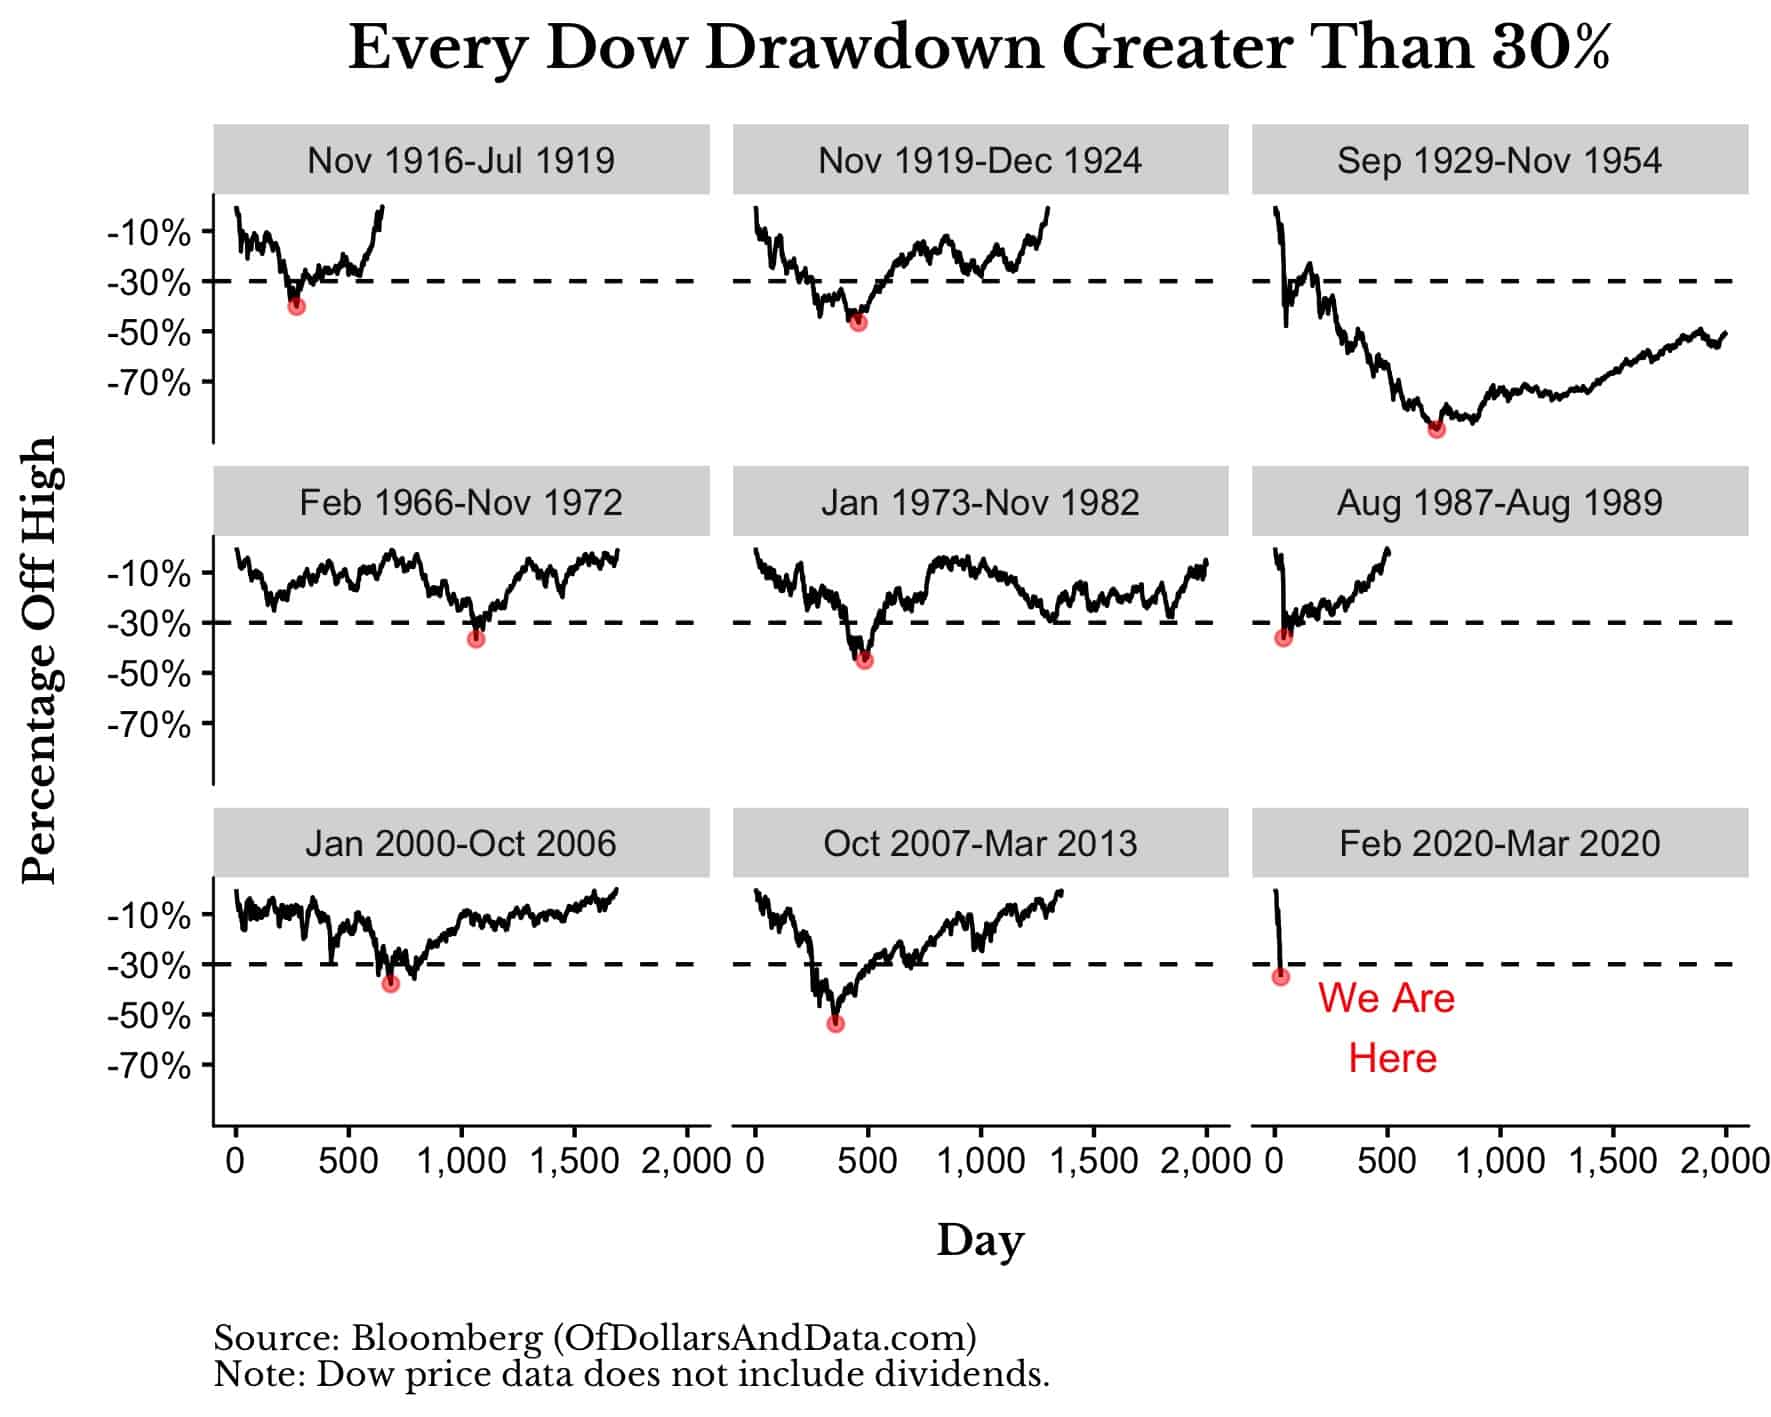
More importantly though, while all the crashes prior to today have their respective bottoms marked with red, we have no clue whether we are anywhere near the bottom for the coronavirus crash.
The Upside for Current Buyers
Nevertheless, there is a silver lining for investors who are buyers of equities right now. Every dollar they invest in the current market environment will grow to far more than one invested in months prior, assuming that the market eventually recovers.
To demonstrate this, let’s imagine that you decided to invest $100 every month into U.S. stocks from September 1929 to November 1954 (i.e. the 1929 crash and recovery).
If you were to follow such a strategy, here is what each $100 monthly payment would have grown to (including dividends and adjusted for inflation) by the time U.S. stocks recovered in November 1954:
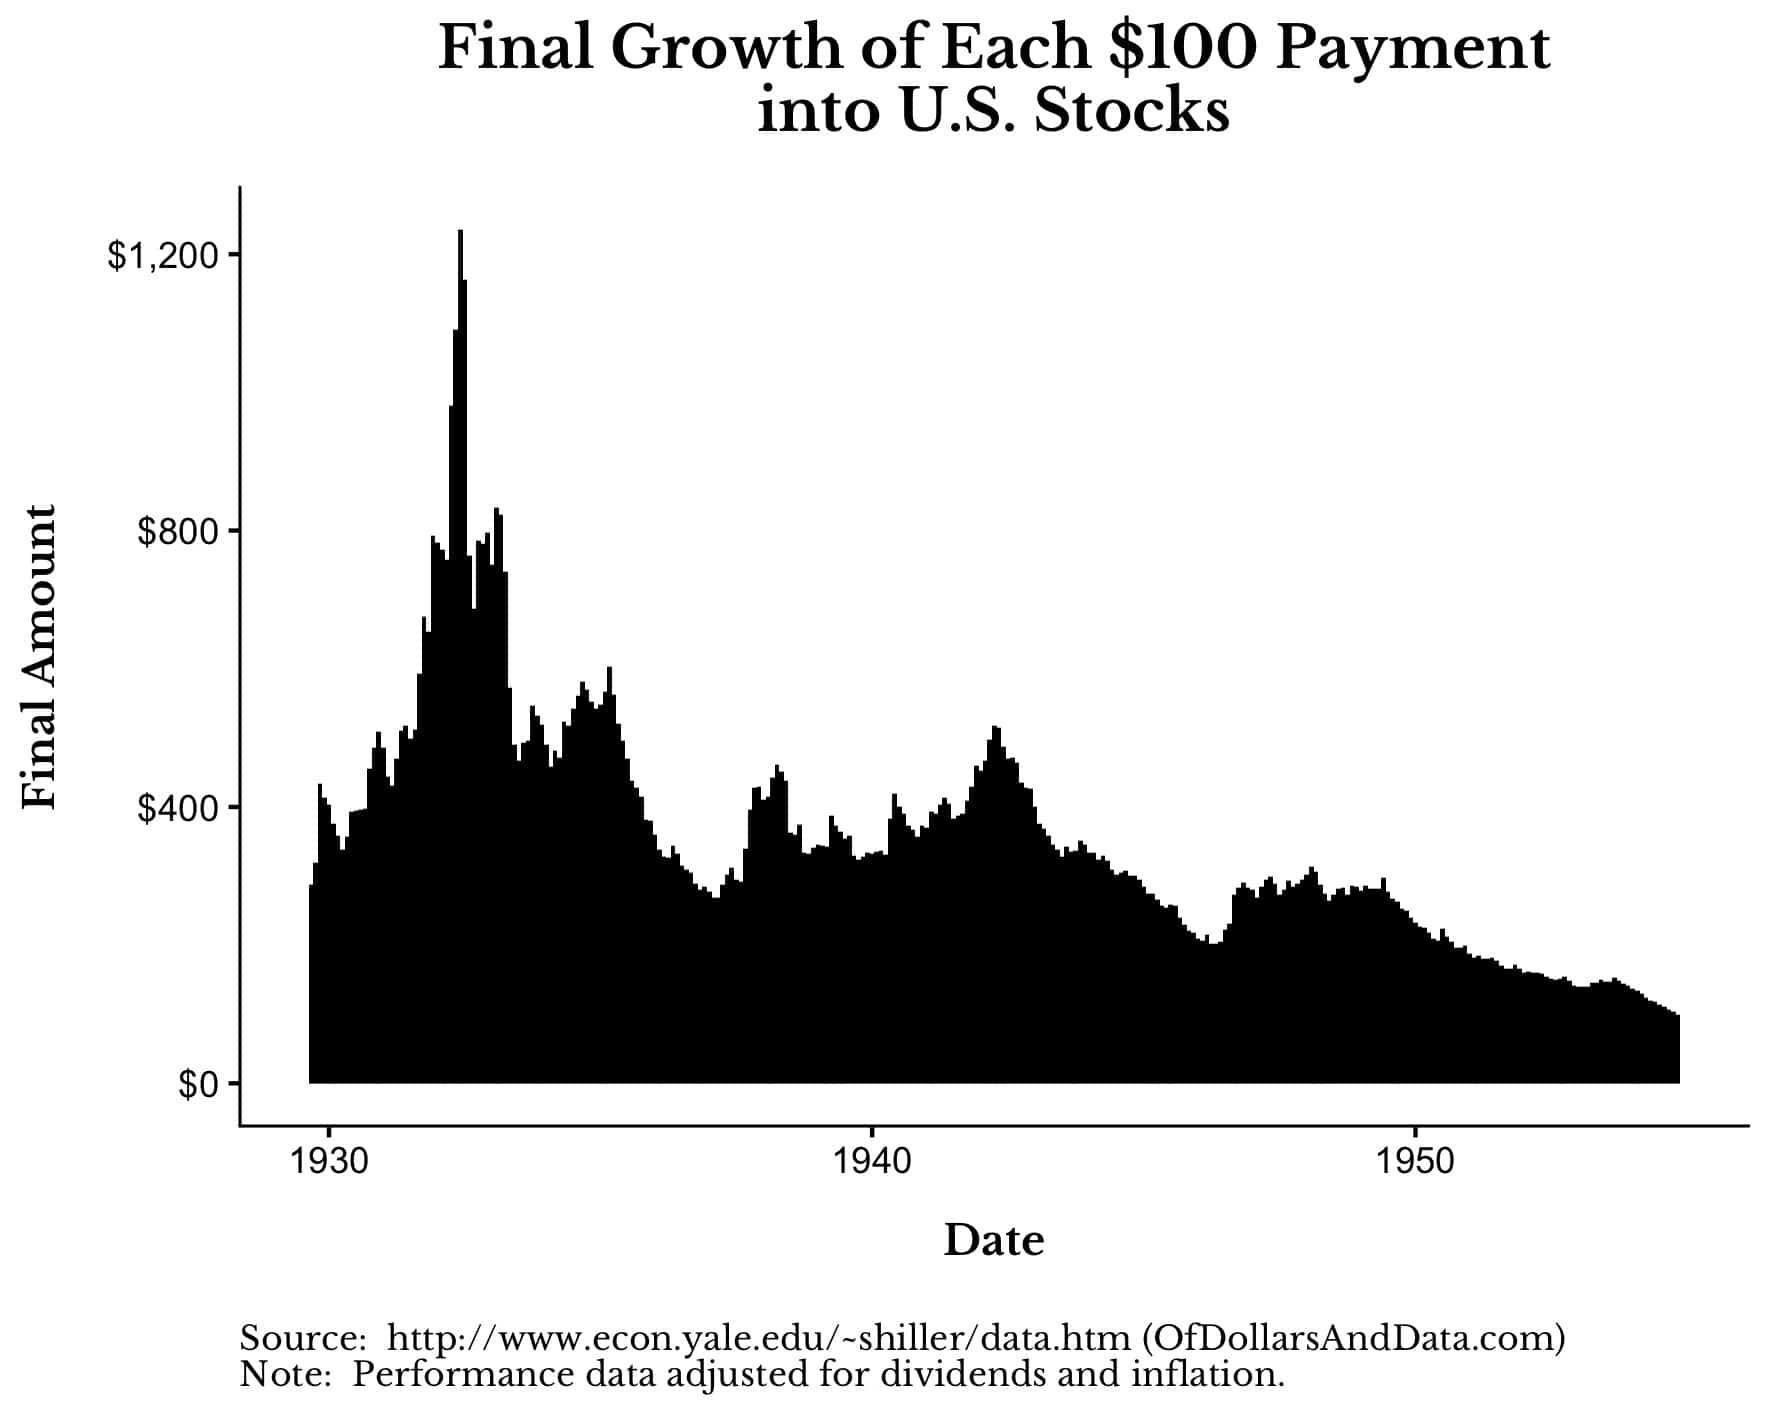 As you can see, the closer you bought to the bottom in the summer of 1932, the greater the long term benefit of that purchase. Every $100 invested at the lows would grow to $1,200, which is 3x greater than the growth of a $100 purchase made in 1930 ($400).
Yes, the amounts in the chart above are biased because the Dow’s price recovery took multiple decades [Author’s note: If we included dividends and inflation U.S. stocks had recovered by 1937, not 1954].
However, even if we look at the other 30%+ declines identified earlier, we see a sizable benefit to purchasing during these major dips:
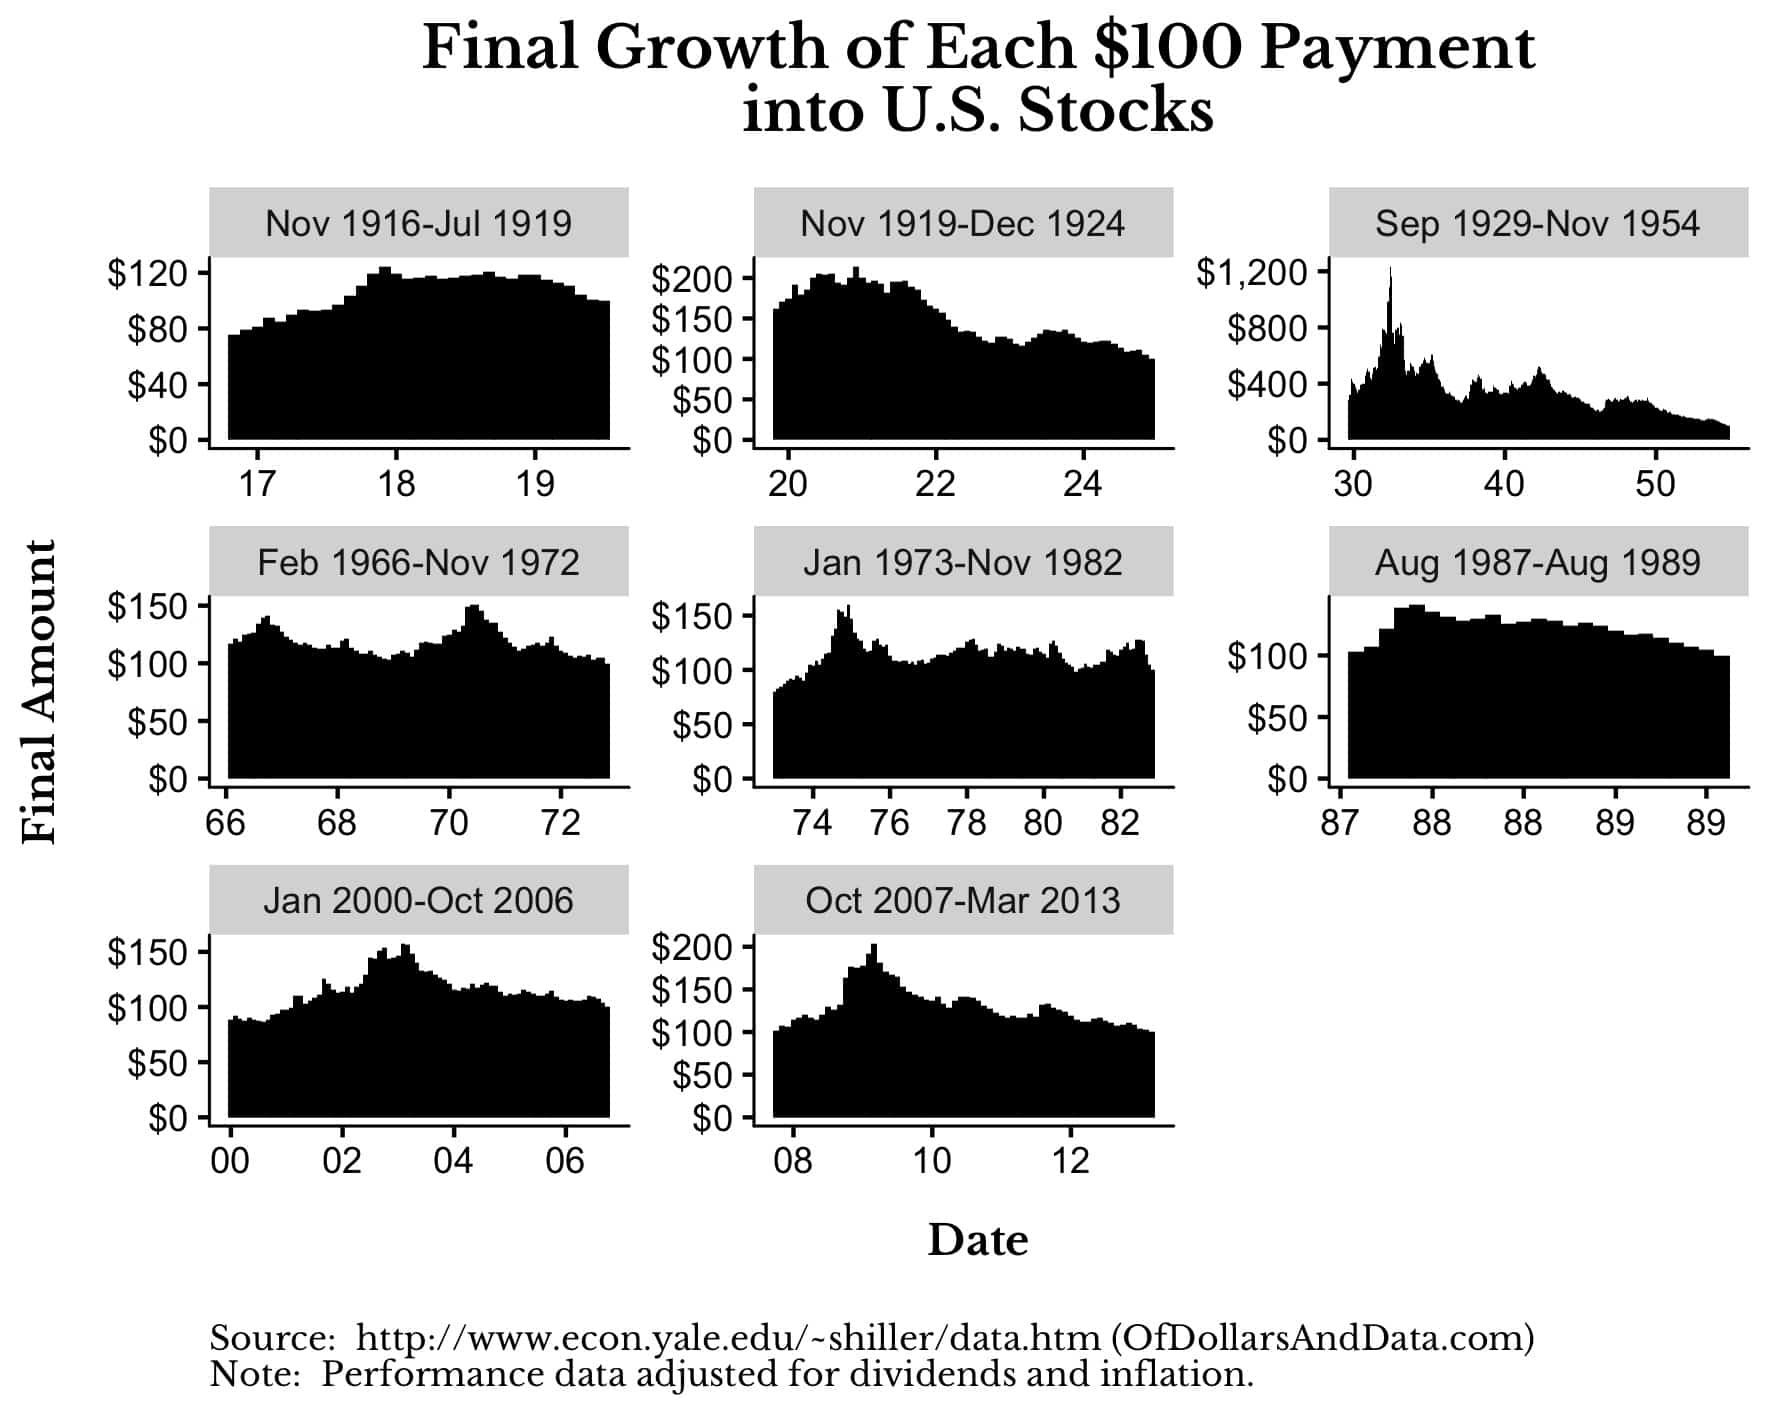
This plot demonstrates that buying nearer the bottom usually provides 50-100% in additional growth compared to investing during other periods. This means that your same $100 would grow to $150 or $200 (adjusted for inflation) by the time the market recovered.
Where does this upside come from? It comes from a simple mathematical fact: every percentage loss requires an even larger percentage gain to get back to even.
Losing 10% requires an 11.11% gain to recover, losing 20% requires a 25% gain to recover, and losing 50% requires a 100% gain (a doubling) to recover. You can see this exponential relationship more clearly here:
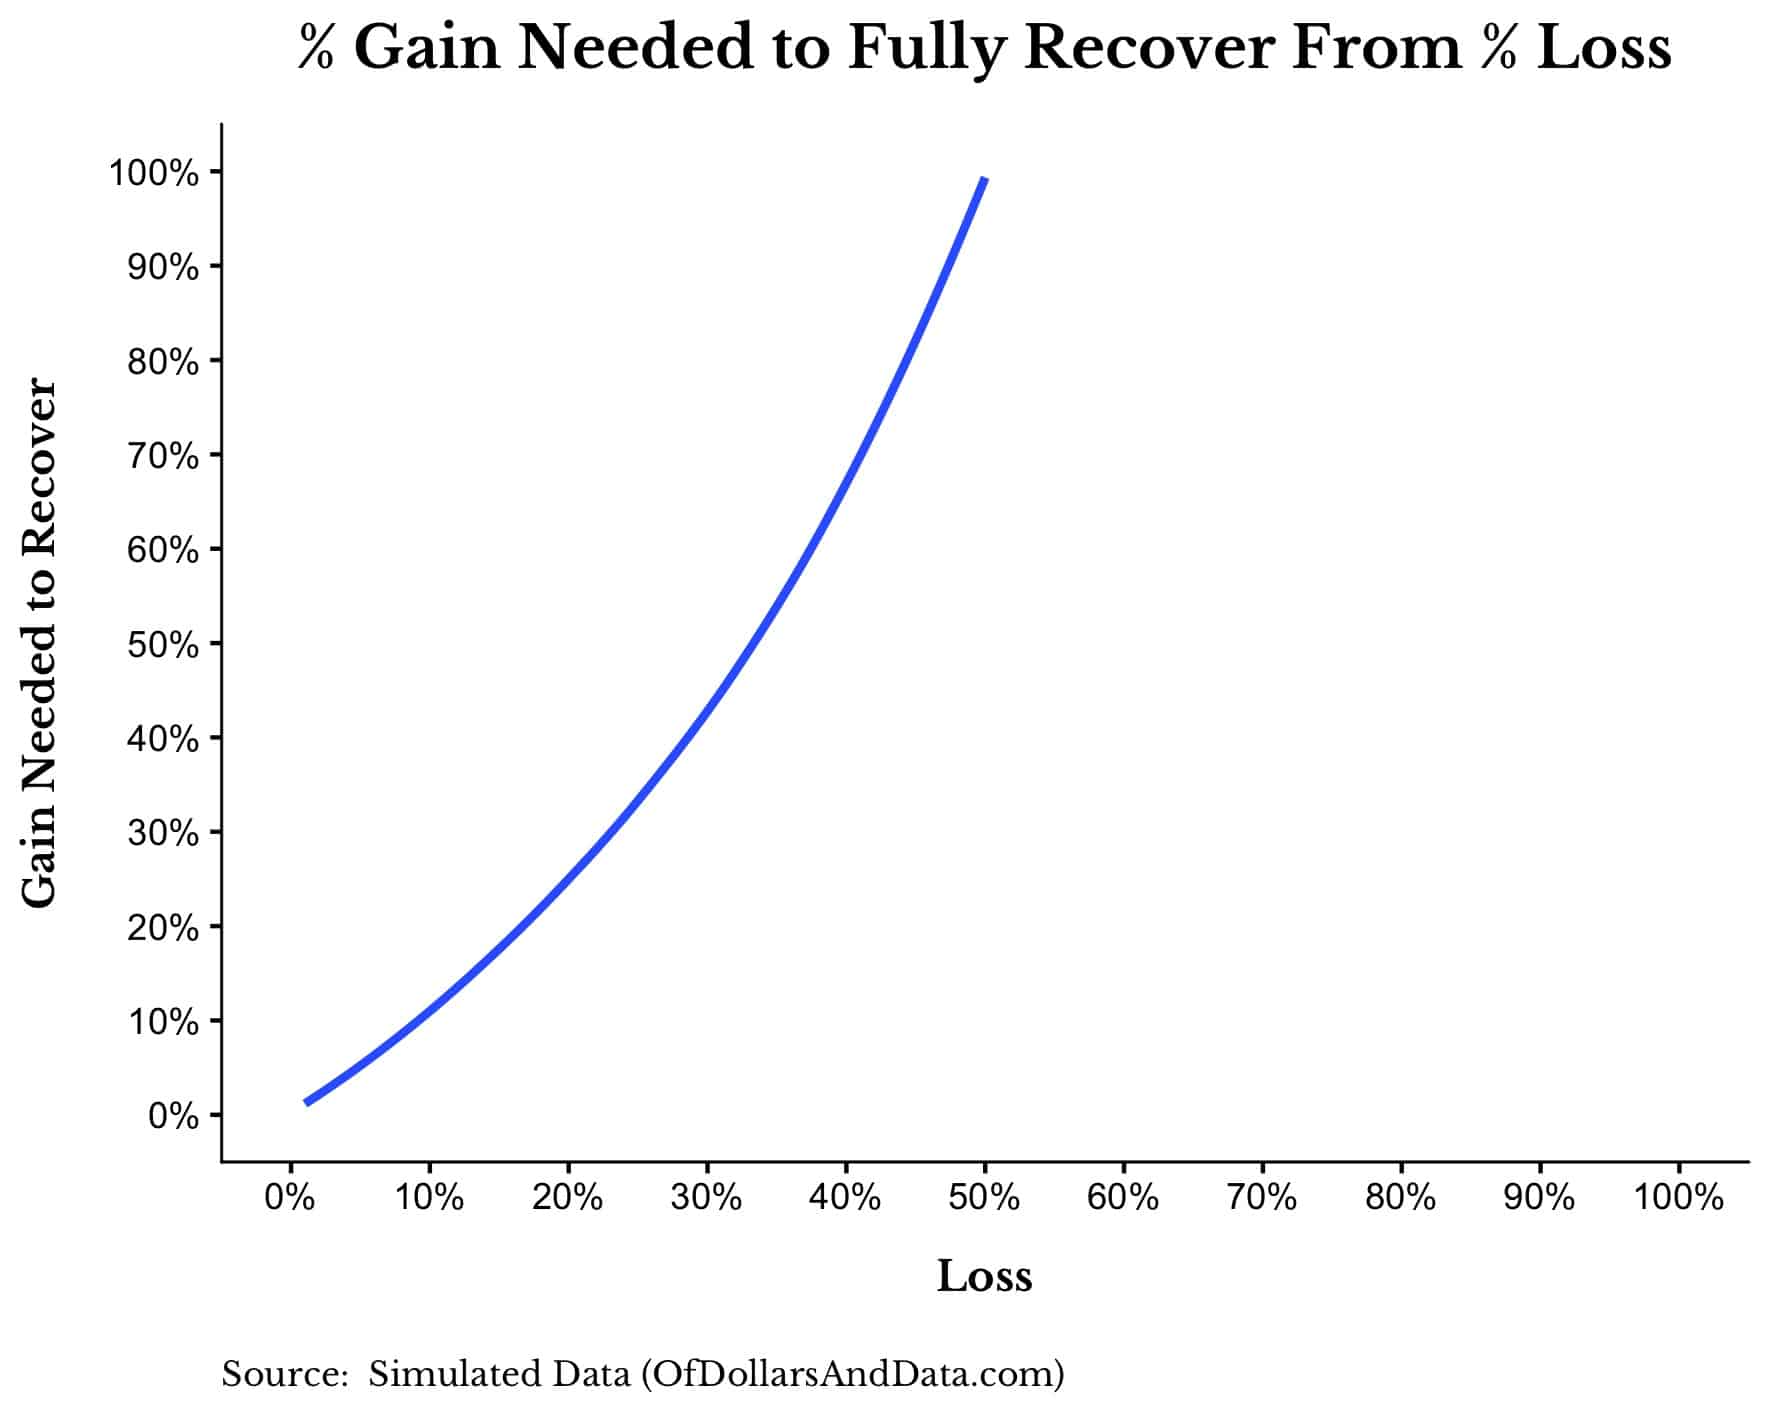
And if you plug in the size of the current decline (~33% loss), you can see how much of a gain we would need to recover:
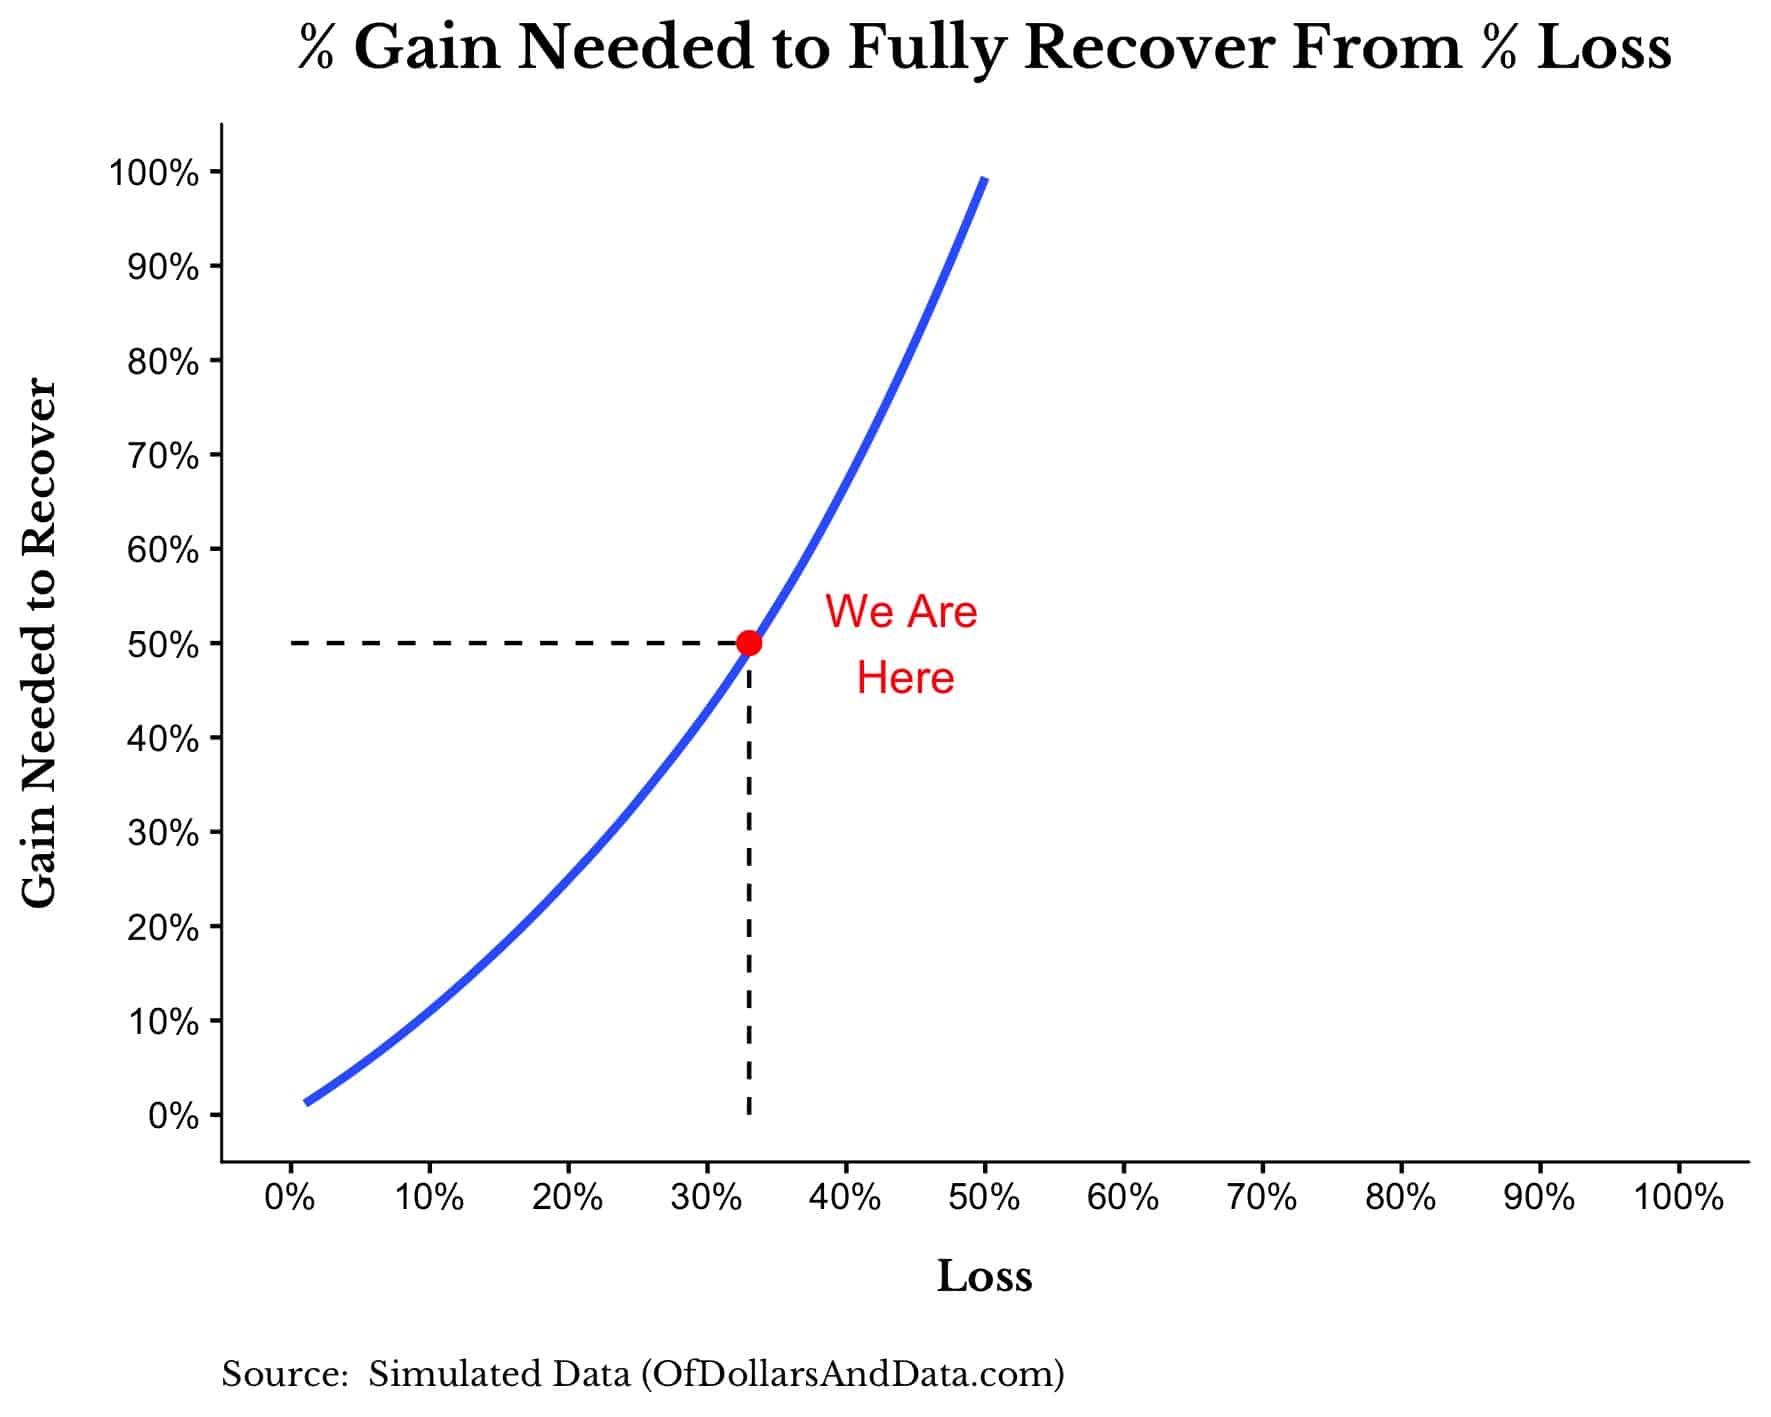
Without any further decline, the market has to go up 50% to get back to even. This is why every $100 invested now, will grow to $150 (50% more) by the time a recovery occurs.
Reframing the Upside
Despite the seemingly obvious upside to buying during the current panic, many investors (even those sitting on lots of cash) are afraid to do so. This seems to be partially an issue with uncertainty around a further decline, but it also seems to be a framing issue as well.
To re-frame this discussion, please answer the following question:
How long do you think it will take before the market reaches a new all-time high?
Will it take a month? A year? A decade?
How long do you think it will take for the market to recover from its current 33% loss?
Got your answer?
Good.
Based on that answer, we can back out your expected annual return for the market going forward. The equation for this is:
Expected Annual Return = (1 + % Gain Needed to Recover)^(1/Number of Years to Recover) – 1
But since we know that the “% Gain Needed to Recover” is 50%, we can simplify this to:
Expected Annual Return = (1.5)^(1/Number of Years to Recover) – 1
So, if you think the market recovery will take:
- 1 year, then your expected annual return = 50%
- 2 years, then your expected annual return = 22%
- 3 years, then your expected annual return = 14%
- 4 years, then your expected annual return = 11%
- 5 years, then your expected annual return = 8%
Even at 5 years for a full recovery, the market would be providing a return roughly in line with its historical average. I asked FinTwit the same question and discovered that two out of three poll participants believe it will take 3 years (or less) for a full recovery:
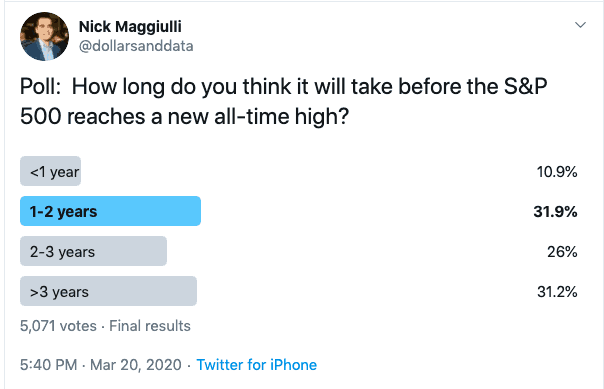
And if FinTwit is right, this implies that any money invested today in U.S. stocks will receive a 14% annualized return (or better) between now and the recovery.
Think about what this means. If you aren’t buying at these levels, you are implying that (a) you don’t want 14% annual returns for the next 3 years or (b) you think it will take markets considerably longer to recover compared to consensus estimates.
Even if we assume it takes 5 years to recover, that would be 8% returns over the next half decade. Where else can you get 8% right now?
Nowhere.
Of course, U.S. markets may take decades or more to recover. After all, Japan still hasn’t recovered from the greatest asset bubble of all time. Could the U.S. follow suit? Maybe, but it doesn’t seem likely.
As Jim O’Shaughnessy once said (emphasis mine):
Many people confuse possibility with probability and the two are almost exact opposites.
Please try to keep this in mind as we face additional challenges in the coming months.
Simple Math
The one thing that never ceases to amaze me is how much clarity can come from a little bit of simple math. It’s a sanity check on a world filled with hysteria.
And the simple math shows that, if we assume that the market will recover within the next few years, future returns are looking quite attractive right now.
Of course, maybe this assumption isn’t true. But, if it is true, then every additional decline from here on out is another buying opportunity. Another chance to take advantage of temporarily depressed prices. Another chance to just keep buying.
Unfortunately, many investors won’t see it this way. They won’t be persuaded with logical arguments in a game that is drowned in emotion. I don’t blame them though. Because simple math is never that simple.
Thank you for reading!
If you liked this post, consider signing up for my newsletter.
This is post 172. Any code I have related to this post can be found here with the same numbering: https://github.com/nmaggiulli/of-dollars-and-data

