Imagine I present to you a magical box that can turn your money into more money. The only problem is that you don’t know exactly how much more money you’ll get from this box. You could put $100 into the box and get back $200, $400, or maybe only $150 when all is said and done. Also, there’s one final catch—you have to wait many decades for this extra money to materialize. The box needs time to work its magic after all. Given this information, would you use the box?
While no person in their right mind would accept this offer of monetary wizardry in the real world, the box isn’t as imaginary as it seems. In fact, the box isn’t made up at all. Because the box is a diversified portfolio of stocks and bonds. But this leads us to a more important question: how much growth can we expect from such a portfolio? How much money does “the box” typically return to us?
To answer this question I ran a simulation where someone invests $10,000 a year (i.e. dollar-cost averaging or DCA) into a 80% stock/20% bond portfolio of either (1) U.S. stocks and U.S bonds or (2) Global stocks and U.S. bonds and rebalances annually over various time periods. I chose an 80/20 because I think this portfolio is a better representation of what many retail investors would use and I included Global stocks to reduce any bias in my results from a U.S.-only stock portfolio.
How Much Growth Over 10 Years?
To start, we will examine the results of this simulation over 10 years (i.e. $10,000 invested for 10 years or $100,000 total) for every 10-year period from 1970-2022. Note that every point on the lines below represent one 10-year simulation for each portfolio and that all performance includes dividends and is adjusted for inflation. Lastly, the dashed horizontal line represents the total invested amount or basis, which you can use to visually tell how well a portfolio did compared to how much money was invested in it:
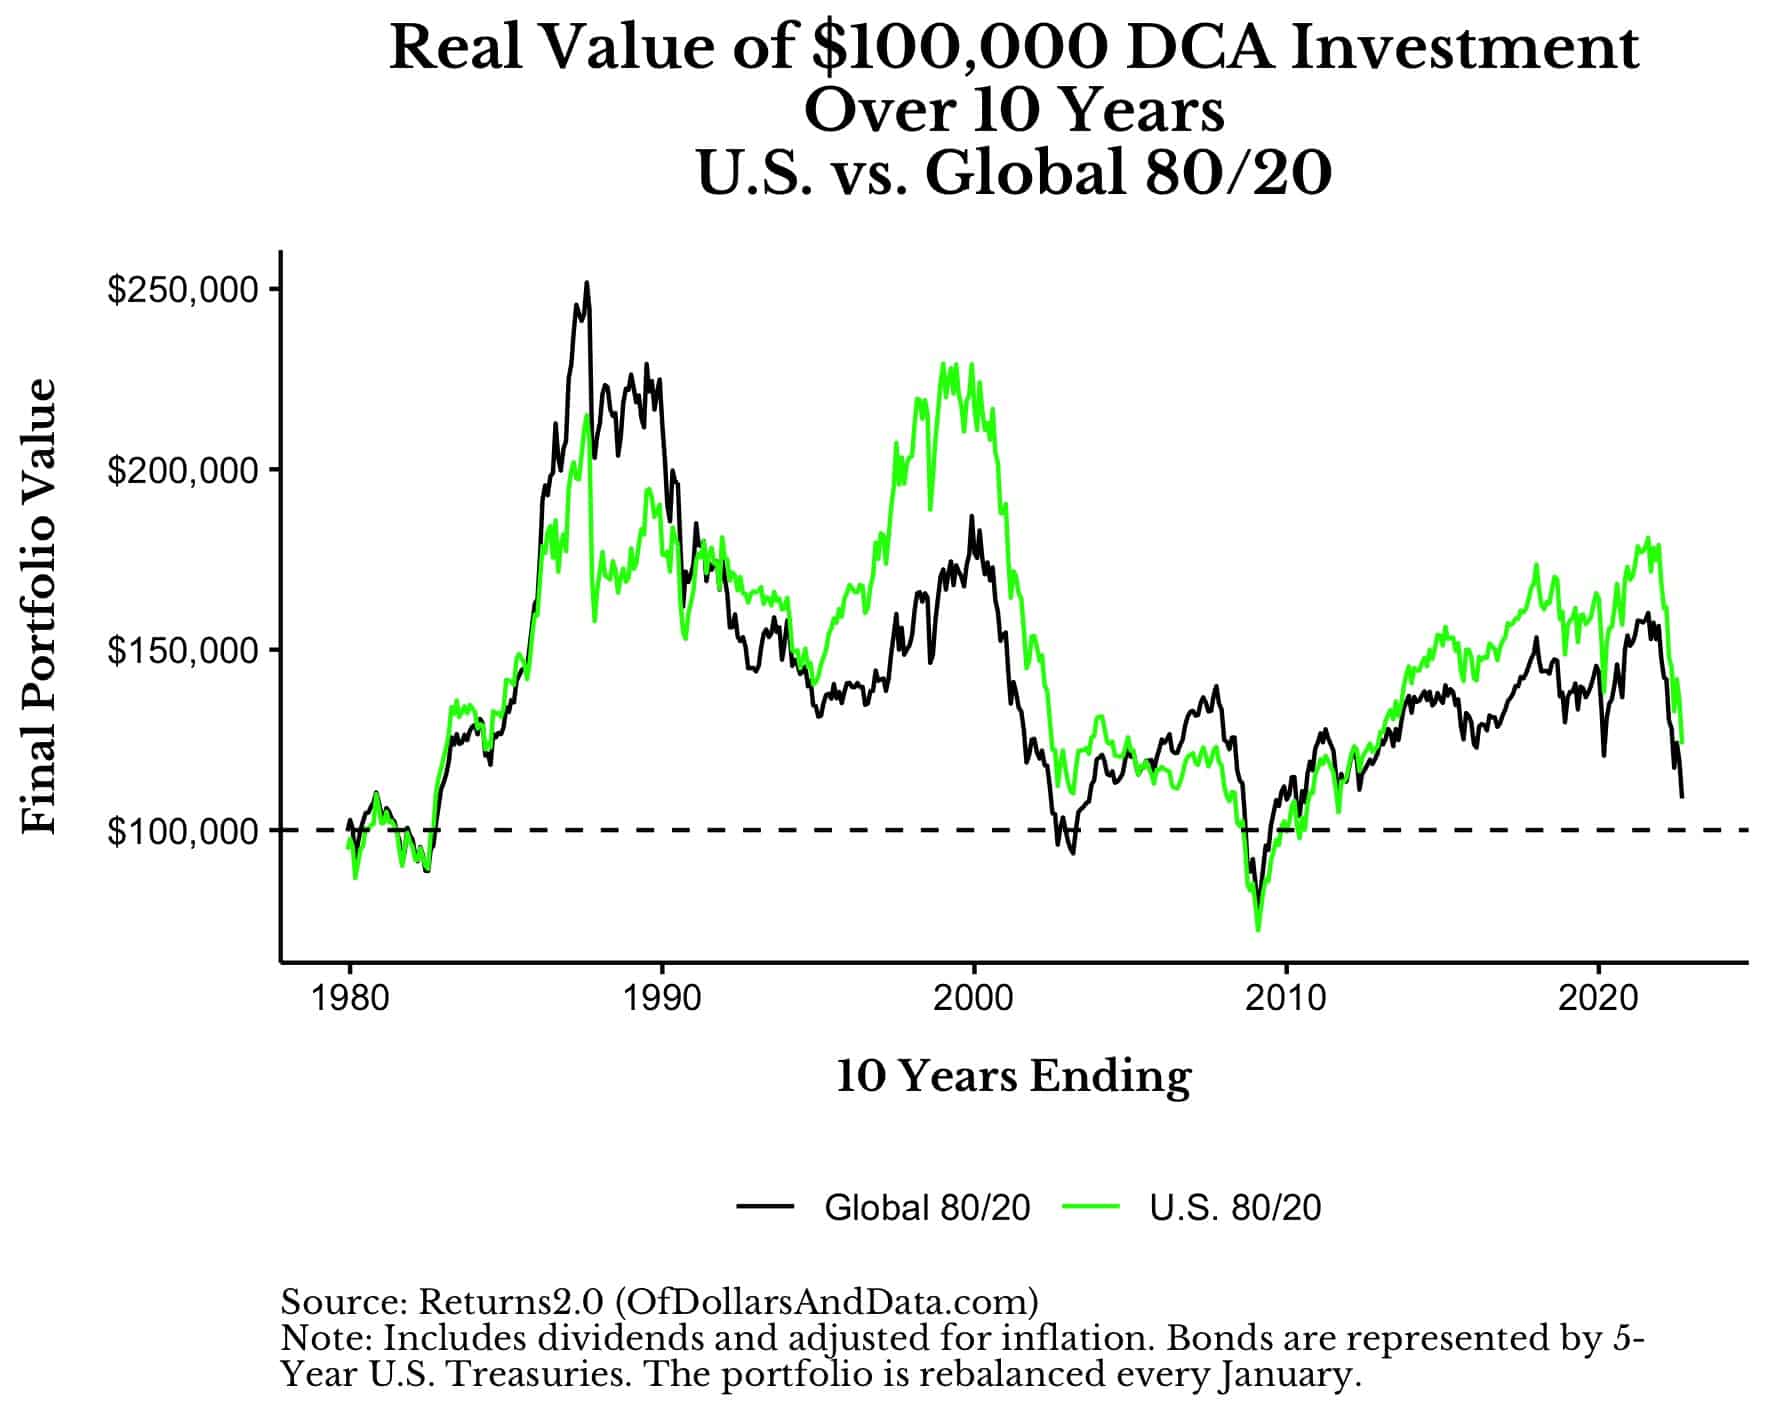
As you can see, the Global 80/20 outperformed the U.S. 80/20 portfolio in some periods but underperformed in others. More importantly, during most 10-year periods both the U.S. 80/20 and the Global 80/20 portfolio would have made money (i.e. the final value of the portfolio would have been greater than the $100,000 basis). To be specific, the typical (median) growth after 10 years was 1.35x (35%) for the Global 80/20 portfolio and 1.5x (50%) for the U.S 80/20 portfolio.
In other words, after investing $10,000 a year for 10 years (i.e. a $100,000 basis), you were likely to have $135,000 in the Global 80/20 portfolio and $150,000 in the U.S. 80/20 portfolio. However, if we were to extend this analysis to longer time horizons, the performance would be even better.
What About Over 20 or 30 Years?
Below is the same simulation as above extended out over a 20-year time horizon:
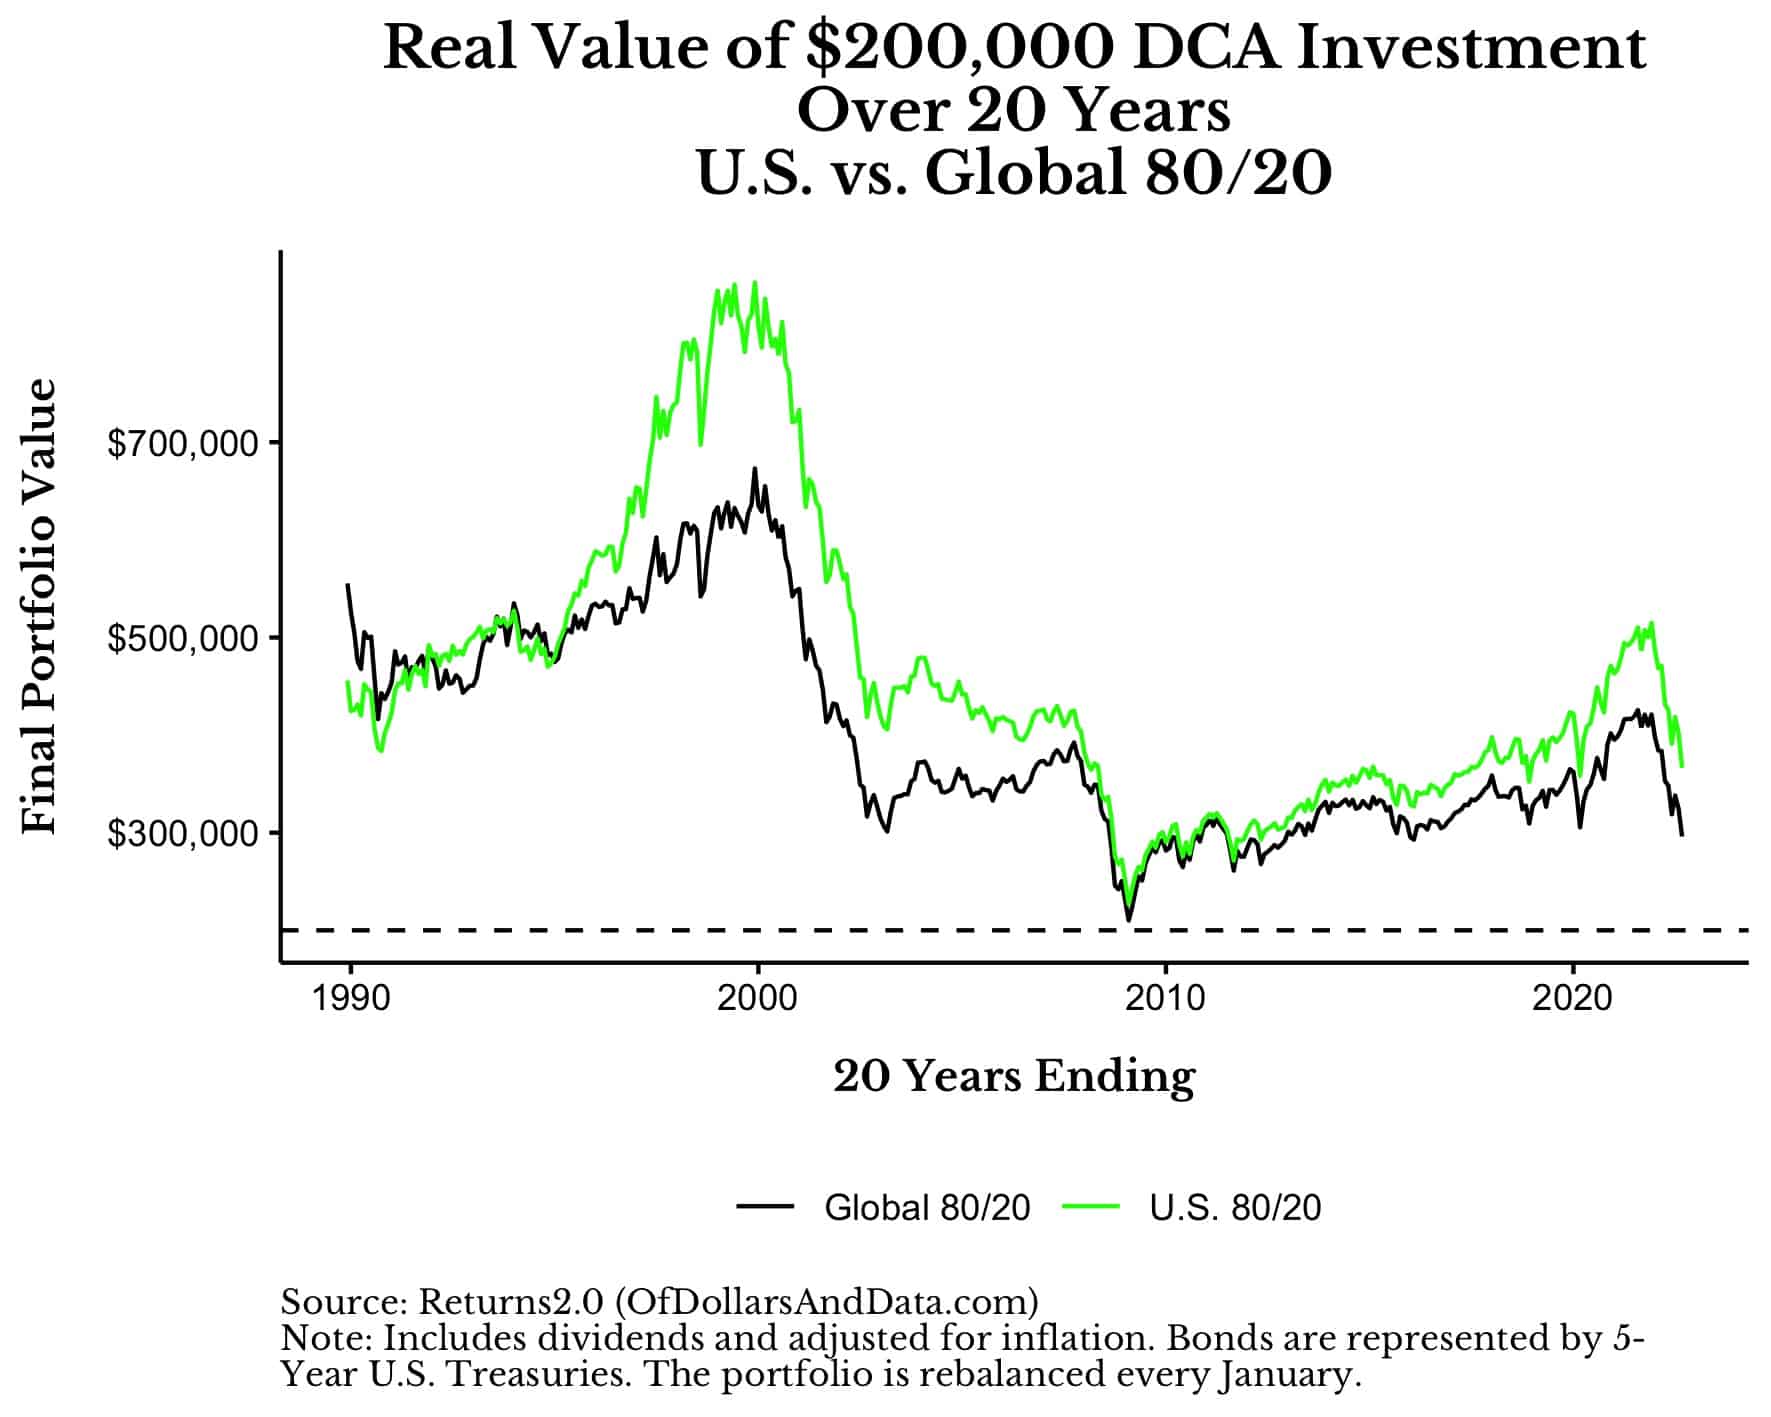
Over 20 years, the median total growth in the Global 80/20 portfolio was 1.78x and in the U.S. 80/20 portfolio was 2.12x. This means that after investing $200,000 total, you were likely to have $356,000 in the Global 80/20 portfolio and $424,000 in the U.S. 80/20 portfolio. In addition, there was no case where the final portfolio value of either the U.S. or Global 80/20 portfolio was below its basis. You can see this in the chart above because the final portfolio values shown in each line are always above the basis (dashed) line.
Once again, if we further extend our time horizon, the performance results become even more pronounced. The chart below illustrates this by showing these same simulation results for someone who invests $10,000 a year for 30 years:
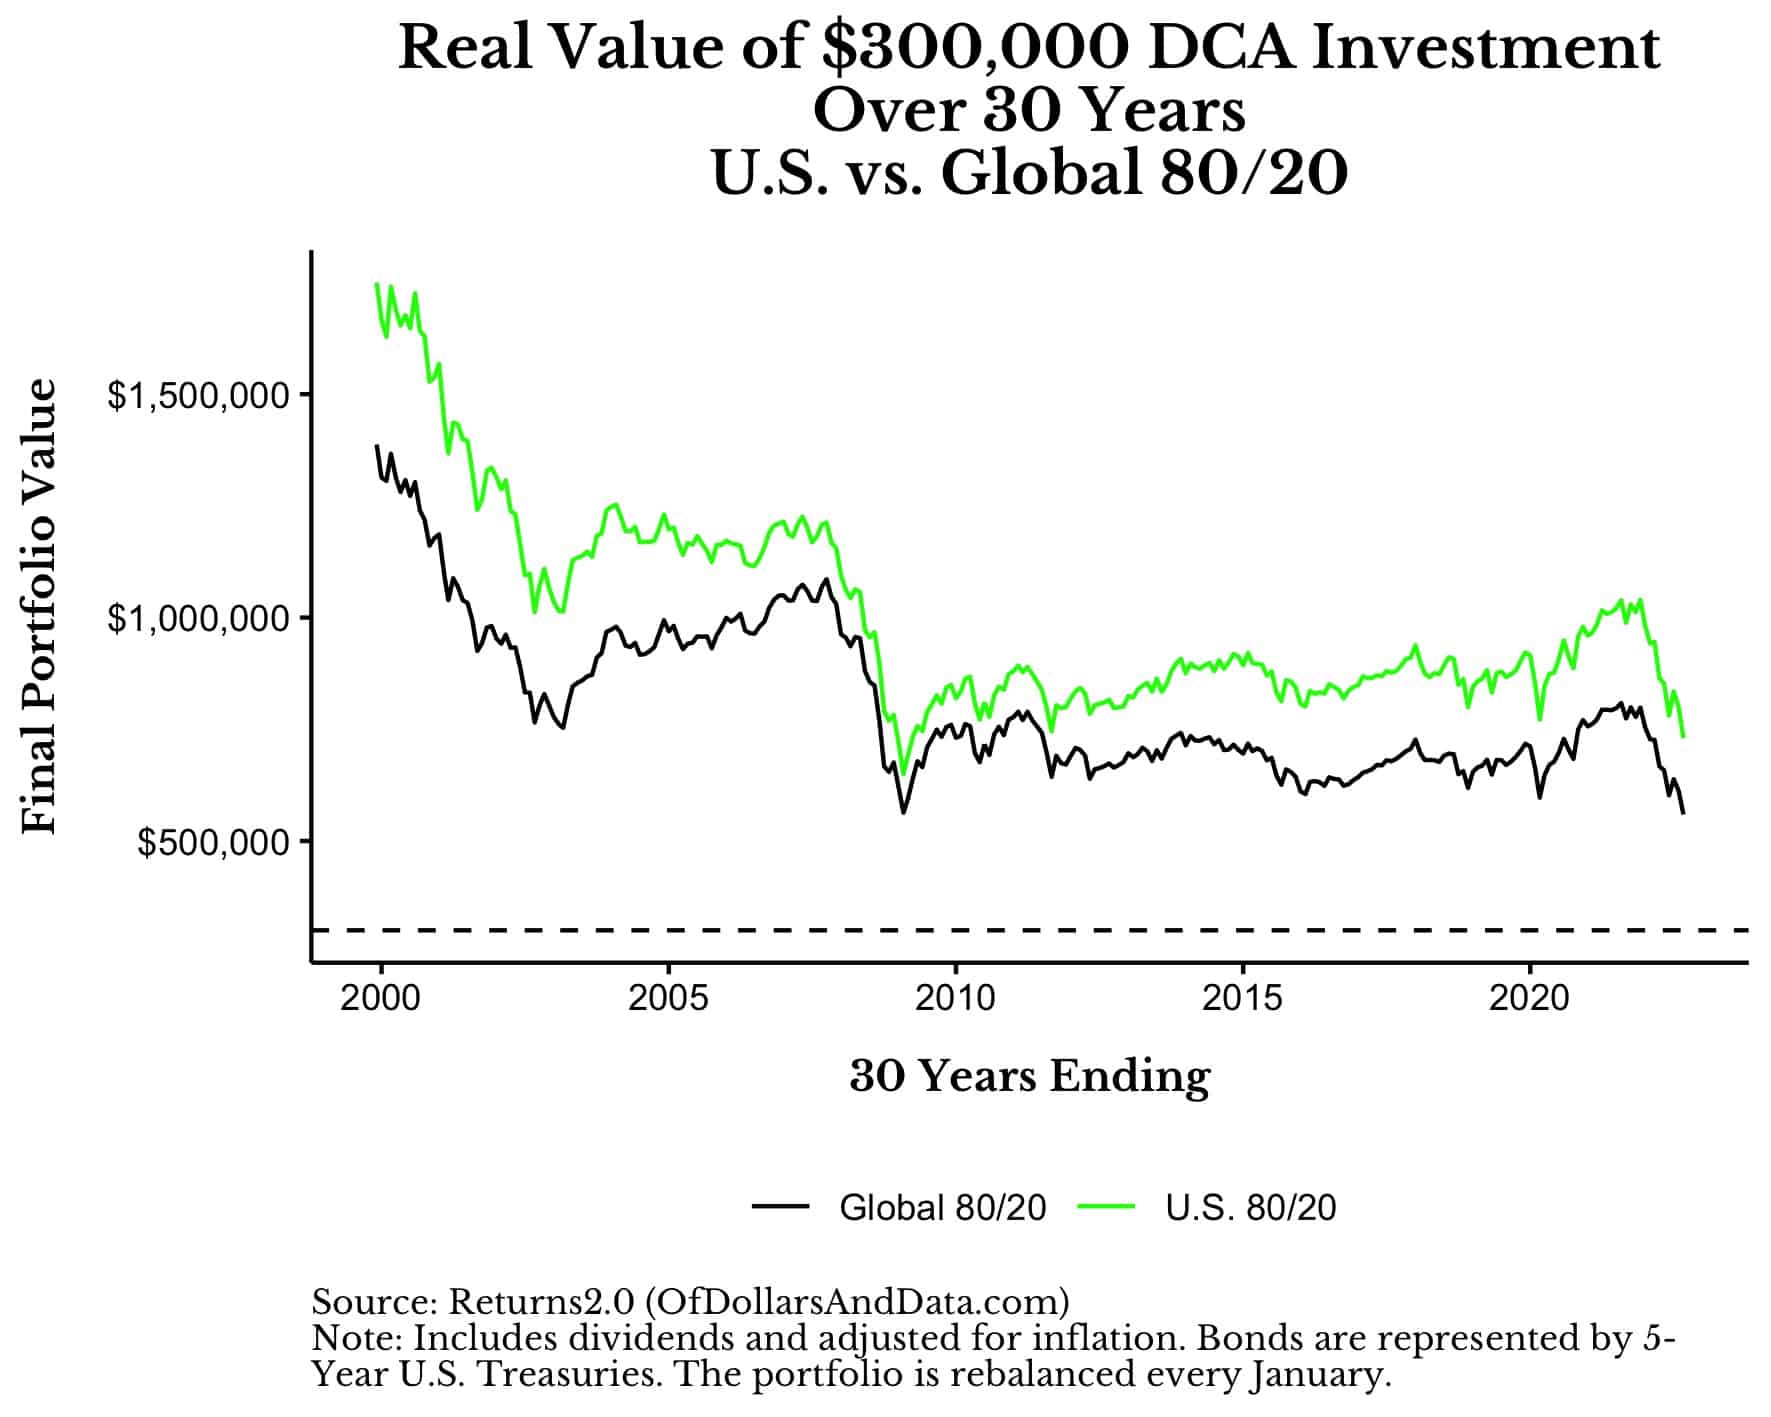
As you can see, over 30 years the final portfolio value is far above its basis whether we use a Global 80/20 or a U.S. 80/20 portfolio. More specifically, for the Global 80/20, you would make 2x your basis in the worst case and 4.5x your basis in the best case over 30 years, with a typical (median) result of 2.5x your basis. For the U.S. 80/20, you would’ve generated somewhere between 2x to 6x your money invested with a typical result of 3x your money.
The Bottom Line
All of these simulations are a long-winded way of showing you how much growth you should realistically expect in your portfolio over different time horizons. What this means is that, with consistent investing (i.e. DCA), you can reasonably assume:
- 1.5x your money after 10 years
- 2x your money after 20 years
- 2.5x your money after 30 years
- 4x your money after 40 years
You can visualize these results (for a Global 80/20 portfolio) in the boxplot below:
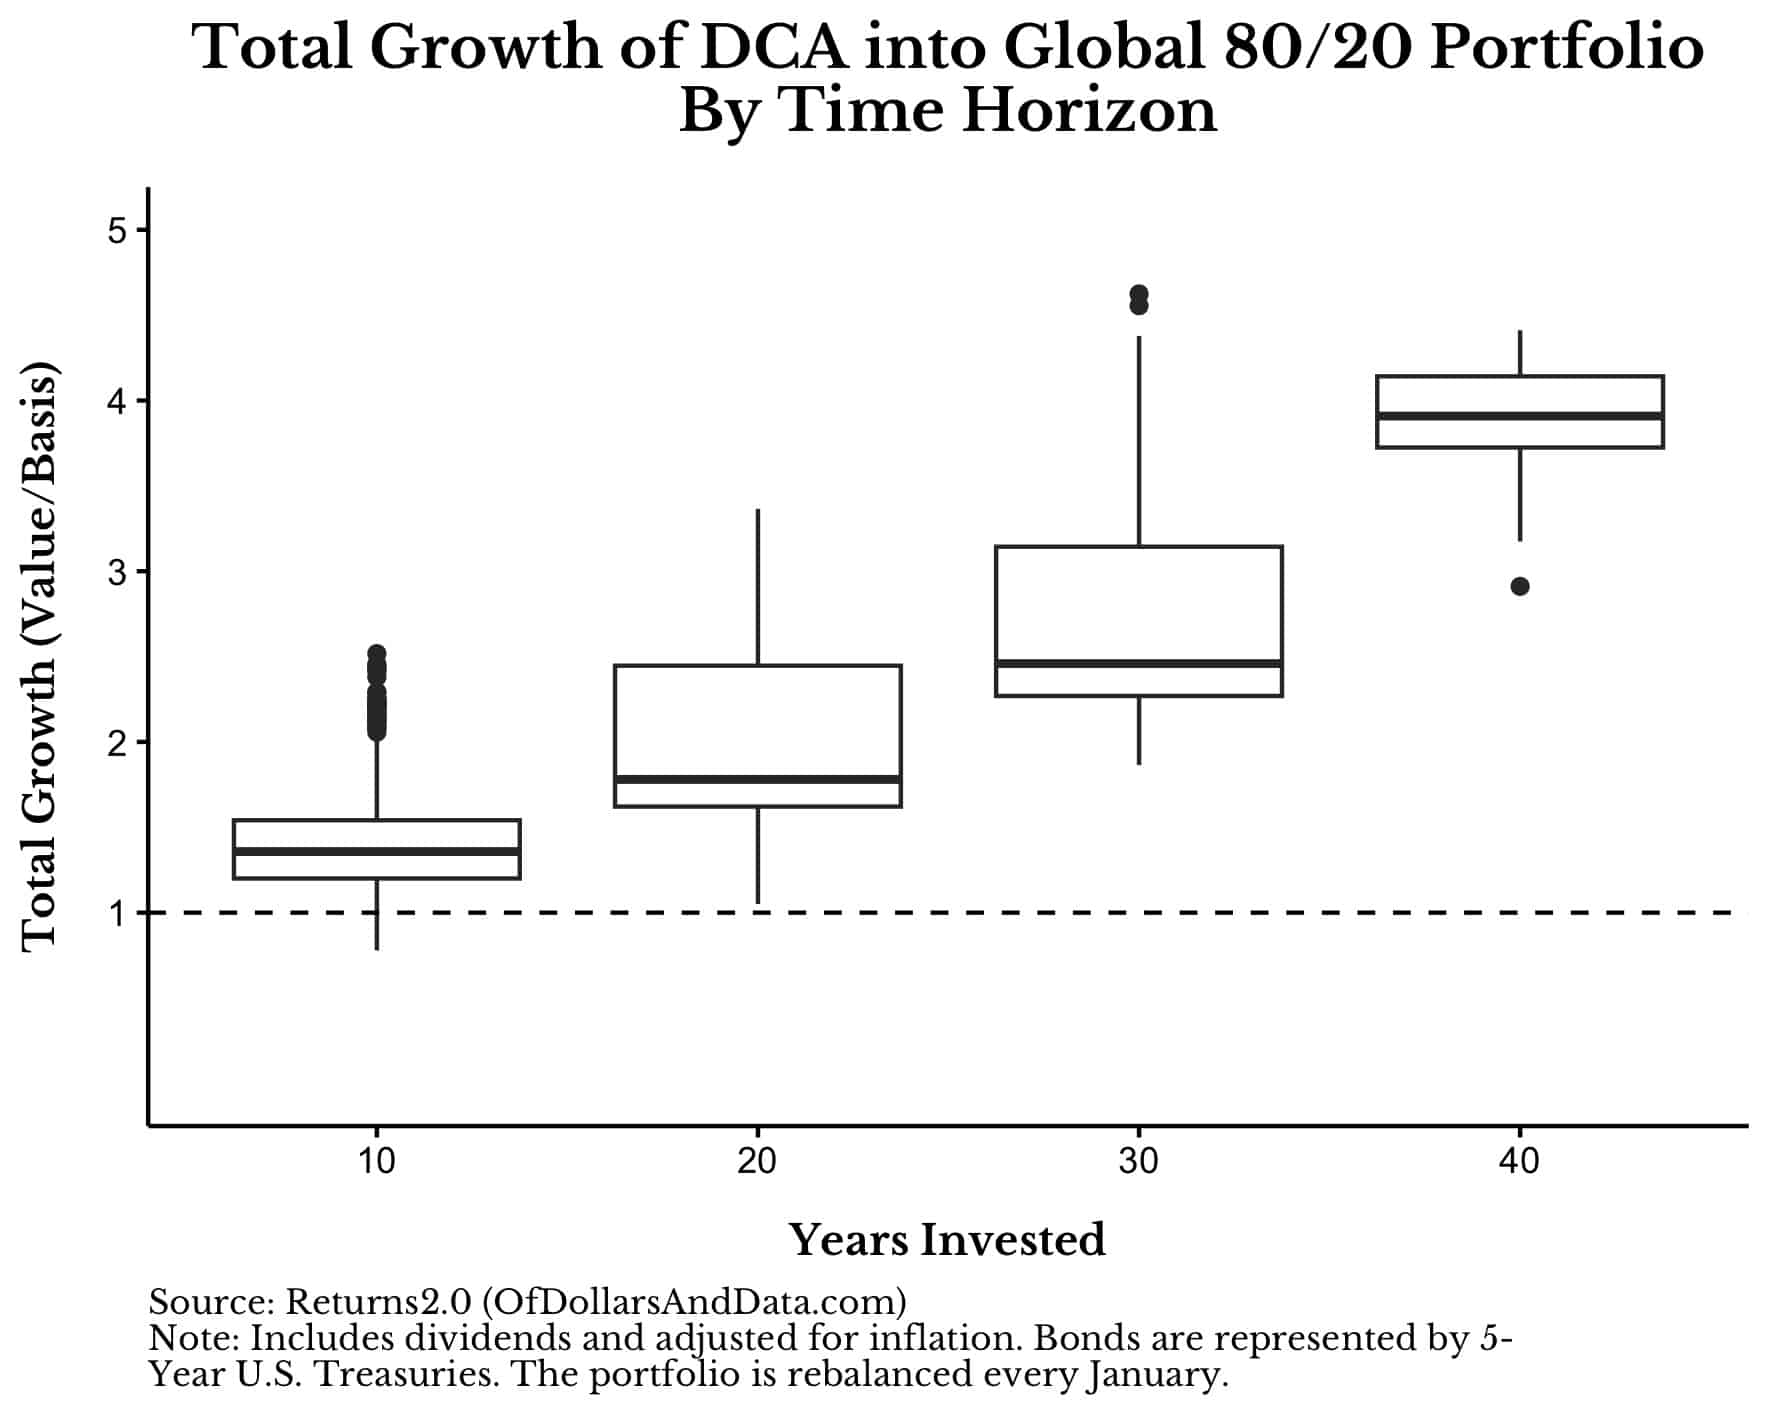 Note that the dark line within each box plot is the median result (which I rounded above for simplicity).
I wanted to share these results because there are many personal finance gurus who will advertise expected growth numbers far in excess of this and it can be quite misleading. Most of the expected growth numbers I see tend to be inflated for a few key reasons:
- They don’t examine people investing over time (i.e. DCA)
- They don’t include bonds in the portfolios (it’s 100% stocks which is unrealistic)
- They don’t include Global stocks (they focus solely on U.S. stocks)
- They don’t usually adjust for inflation.
After controlling for all of these factors, we can get a better idea of what kind of growth a typical retail investor can expect going forward. This is important because many of us are trying to plan our financial futures based on growth expectations we get from the personal finance industry. And if those growth expectations are inflated, then we may overestimate our probability of reaching our financial destination.
More importantly, we can use the information above to figure out how much money you need to save to reach a particular retirement goal.
For example, if you know that you will need a $2M portfolio to retire and you have about 20 years to get there, then we can back out how much you need to invest annually to reach that goal. With a 20 year time horizon we know that you are likely to have 2x your total investment by the end of the 20 year period. Therefore, if you want a $2M portfolio in retirement, then you probably need to invest $1M, or $50,000 a year for the next 20 years to get there.
That assumes that you have $0 invested as of today. But, what if you already have some money in a portfolio? To adjust for this, you would project the growth of this existing money, remove it from your retirement goal, then recalculate how much you need to save.
Using the $2M goal above, if you already have $100,000 invested today, we would project that $100,000 turning into $200,000 (i.e. 2x) within 20 years (conservatively). Once we have that value, we could then remove it from the final retirement goal. After doing so you will realize that you now only need an additional $1.8M to retire ($2M – $200,000 = $1.8M).
Now we can solve for how much we need to save to get to $1.8M. Once again, using the 2x estimate over 20 years highlighted above, this means that you would only need to invest $900,000, or $45,000 a year to reach your $1.8M goal.
This example is simplified, but can be very helpful when thinking about your future finances. With that being said, happy investing and thank you for reading!
If you liked this post, consider signing up for my newsletter.
This is post 323. Any code I have related to this post can be found here with the same numbering: https://github.com/nmaggiulli/of-dollars-and-data

