Is 200k a year good in the United States? What about in a place like New York City? What is a “good” income anyways?
A few weeks ago I wrote a post called, “How Much Income Do You Need to Be Rich?” where I examined the upper end of the income spectrum in the U.S. by both age and education level. Though that post was meant to look at incomes of the highest earning households, I got a lot of follow-up questions about the rest of the income distribution as well.
In particular, one reader asked me whether making $200k a year was considered a good income. So, I’d thought I’d answer this question by doing another deep-dive on household income in the U.S. before providing my thoughts on what constitutes a “good” income.
To get started, let’s provide some context on what the median household income is in the U.S.
What is the Median Income in the U.S?
If you took every household in the U.S. and lined them up based on their household income, the household right in the middle of the line would make approximately $70,000 a year. Half of the households would make more than this amount and half would make less. This was the median household income in the U.S. in 2021, according to the U.S. Census Bureau, and it’s a great starting point for our discussion.
Unfortunately, as I pointed out in my prior post, income varies based on things like age and education level. We know that older households tend to earn more than younger households and that educated households tend to earn more than less-educated households. Without considering these other factors, the median household income isn’t a great comparison tool.
For example, in 2022, the median household income in the U.S. was only $70,259. However, after controlling for age, we can see that the median household income varied from $49k (for those households 75 and older) to $92k (for those households in their late 40s to early 50s):
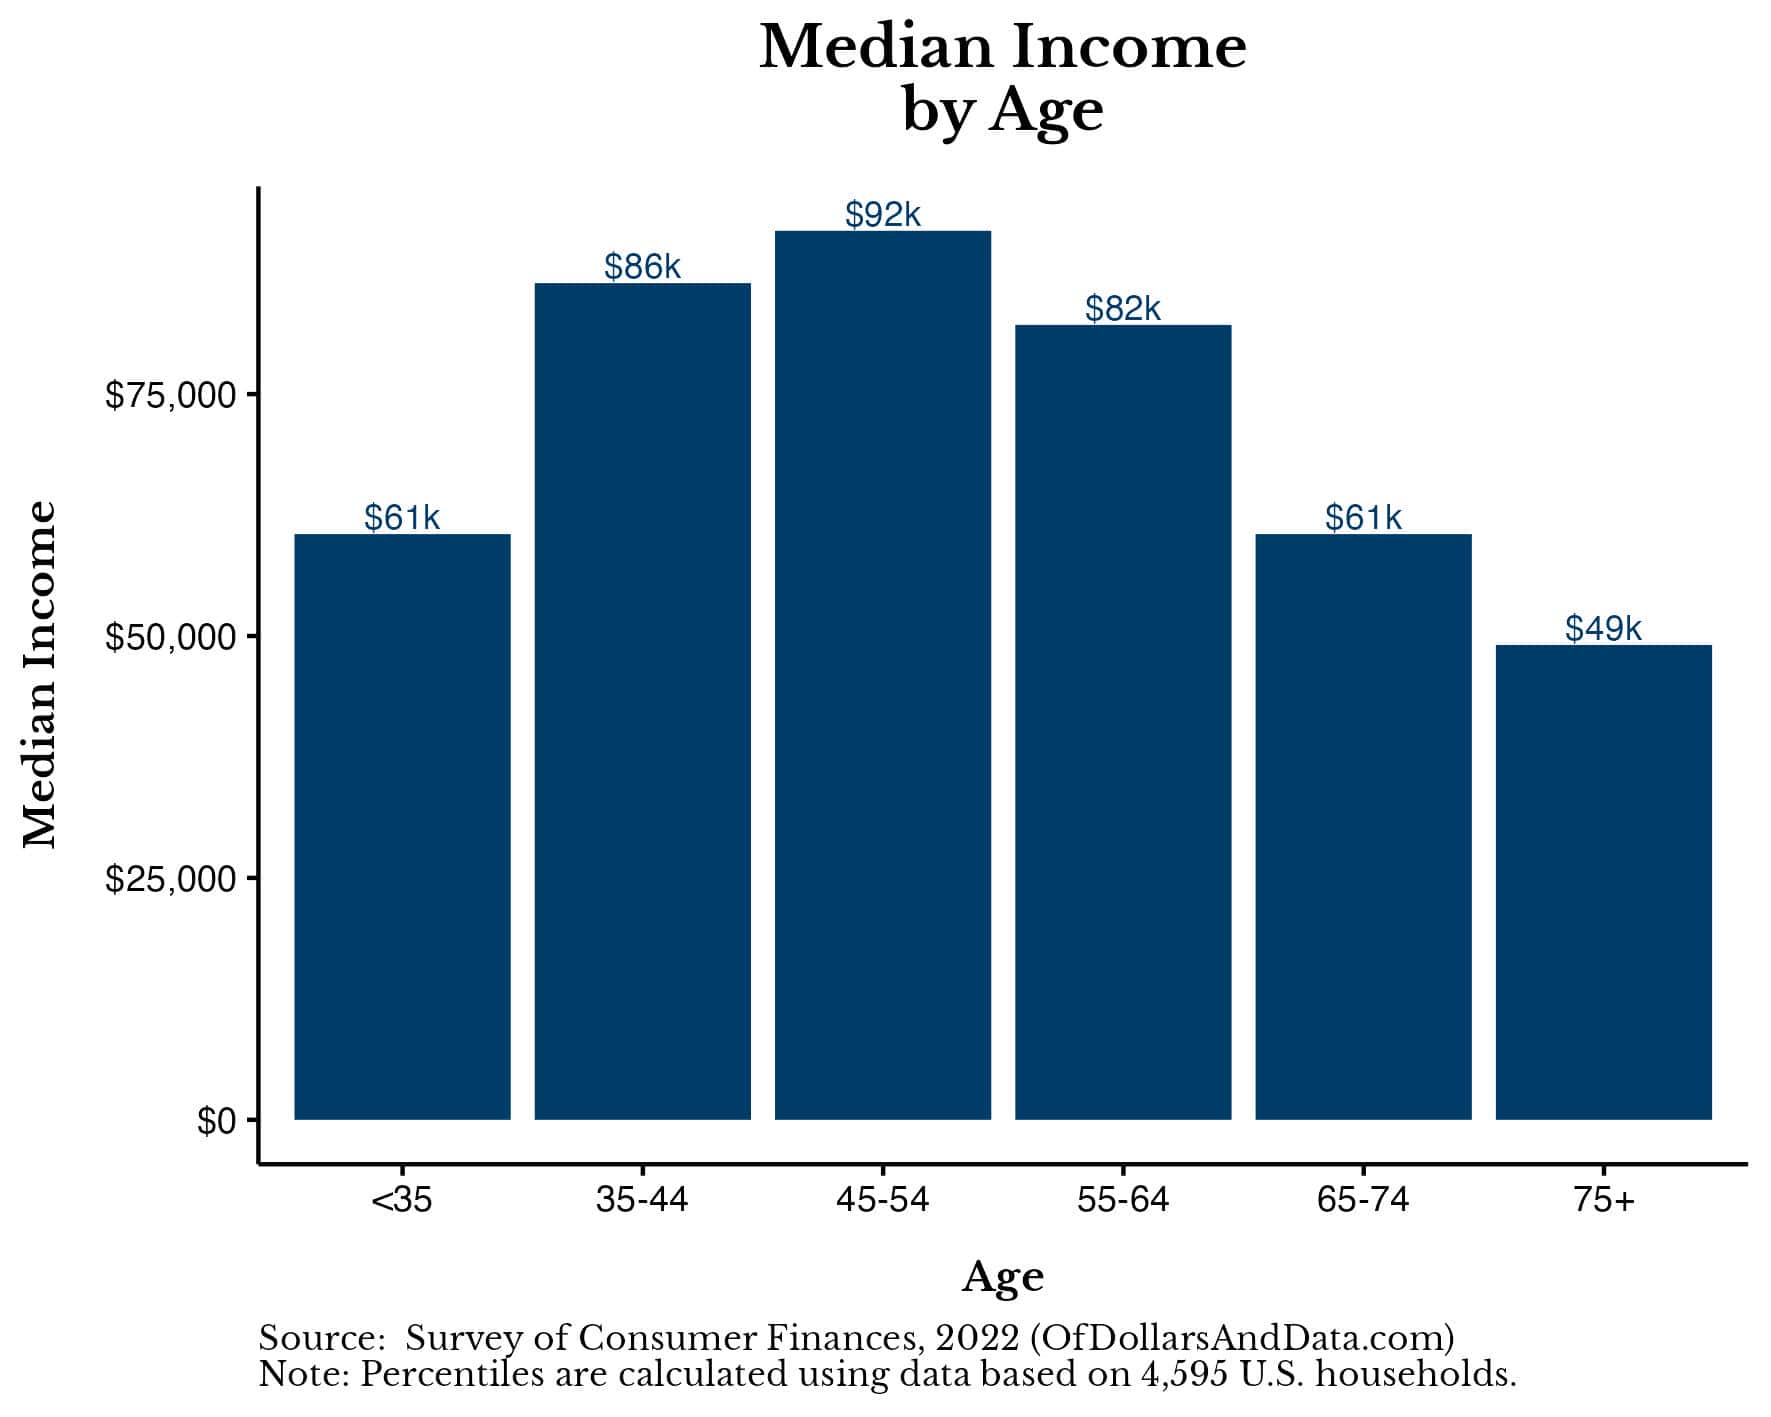
That wide range in incomes exemplifies why the median is far more useful after you control for age.
But, we can go even further than this. If we adjust for education level in addition to age, the median household income in the U.S. varies from as low as $27k (for high school dropouts) to as high as $161k (for college-educated households):
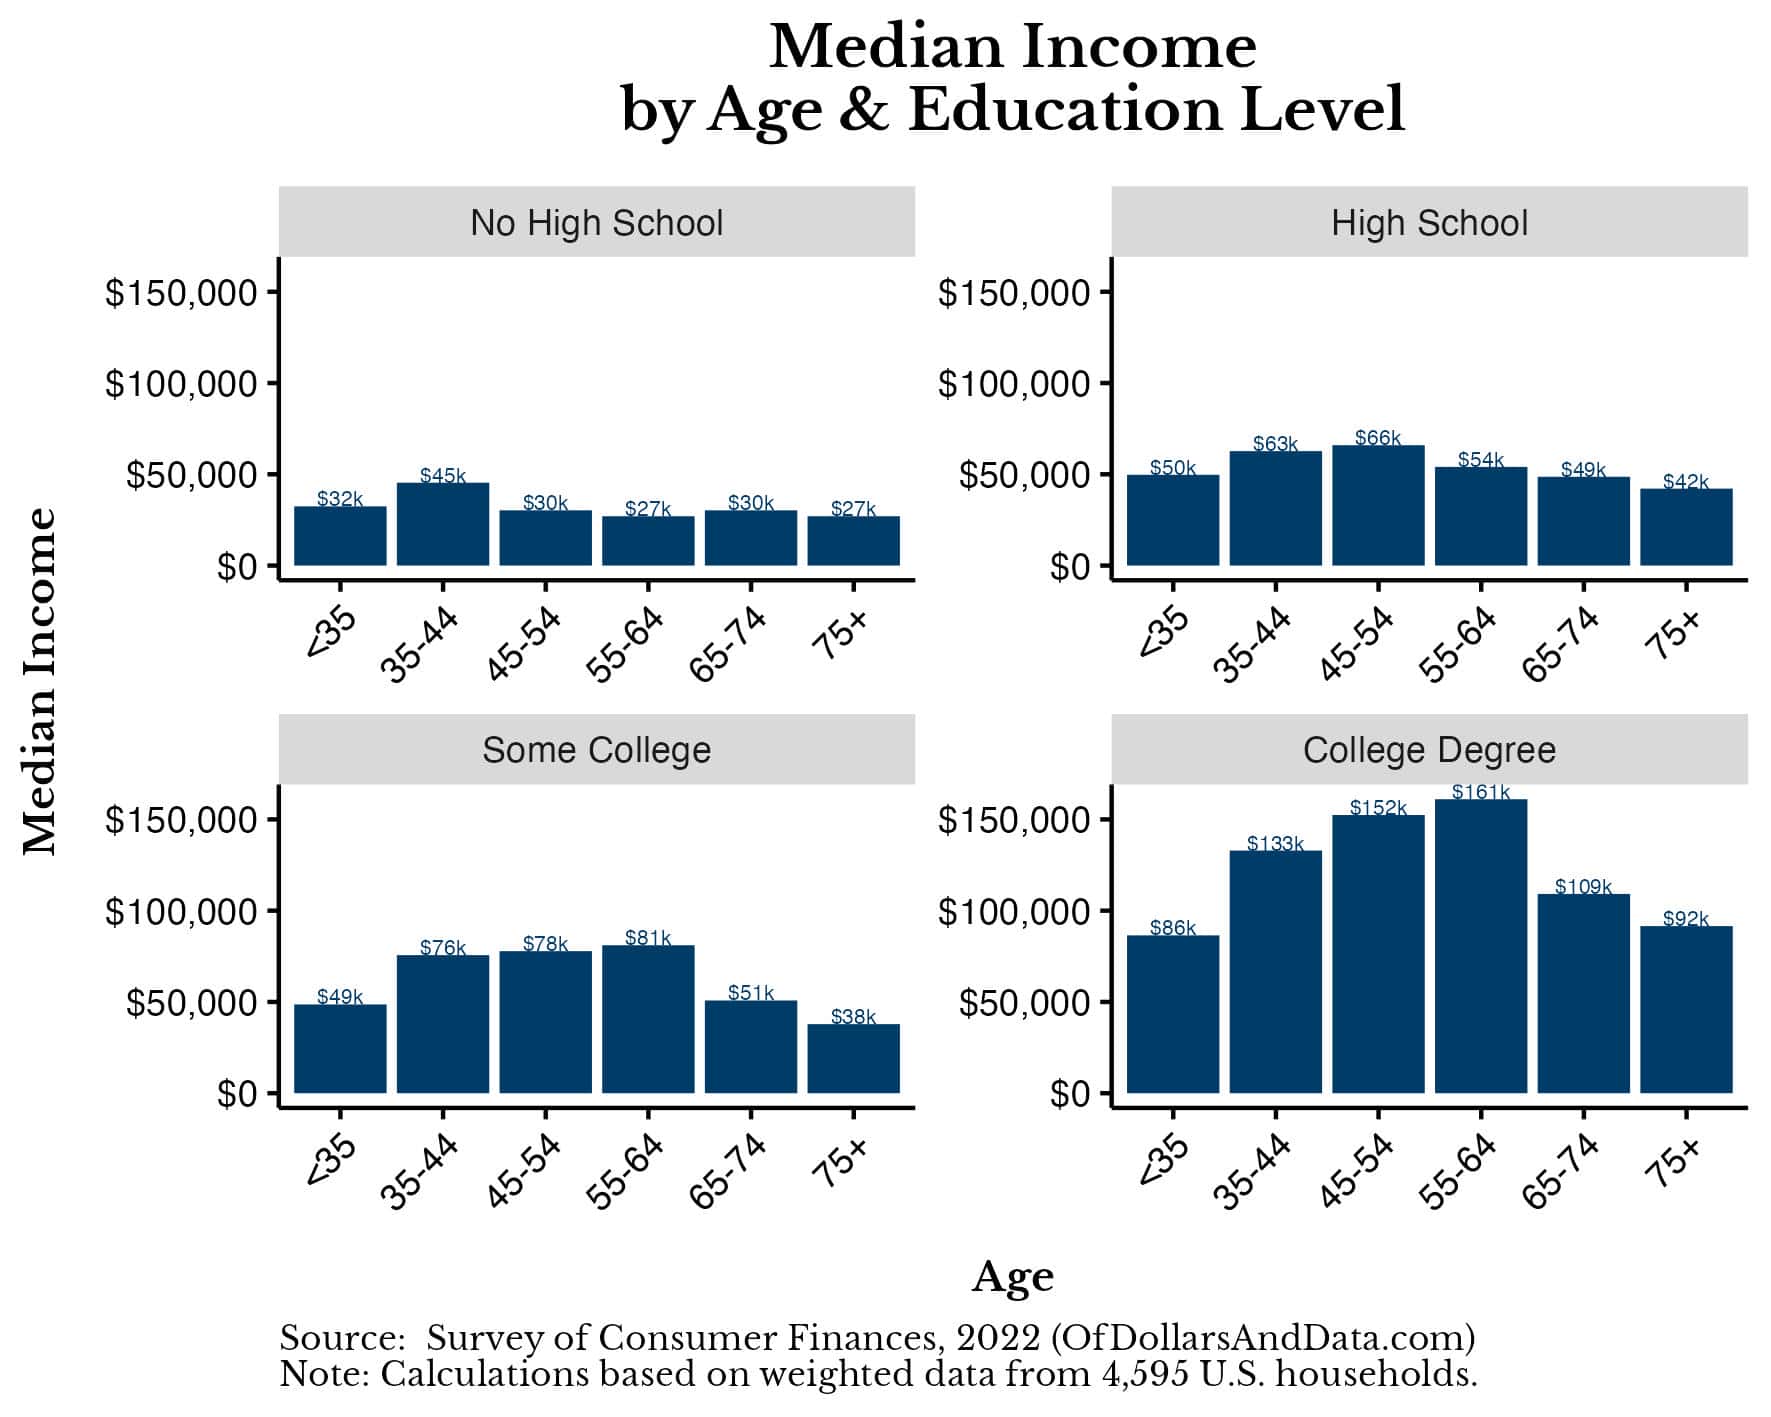
As you can see, breaking this data out by both age and education level provides a much better understanding of what the middle of the income spectrum looks like for various households in the United States.
Now that we have some context for what household income looks like in the U.S., let’s figure out where $200k would put you on the income distribution.
Where Does $200k a Year Put You on the Income Spectrum?
If you had an income of $200,000, that would put you in the top 12% of household incomes or the top 5% of individual incomes in 2022.
Though I prefer household income over individual income, no matter how you cut it, $200k a year puts you on the higher end of the income spectrum. For this reason, I don’t just consider $200k a year to be good income, but a very good income. Even if you reside in a high cost of living area like Manhattan, $200k a year would put you in the top 25% of households according to the U.S. Census Bureau. Yes, that’s the top 25% among some of the highest earning households in the world.
This suggests that, even in New York City, you can live a decent life on $200k a year. Of course, how you define “a decent life” will be relative to your liabilities. Making $200k while being single in NYC is very different than making $200k while trying to raise a family. Nevertheless, that data suggests that $200k is a good income regardless of where you live.
But this raises a bigger question: What is a “good” income anyways?
What is a “Good” Income?
Anytime we use subjective language to describe objective data, confusion ensues. Research published in the Harvard Business Review demonstrated this when they asked 1,700 individuals to assign probabilities to a list of probabilistic words like “always”, “probably”, “maybe”, and “never”. For example, if I say that, “It always rains in May,” what does “always” mean to you? Does it imply a 90% chance of rain in May? A 95% chance? 100%?
If you repeat this exercise across a lot of probabilistic words and plot the distribution of responses, you would get a chart like the one below:
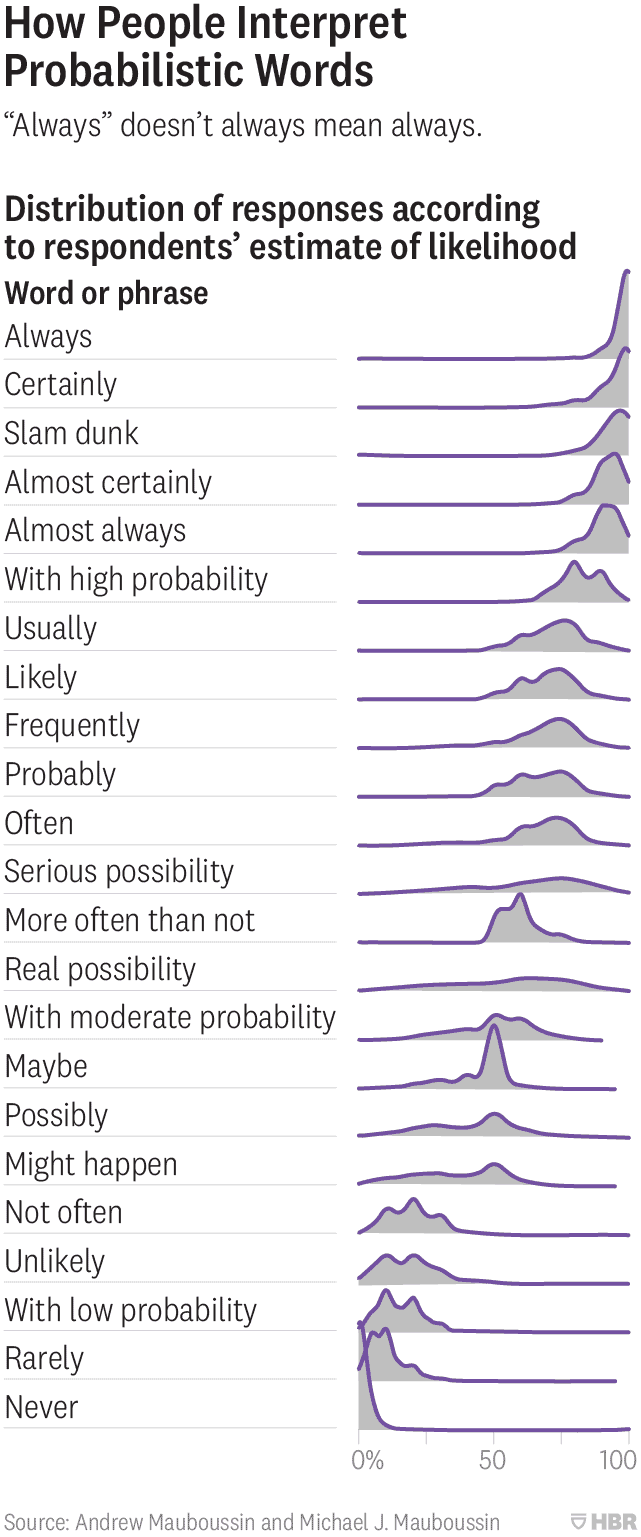
The important thing to note in this plot is that some probabilistic words have a wider range of interpretations than others.
I mention this research because the same thing will be true when we try to define what a “good” income is. Every person will interpret the word “good” slightly differently, meaning that every person will have their own definition of a good income. And if your definition doesn’t agree with my definition, then we won’t see eye-to-eye.
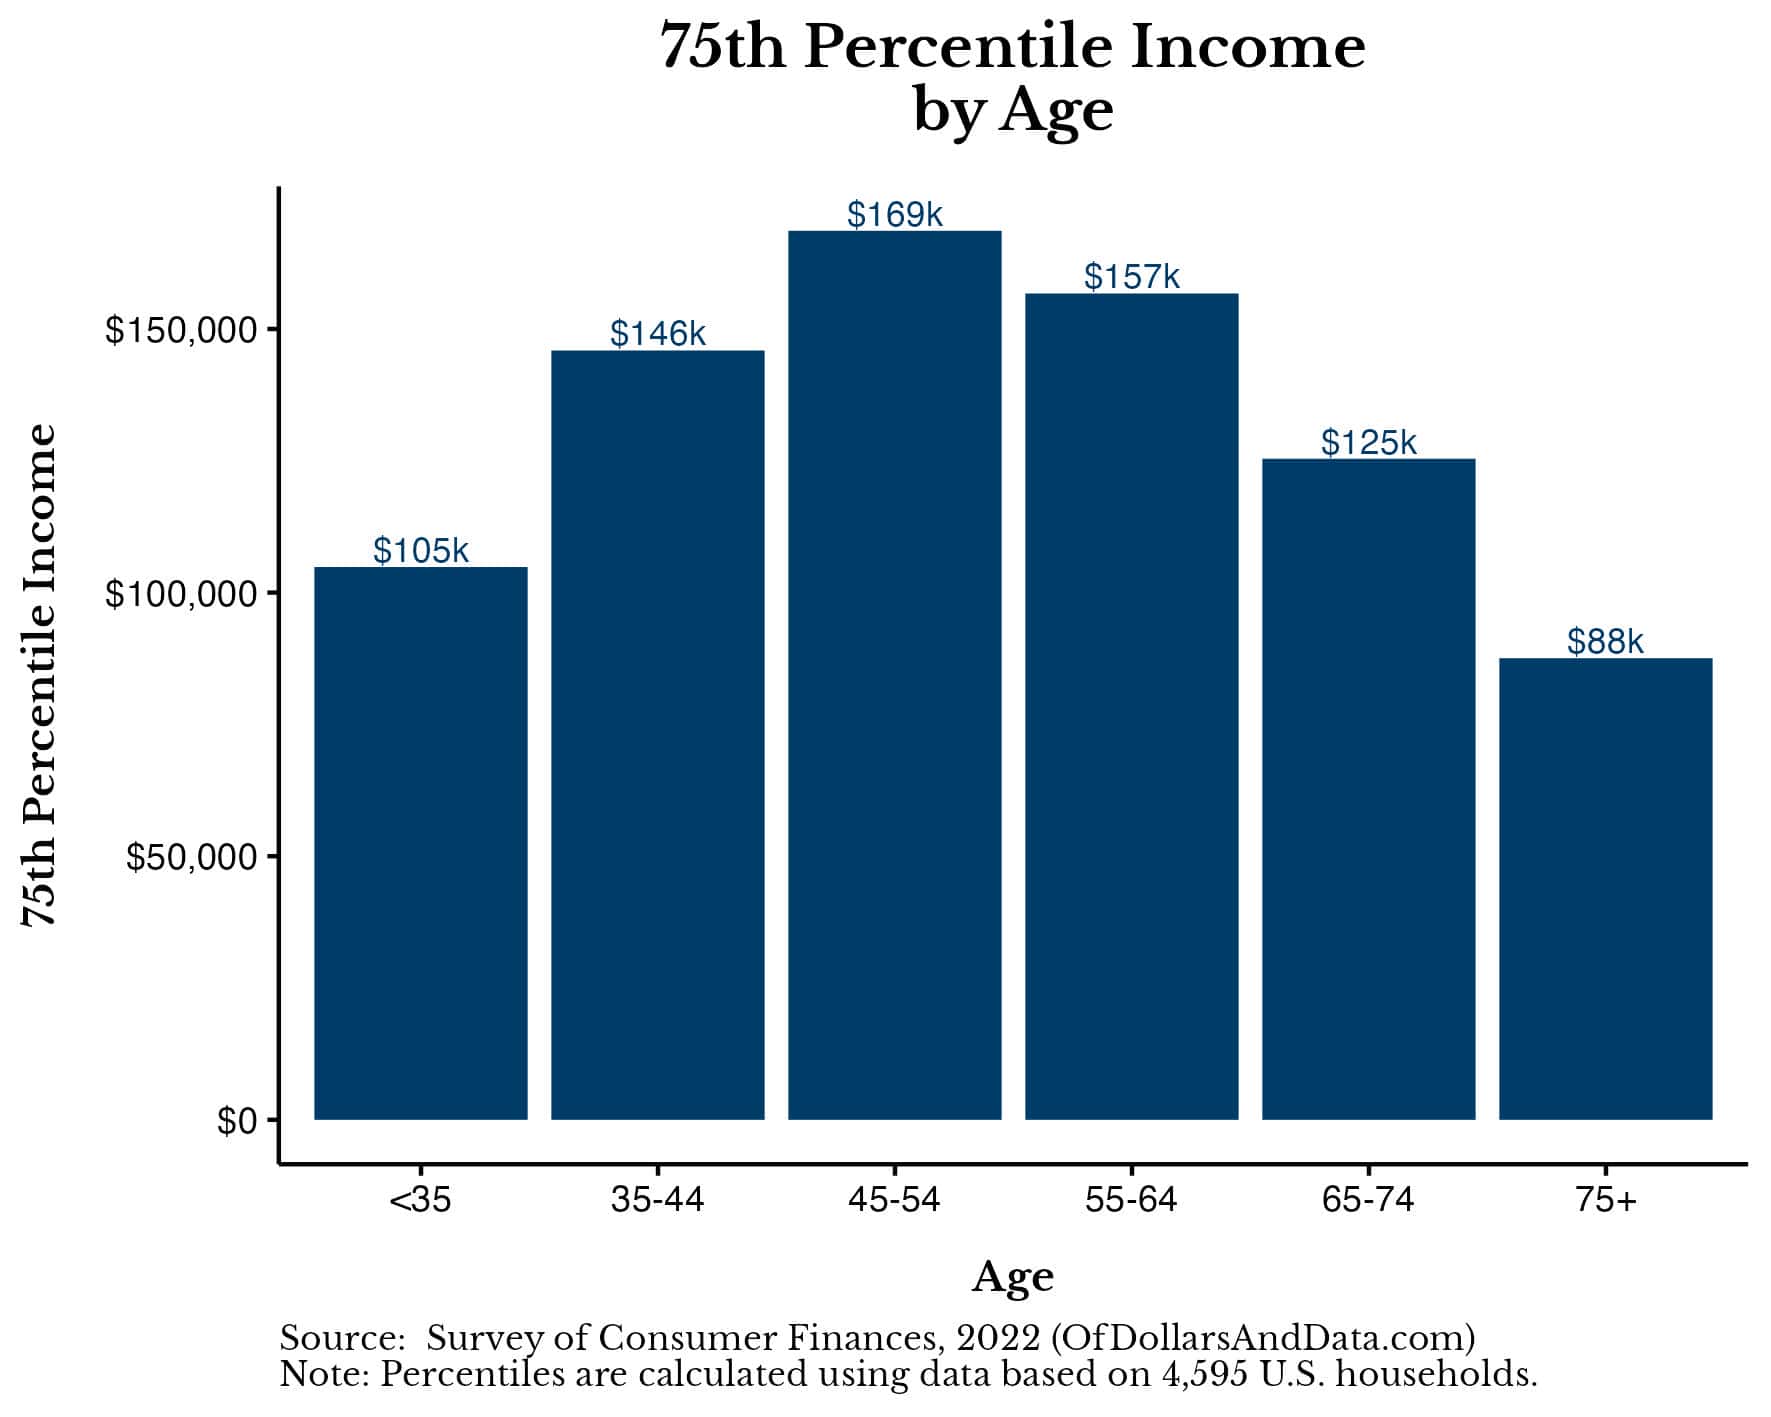
Nevertheless, I will tell you my definition of a good income—it’s the top 25%, or the 75th percentile. It’s not a great income (like the top 10% or higher), but it’s also better than the median income. It is a good income.
If you accept my definition, then a good household income would be $130,000 per year (in 2022) and a good individual income would be $82,000 per year (in 2022). Of course, these point estimates don’t paint the full picture. Once we adjust for age, we would see that the 75th percentile of household income can vary from $88k to $169k:
Once again, we can take this a step further by adjusting for education level as well:
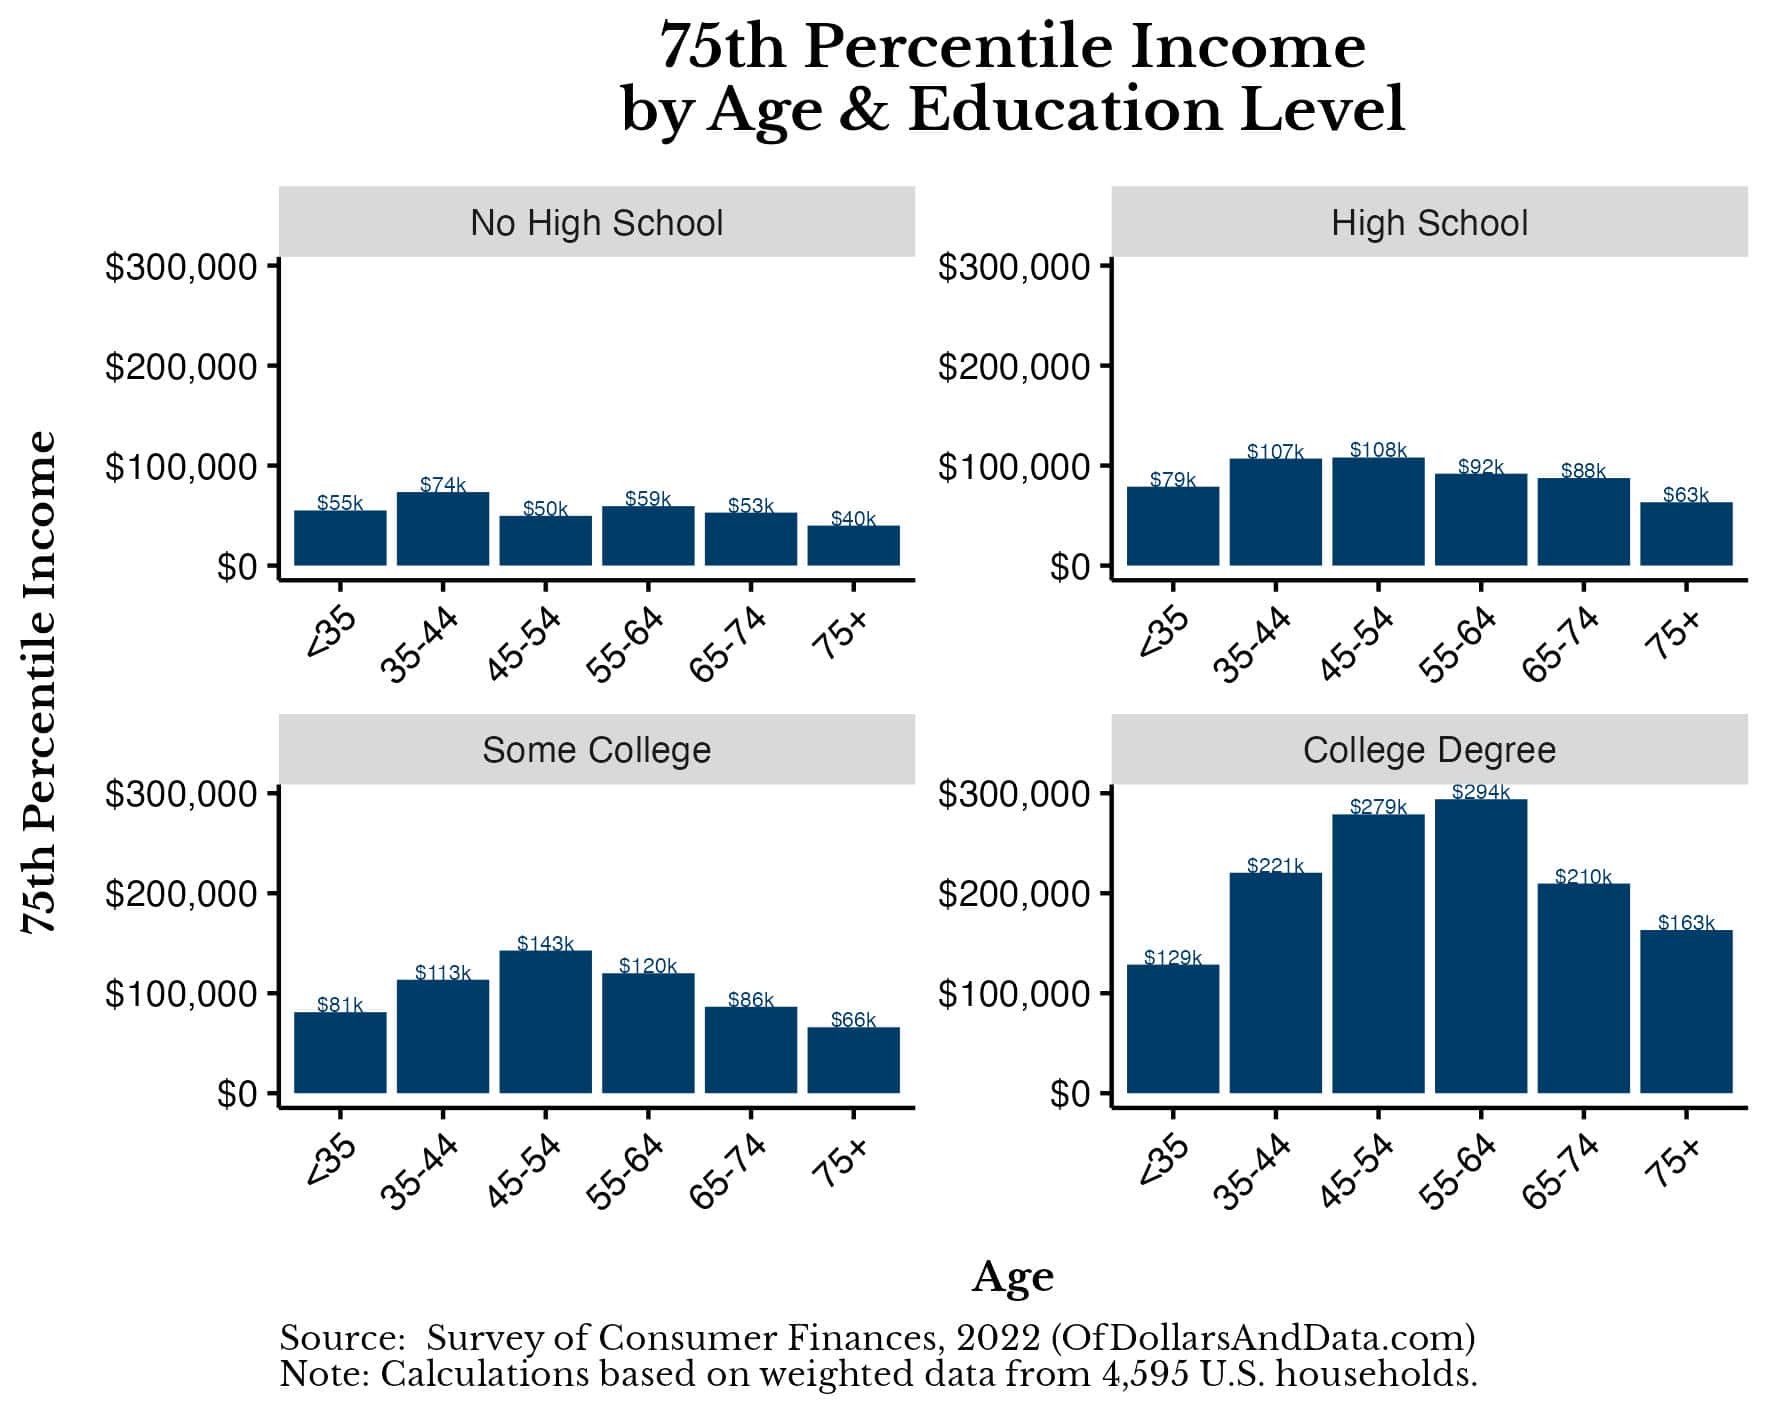
After adjusting for these two factors, we have far more insight into what constitutes a good income in the U.S.
Now that I have provided my definition of a good income, let’s wrap things up by discussing why the only definition of a good income that matters is your own.
The Only Good Income is the One We Define
You may have read this piece because you wanted to know whether earning $200k a year was a good income. You may have read it hoping to learn more about what makes a good income at all. Unfortunately, I can’t provide you with the right answer…but you can.
Because the only good income is the one that you believe is good. It’s not what I think or what the data shows. It’s what you feel on the inside that counts. This isn’t some cliche fortune cookie wisdom either. This is a fundamental to how we judge ourselves and our financial lives. Because we can either let the external world define our values or we can define them for ourselves.
Warren Buffett called this following his Inner Scorecard. According to him, everyone has both an Inner Scorecard and an Outer Scorecard. The Outer Scorecard is what the world sees of us. It’s our material possessions, our public accomplishments, and our career successes. However, there is also an Inner Scorecard, which is how we judge ourselves relative to our own standards and values. Buffett argues that the Inner Scorecard is the only one that matters.
And I couldn’t agree more. Because the Inner Scorecard is what determines how we actually feel. If you are making $500k a year, but feel like you need to make $1M, you probably won’t be as happy as someone making $50k a year who feels like they only need to make $30k.
Our income doesn’t define us, but our interpretation of our income does.
Therefore, you can either change your income or change your interpretation. I will leave it up to you. Thank you for reading!
If you liked this post, consider signing up for my newsletter.
This is post 335. Any code I have related to this post can be found here (see analysis 331): https://github.com/nmaggiulli/of-dollars-and-data

