


There is a force that is moving the stock market. No, it’s not the Fed. It’s not the hedge funds. It’s an army of day traders numbering in the hundreds of thousands. At least, that is what some of the headlines would have you believe.
They are calling it the Robinhood effect and for good reason. In early May, Robinhood reported 3 million new account openings in the first four months of the year, half of which were for first-time investors. And it’s these new investors that are supposedly having an outsize impact on the stock market.
But is that true? Before we can answer that, we need to go back to where this all started.
Where did the Robinhood effect come from?
Though March 11, 2020 may not be a particularly memorable day for the stock market, it set in motion a set of events that would ultimately create the flood of Robinhood investors. What happened on March 11? The cancellation of the 2019–2020 NBA season.
It might seem weird to equate the end of sports with the resurgence of the retail investor, but this linkage is widely accepted at this point. The first connection between the absence of sports and the rise in retail investing came on April 29 when Jessica Rabe at DataTrek put forth the theory that the lack of sports betting was pushing would-be gamblers to the stock market.
Shortly thereafter, Bloomberg columnist Matt Levine discussed the same theory, which he eventually referred to as the “boredom market hypothesis.” Long story short, the money that usually would have found its way into sports books across the country had to find a new home, and that new home was the stock market.
I first noticed this shift in late March when Dave Portnoy, of Barstool Sports fame, was vlogging about his trading activity. What I thought was a one-off video quickly became a rebranding for Portnoy that landed him on CNBC less than two months later. By mid-June, Fox Business was reporting that Portnoy was leading “an army of day traders.”
But it wasn’t just the surge in gamblers-turned-traders that popularized the Robinhood effect. Once news agencies began reporting on how these novice investors were beating the billionaires at their own game, Wall Street started to take notice. For example, an analysis from Goldman Sachs claimed that Robinhood traders’ stock picks outperformed those of hedge funds and Societe Generale concluded that Robinhood traders “nailed the market bottom.”
From this perception that the amateurs were beating the pros, came the illusion that Robinhood traders were impacting the stock market in a major way. But, was it true? Was the Robinhood effect real after all?
Is the Robinhood effect real?
The first signs of evidence against the Robinhood effect appeared in early June when an analysis from Barclays found that Robinhood traders weren’t behind the market rally. Their analysis compared what stocks Robinhood users were buying with movement in the S&P 500, but they found no relationship. Though Citadel Securities recently reported that retail trading now makes up 25% of all market volume (up from 10% in 2019), it is likely that these trades are too small to make an impact.
But instead of taking their word for it, I decided to test this hypothesis by scraping all of the data from Robintrack a few days ago, a website showing the number of Robinhood users that hold a particular stock over time. For example, below is a chart of Ford’s (F) stock price along with the number of Robinhood users holding its stock since May 2018:
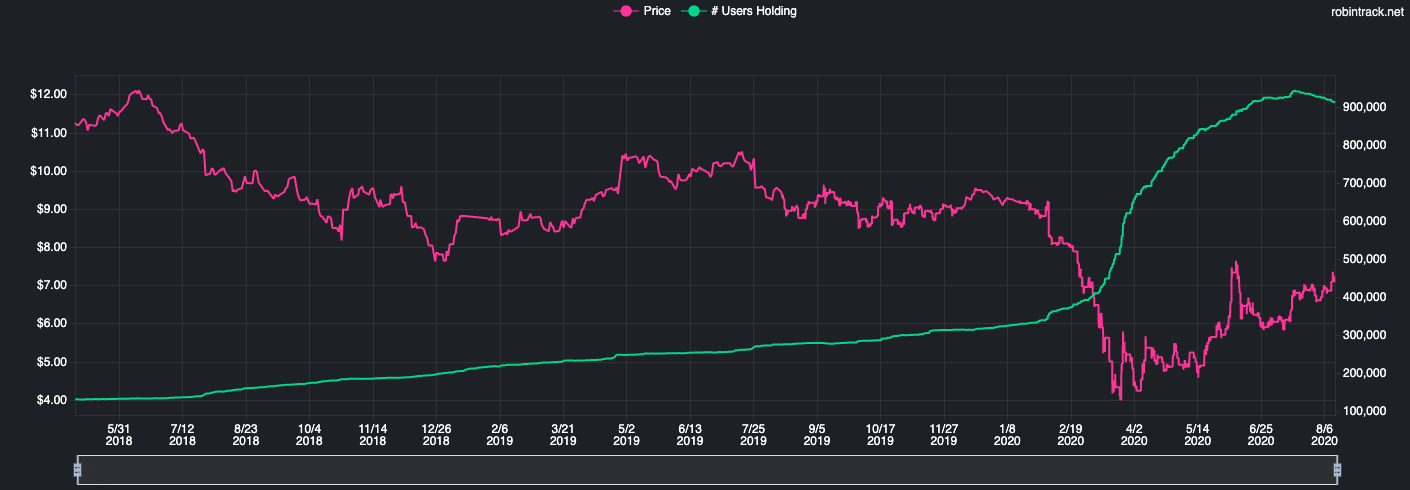
Number of Robinhood users holding Ford stock (green) compared to the price of the stock (pink)
The nice thing about Robintrack is that you can download the number of Robinhood users holding any given stock over time. (Unfortunately, this won’t be true for much longer. Bloomberg recently reported that Robinhood is shutting down this data feed to prevent other people from “using it in ways that they can’t monitor/control.” Thankfully, the historical data will be allowed to remain on the site.)
With this in mind, I took the top 200 stocks on Robintrack and downloaded their holdings data. The number of holders in the top 200 ranged from 900,000 for the most popular stock (Ford) to 40,000 for the 200th most popular (Azul Airlines).
When combining the holdings data with pricing data from Yahoo Finance, I was able to look at the one-day change in number of Robinhood users holding a stock and see how well it correlated with the one-day price return of that stock.
I did this because I wanted to test whether an increase (or decrease) in Robinhood users holding a stock was met with a similar increase (or decrease) in that stock’s price. I understand that the number of Robinhood users holding a stock is not the same as the total dollar impact that Robinhood users have on a stock (that is, not all Robinhood traders have the same bankroll), but let’s assume that they are similar in size for now. Additionally, I created a subset of the data to start on February 19 (the day before the Covid-19-inspired sell-off began) to only capture the correlation from when Robinhood users started becoming more active on the platform.
After doing this exercise for the top 200 most popular stocks on Robintrack, I found that for most of these stocks, there was little to no correlation between the one-day change in stock price and the one-day change in the number of Robinhood users holding them:
![]()
Each point in the plot above represents one stock’s correlation between the change in Robinhood holders and the change in price. For example, the far leftmost point in the plot above is for the most popular stock (Ford), which has a correlation near zero. As you can see, most of the correlations are between 0.3 and -0.3, which suggest a weak relationship, if any. It is those correlations near 1 (or -1) that imply stronger relationships.
Additionally, I ordered this plot by popularity rank on Robinhood to show that there is also no relationship between popularity on Robinhood and the correlation metric I calculated. This implies that, on Robinhood, more popular stocks don’t have higher correlations than less popular stocks.
If we had found that the most popular stocks on Robinhood had a high correlation between the change in Robinhood holders and the change in price, then we might be able to argue that Robinhood traders had an impact on markets as a whole. But, that doesn’t seem to be the case here.
However, if you look at the plot above you will notice that some stocks do exhibit a high correlation between the change in the number of Robinhood users holding it and its one-day price change.
To look at this in more depth, I ranked these top 200 stocks from the one with the lowest correlation to the one with the highest and discovered that Robinhood activity is significant for some stocks:
![]()
The stocks on the far right side of the chart seem to be affected by Robinhood users while those in the middle and to the left seem to be unaffected.
It may come as no surprise that smaller speculative stocks like Kodak, Nikola, Hertz, and Moderna show a high correlation between Robinhood users holding the stocks and price changes. Meanwhile much larger stocks like Apple, Amazon, and Tesla show basically no correlation. Since these are higher market cap stocks, it’s possible that even lots of volume from Robinhood traders can’t move the market, compared to, say, a stock like Hertz, which is trending toward being worth $0.
However, because the smaller, more speculative stocks grab more headlines, this perpetuates the Robinhood effect myth even further. You can see this clearly when you compare the number of Robinhood users holding a stock like Kodak and Kodak’s price:
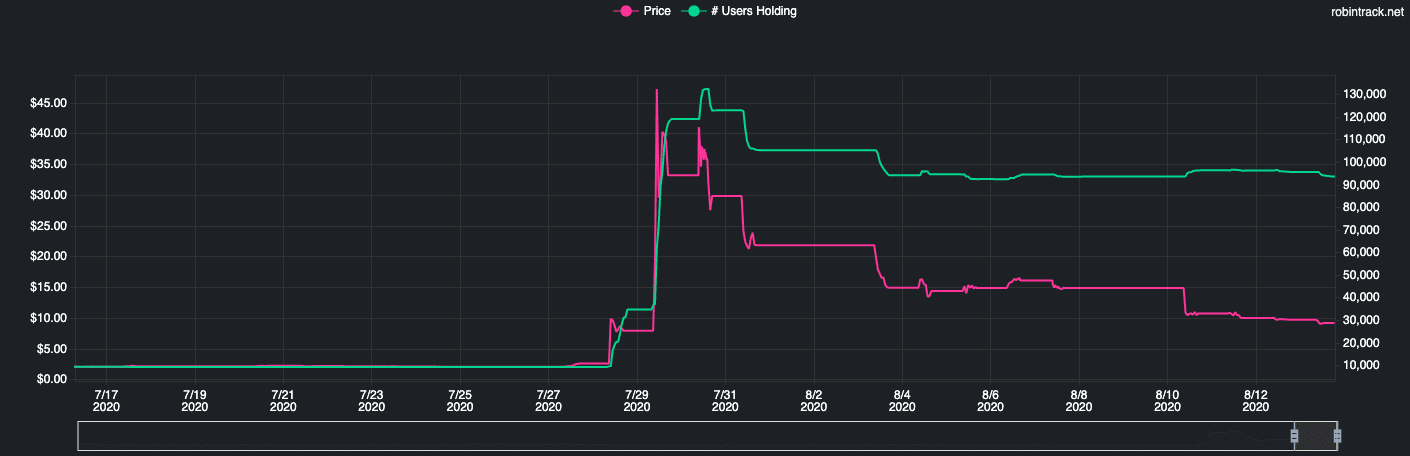
Number of Robinhood users holding Kodak stock (green) compared to the price of the stock (pink)
Yes, Robinhood traders are impacting Kodak, but that doesn’t imply they are materially impacting larger stocks (like Apple or Amazon) or the stock market overall.
This illustrates that there seems to be some stocks in which the Robinhood effect is real, but, for most stocks this isn’t true. Popularity on Robinhood is not predictive of price changes, but it is predictive of what will make the headlines.
While I would like to follow up on this analysis in the future to test if the Robinhood effect ever gets stronger, based on Robinhood’s recent actions with Robintrack, we know this won’t be possible.
This change in data transparency suggests that Robinhood wants to shed its day trader image in order to attract a different kind of clientele. Following the recent suicide of young Robinhood trader, I am not surprised that the company is trying to distance itself from a movement they helped create. For a company whose mission has always been to democratize finance, maybe they succeeded a little too well.
A version of this article was originally published on Marker.
If you liked this post, consider signing up for my newsletter.
This is post 201. Any code I have related to this post can be found in “0006_robintrack_scraper.R” here: https://github.com/nmaggiulli/of-dollars-and-data/blob/master/analysis/_fl