Earlier this year I wrote a piece illustrating how it is almost always optimal to invest a large sum of money right away rather than “averaging-in” over time. Sitting in cash (or even in T-Bills) simply doesn’t pay compared to the markets because most markets have a long term positive trend.
Despite the mathematical soundness of my arguments, many people told me privately that they still felt wary about investing lots of money at once because they feared a market crash. My recommended solution to address this fear was simple—go all-in, but do it in a more conservative portfolio.
So, if you truly wanted to be invested in 100% stocks (but you were worried about a market crash) it would be better to put it in now into a 80/20 stock/bond portfolio instead of dollar-cost averaging into an all-stock portfolio over time.
But this recommendation got me thinking. How conservatively can you invest a Lump Sum and still outperform dollar-cost averaging (“DCA”)? Could a Lump Sum investment into a 60/40 portfolio beat DCA into an all-stock portfolio over 24 months? What about a Lump Sum into a 40/60 or, god forbid, an all-bond portfolio? Where is the limit?
In my prior post on Lump Sum investing I kept the portfolios constant, but varied the buying period (i.e. how long it took you to average-in) to demonstrate that a longer buying period leads to more underperformance (compared to doing a Lump Sum).
In this post I am going to keep the the buying period constant (at 24 months), but will vary the conservativeness of the portfolios (from 100% stocks to 100% bonds). This will allow me to see how a Lump Sum investment in a more conservative portfolio compares to DCA into an all-stock portfolio.
My results show that any stock/bond portfolio combination (even a 100% bond portfolio!) would have, on average, outperformed a 24-month DCA into an all-stock portfolio. If that statement doesn’t shock you, let me make it more concrete.
Let’s say you had $2.4M you wanted to invest in the S&P 500, but you were too shy about going all-in now. So, you decide to invest $100,000 a month for the next 24 months. My analysis shows that you would have been better off had you invested all $2.4M into any stock/bond portfolio combination (80/20 stock/bond, 20/80 stock/bond, etc.) at the beginning instead of averaging-in over time.
For example, the plot below shows the relative performance of DCA (into 100% stocks) compared with a Lump Sum (“LS”) investment (in a 60/40 portfolio) over 24 months:
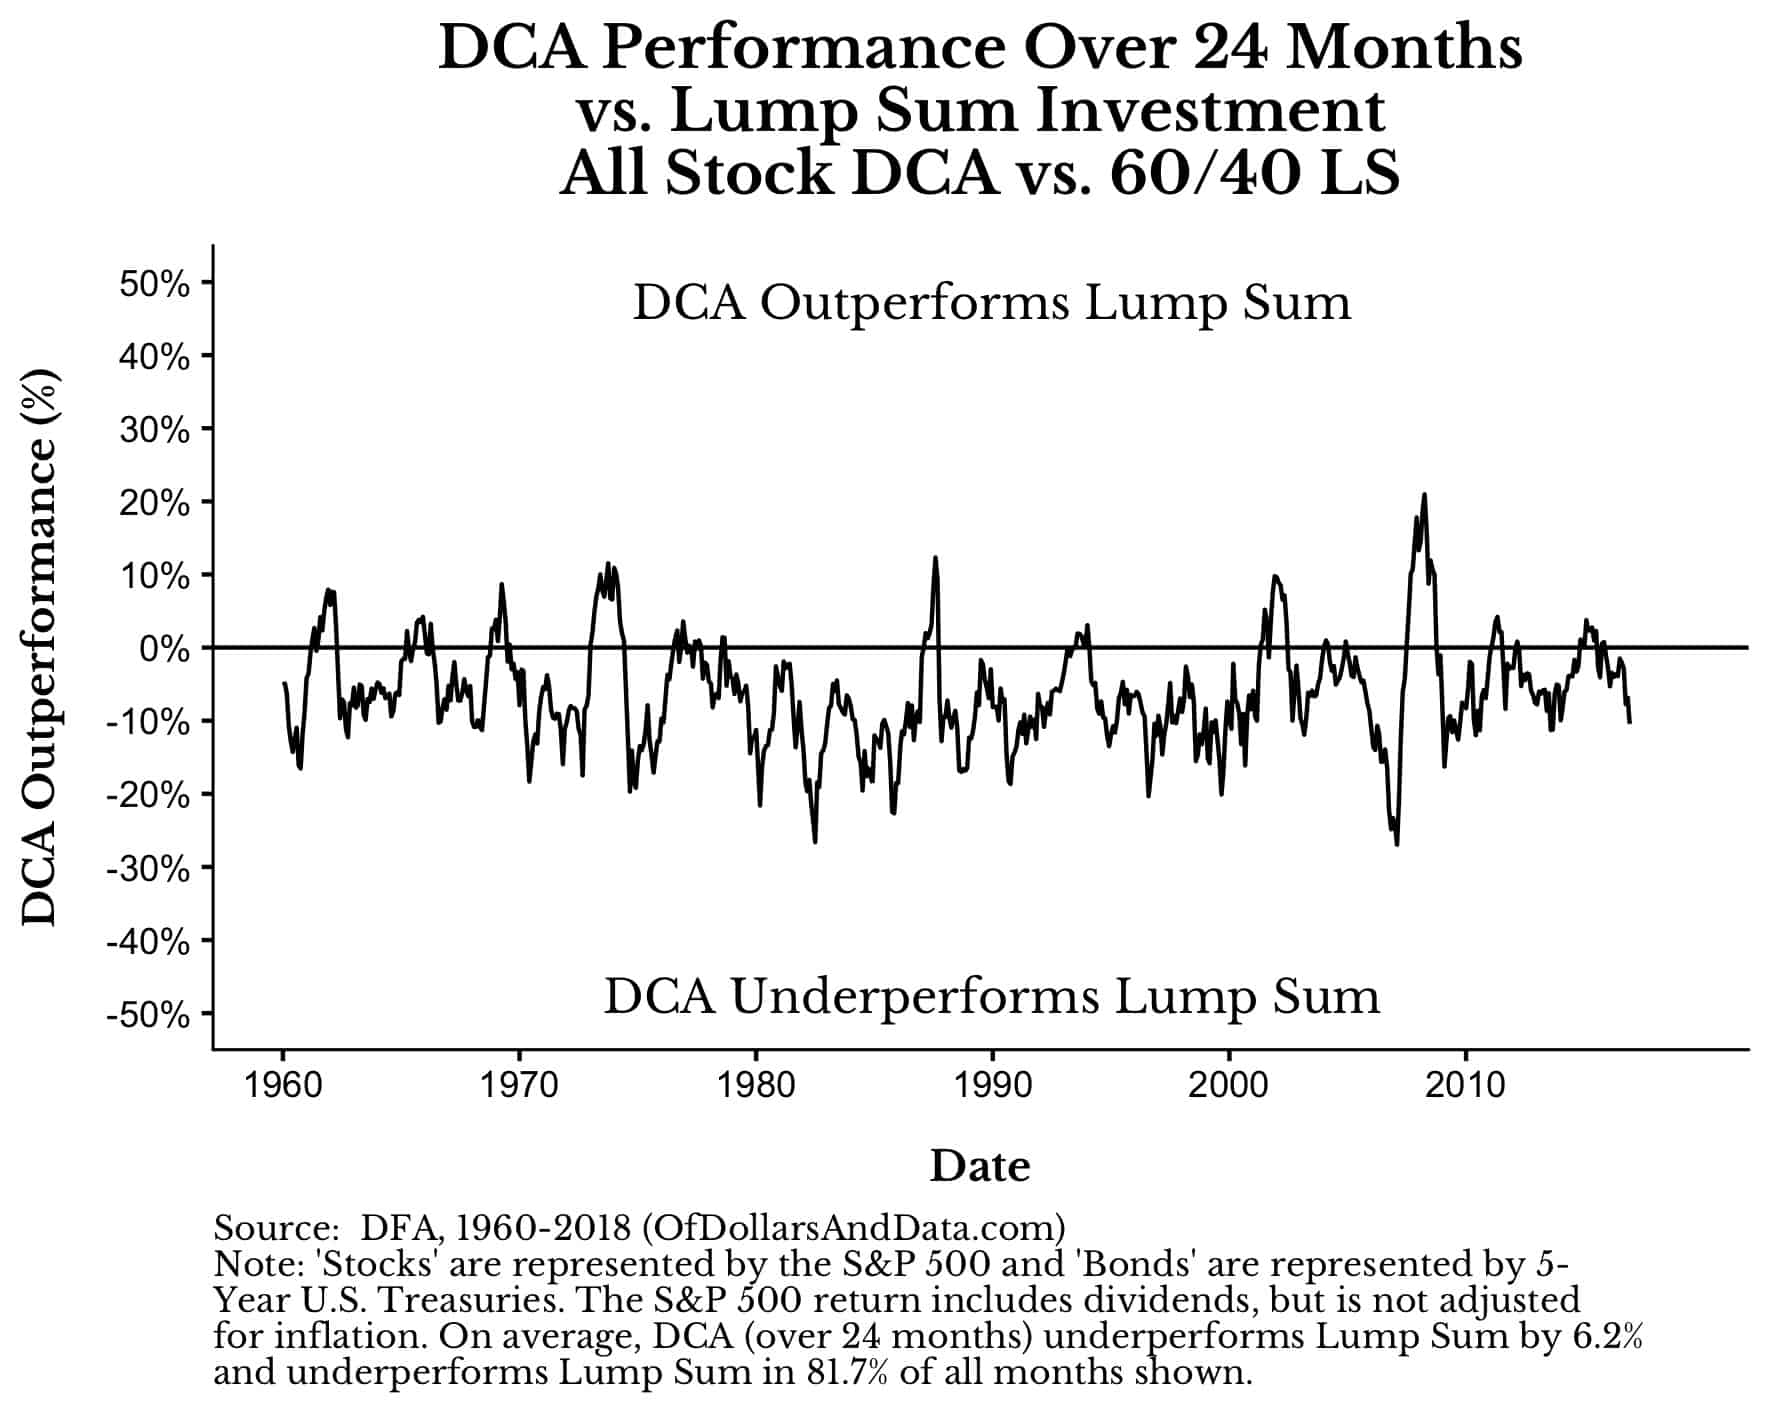
As you can see, in most cases the DCA into 100% stocks underperforms the Lump Sum investment into a more conservative 60/40 portfolio. Looking at the distribution of DCA outperformance compared to the Lump Sum over all 24-month periods from 1960-2018, we can see this more clearly:
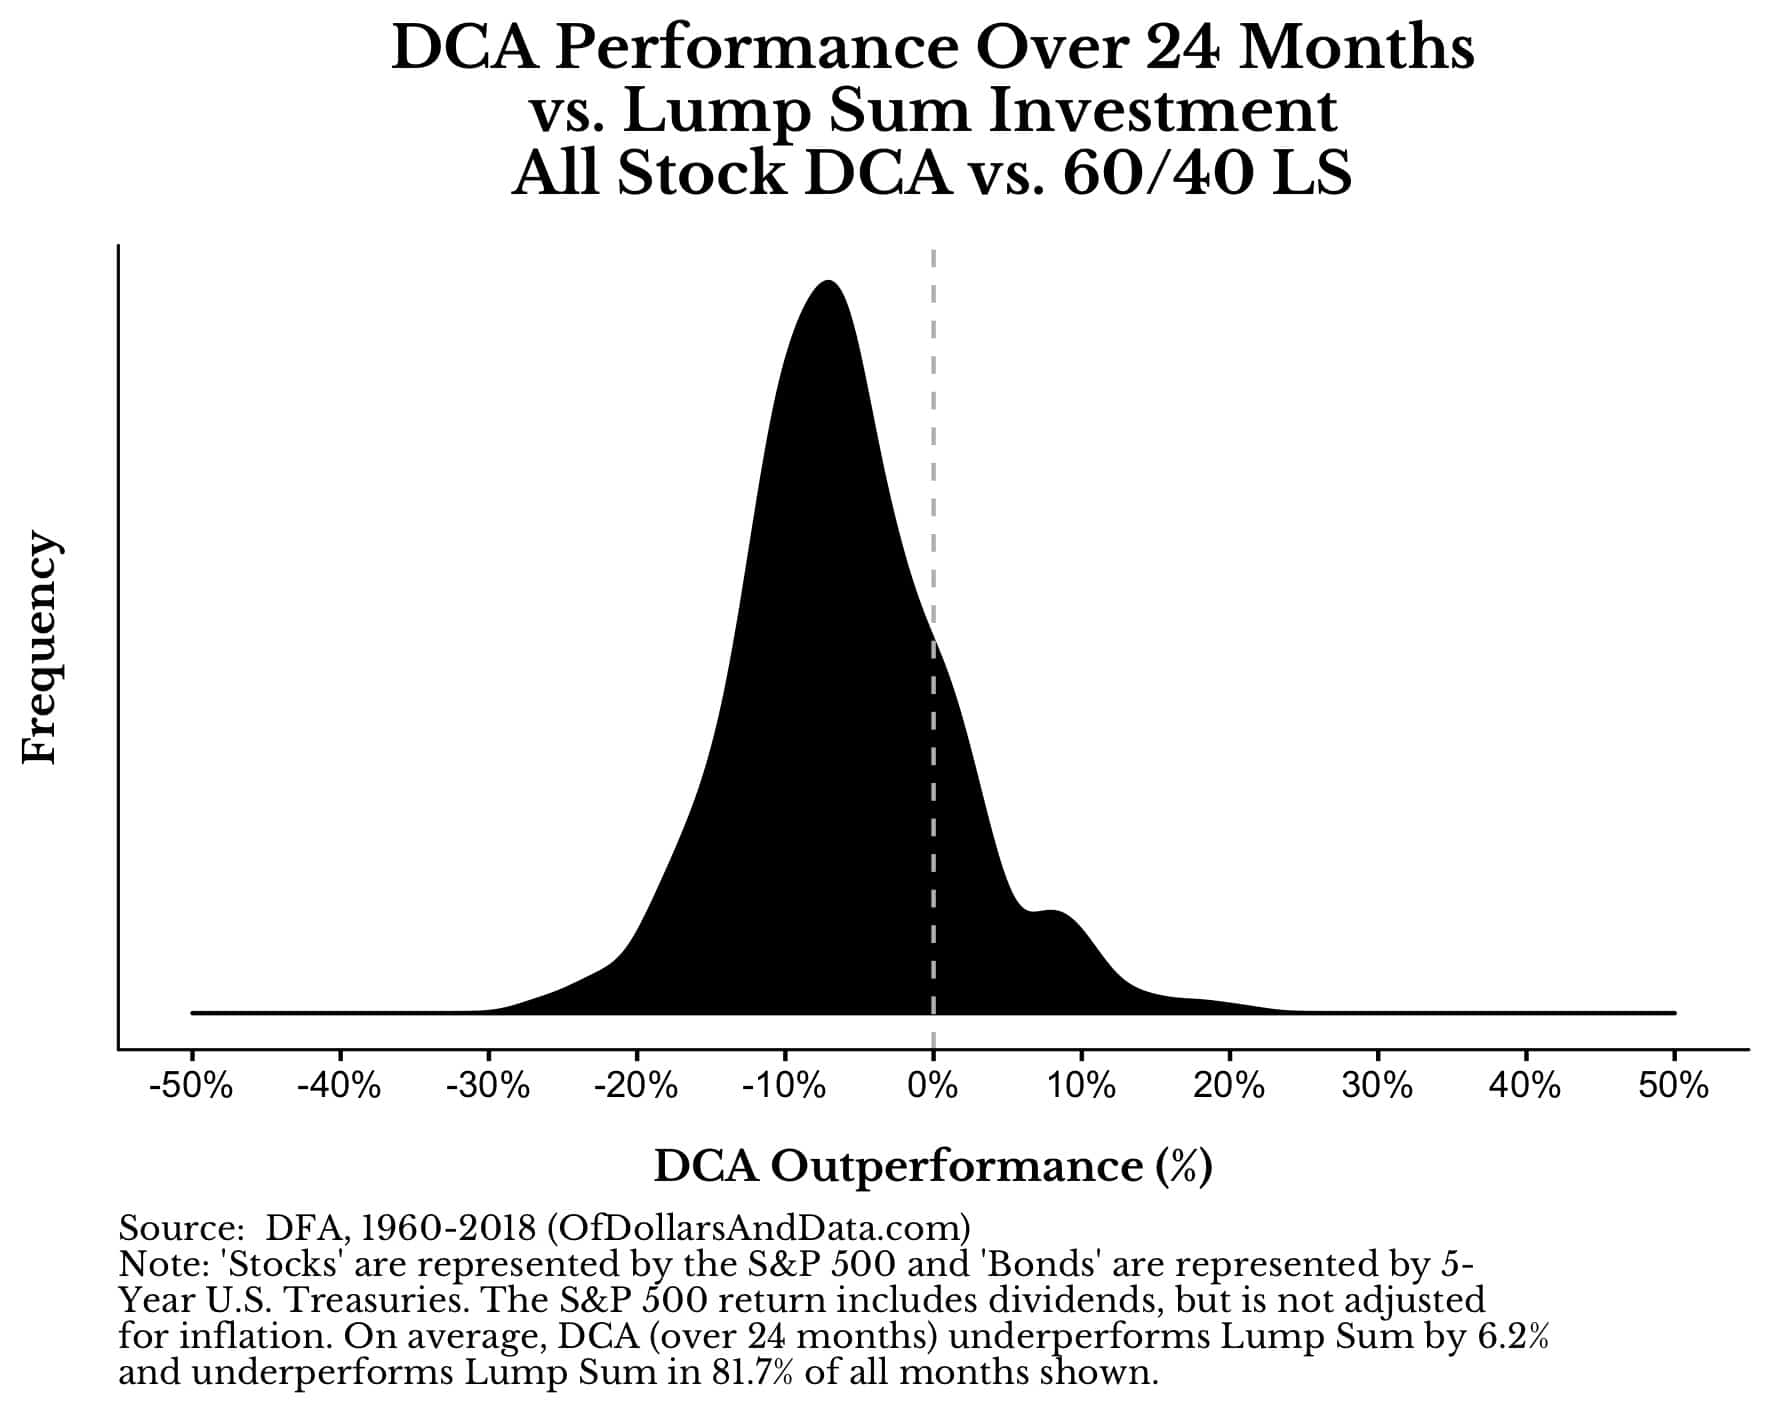
As you can see, doing DCA into an all-stock portfolio over 24 months can’t compete with the initial investment into a 60/40 stock bond portfolio. Why? Because the DCA cash on the sidelines earns nothing.
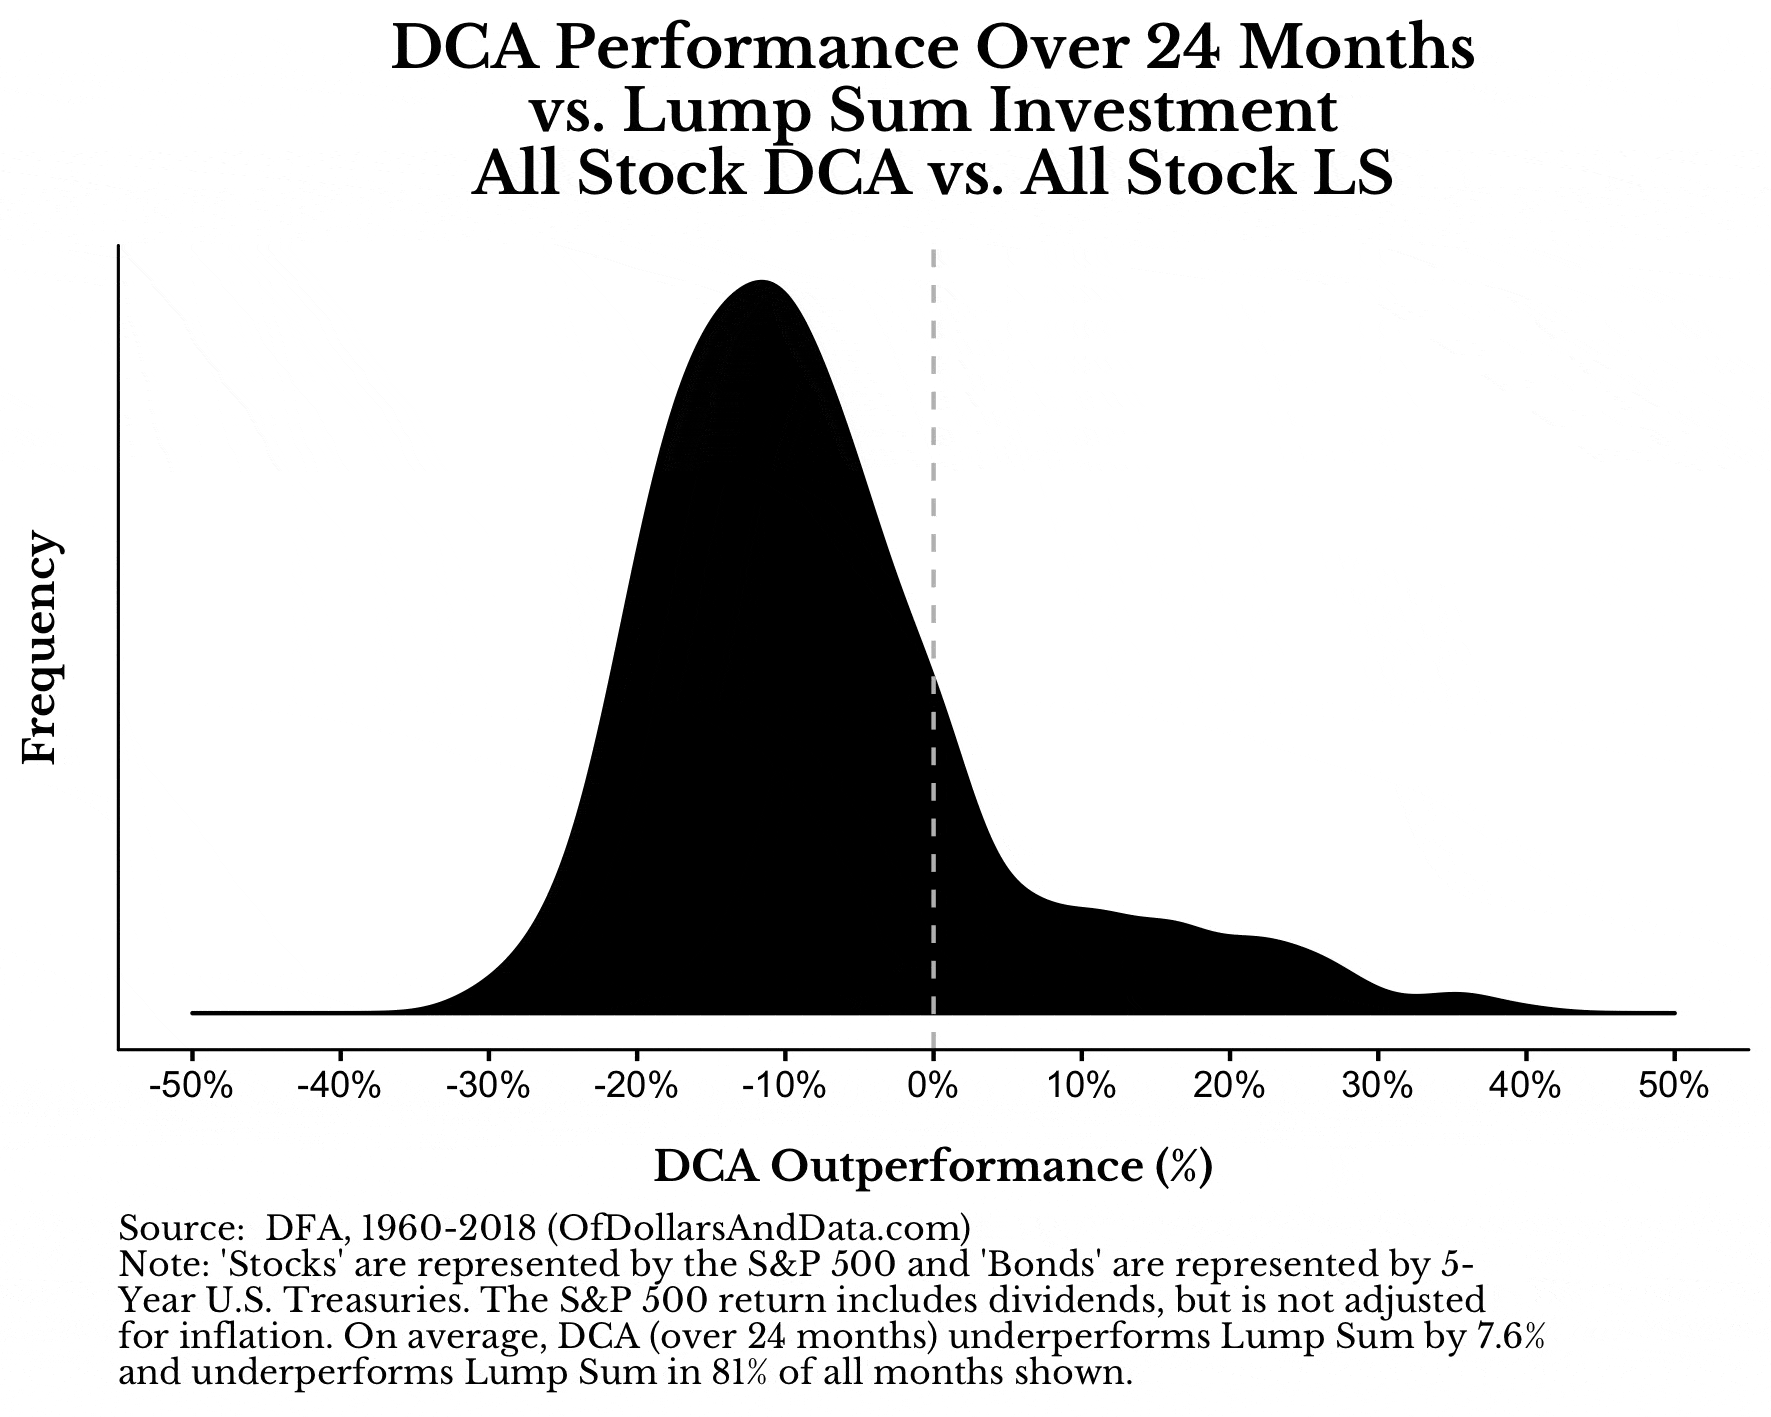
But, this is just the tip of the iceberg. Even as we increase the conservativeness of the portfolios (i.e. add more bonds), they still outperform the DCA into an all-stock portfolio on average:
 In the most extreme example (i.e. a Lump Sum investment into a 100% bond portfolio), the Lump Sum outperforms DCA by 0.9% on average and in nearly half of all 24-month buying windows:
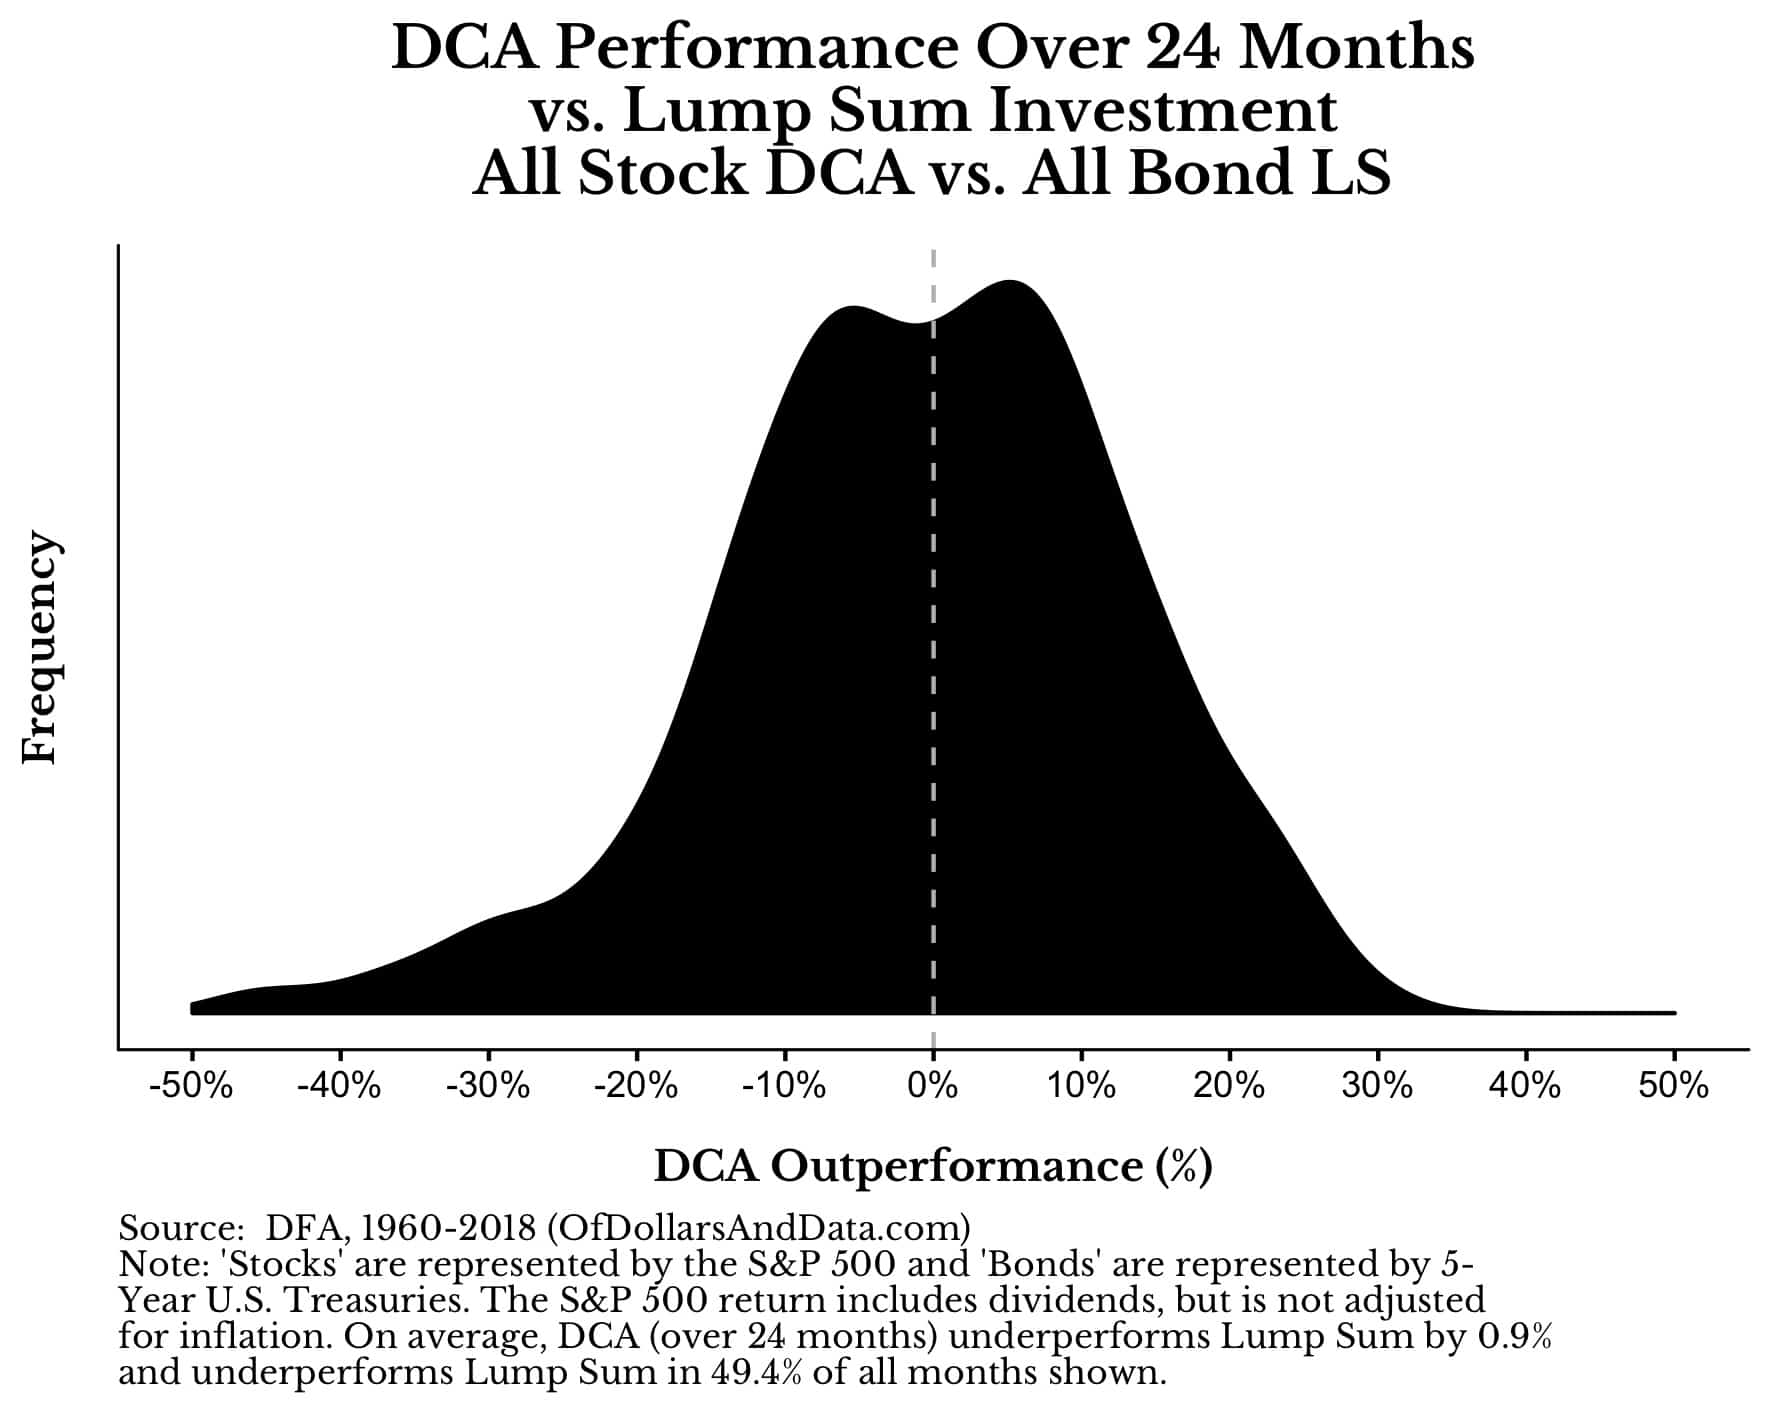
Think about how profound this is. Over the last 60 years there has basically been a 50-50 shot that a 24-month DCA into an all-stock portfolio would underperform an initial Lump Sum investment into an all-bond portfolio! This is nuts.
No investor who eventually wanted a 100% stock allocation would start by going 100% into bonds. But this shows that even if they had done such a ridiculous thing, they would have been roughly the same off.
And these results generalize when you DCA into any stock/bond portfolio over any buying window. So if you have a client who just earned a big windfall and wants to average into to an 60/40 portfolio over the next few years, please stop them. They would be far better off (monetarily) if they just put all of that money to work now in a more conservative portfolio (i.e. 50/50, 30/70, etc.).
You can make their portfolio as conservative as they want, as long as you get them to invest. That’s the important part. As the phrase goes, “Time in the market beats timing the market.” Why?
Because every day your money isn’t working for you, it is inflating away. With 2% annual inflation, you lose half a basis point (0.005%) on your cash holdings day in and day out.
This is why dollar-cost averaging in this context makes absolutely no sense. Because even an extremely conservative portfolio invested immediately will likely outperform DCA. So, if you need to invest lots of money now, but are afraid of possible short-term losses, then ratchet down the risk in your portfolio and put your money to work.
Because the only way to avoid the cost of waiting is to not wait.
Actually…
Every time I do a rigorous mathematical analysis like the one above I always, I repeat, ALWAYS, get someone who tries to nitpick it to death. They might say something like, “Well that’s nice and all, but this wouldn’t be true if the DCA cash on the sidelines was invested in T-bills.”
First off, delete your account. Second off, I love how these people think that if they can find one slight counterpoint to my analysis then everything I said is worthless.
Do you think they actually ran the numbers to see if their theory is true? No, they didn’t. But, guess what? I did. And even if the sideline DCA cash is invested in T-bills, my general conclusion is unchanged. If you don’t believe me, read this guide which goes far more in-depth on this question.
More importantly though, when someone claims that I forgot to include the return on T-bills on the uninvested DCA cash, they are forgetting about the psychological component of investing.
Think about it. If someone is too timid to invest in the stock market right away, do you think that person is going to have the ability to implement a T-bill ladder on their uninvested money over the next 24 months?
Hell no. They are going to sit in cash. Talk to real advisors with real clients facing these kinds of issues and they will tell you the exact same thing.
Anyways, I appreciate your time, even if you plan on “Actually-ing” me. Thank you for reading!
If you liked this post, consider signing up for my newsletter.
This is post 142. Any code I have related to this post can be found here with the same numbering: https://github.com/nmaggiulli/of-dollars-and-data

