It’s Sunday morning. You walk to your mailbox and see a letter from a mysterious stock research firm. The firm claims that their market insights team knows with 100% certainty that a particular stock is going up over the next week. Skeptical, you put the envelope aside and go about your day.
One week later you receive another letter from the same firm, but this time they claim a different stock is about to drop in price. You go back to the first letter, and, lo and behold, they were right. The stock went up. Your interest is piqued.
Over the course of the next week you watch the stock from the second letter drop as predicted. Now you are hooked.
Week after week, letter after letter, the firm continues to reveal the future of a single stock as if reading from a crystal ball. After 10 weeks of correct predictions, you get a final letter asking you to invest money with them for a sizable commission.
You calculate the probability that they could get 10 positive/negative calls correct in a row is 1/1,024 (or 2^10). This can’t be chance, right? You decide to pull the trigger and invest with them. Months later you are broke after the firm fails to repeat their prior success. What went wrong?
Unbeknownst to you, you were not the only individual to receive letters from this mysterious research firm. In fact, in the first week, letters were sent to 10,240 people (including you). Half of these letters (5,120) predicted that stock A would rise, while the other half (5,120) predicted that stock A would fall.
The 5,120 individuals that received the letter saying stock A would rise (the correct group), received a second mailing in the following week. Half of these “week 2” letters (2,560) stated that stock B would rise, while half (2,560) stated that stock B would drop.
This process continued each week with those individuals who received correct calls getting additional mailings. After 10 weeks of this, there are exactly 10 individuals who received 10 correct calls in a row (1/1,024 * 10,240) completely by chance. You happen to be one of the lucky (or shall I say unlucky?) individuals to get 10 correct calls.
This thought experiment, from How Not to Be Wrong: The Power of Mathematical Thinking by Jordan Ellenberg, illustrates how statistical happenstance can masquerade as skill. The problem we will face throughout life is how to differentiate between causation and correlation—between signal and noise.
To illustrate this, let’s examine something I am calling The McRib Effect.
Every year since 2010, McDonald’s re-releases its pork-based sandwich, the McRib, for a limited time across the U.S. After hearing that the McRib was being re-released on October 29, 2018, I immediately wondered whether the McRib’s availability had any affect on the stock market.
I found some historical re-release dates online, ran the numbers, and discovered I was right:
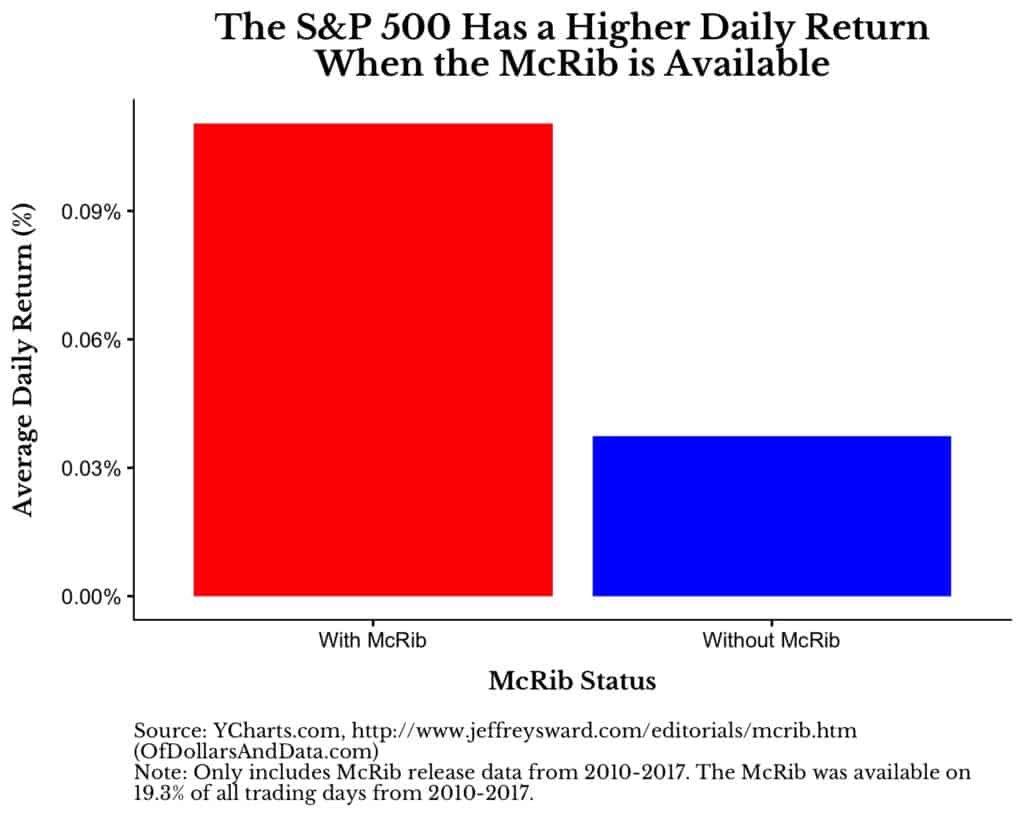
When the McRib is available, the S&P 500 has an average daily return about 7 basis points (0.07%) higher than on days when it is not available. To put that into perspective, when annualized, that difference would be 19% every year.
The question remains though: is this difference legitimate? Do investors in American equities change their behavior (maybe at a subconscious level) when the McRib is freely available to be consumed? Does its presence provide some sort of nostalgia that makes us collectively bid up equity prices? Or is it merely a statistical anomaly?
After having a slight chuckle and sharing this on Twitter, I decided to find out.
The first thing I did was run a t-test on the difference in returns between when the McRib is available and when it isn’t. Unsurprisingly, the difference was not statistically significant (p-value = 0.19). Afterwards, I ran 10,000 simulations in which McDonalds re-released the McRib at different times throughout 2010-2017 for the same number of total days and then compared to see how many simulations showed results as extreme as the real world.
After running the simulations, only 4.6% of them had the McRib days outperforming the non-McRib days by over 0.07%, on average. This might make the McRib Effect seem more plausible, but I also found that 4.2% of the simulations had the non-McRib days outperforming the McRib days by over 0.07%, on average. This is the exact opposite of what I was looking for.
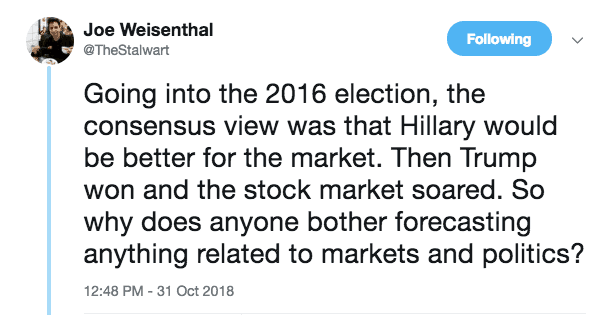
While you might laugh at the McRib Effect as an obvious example of “correlation does not equal causation,” I don’t see how it is that different from a lot of the arguments I see being made about financial markets every single day. Some pundit will claim that event X caused the market to drop or how President A was better than President B for stocks.
All of these arguments boil down to inferring simple causality for a complex, chaotic system involving millions of decision makers. To think that one individual has an effect that is both large and measurable on aggregate equity performance is absurd. Joe Weisenthal’s tweet knocks it out of the park:
It reminds me of the famous reply given to the Nobel laureate Ken Arrow after he discovered that his long term weather forecasts were no better than chance:
The Commanding General is well aware that the forecasts are no good. However, he needs them for planning purposes.
This quote perfectly exemplifies the struggle our society faces with understanding causality. We all want a simple answer though the truth is usually far messier.
#NotMySample
I wrote about the McRib Effect to remind you that causality is not, and will never be, easy to determine. Understanding cause and effect is the biggest problem facing society because it touches every part of our lives. Health? Politics? Economics?
All of these, and more, involve making causal arguments around systems that are highly complex. And we make policy decisions based on these arguments that go on to affect millions of Americans. While I wish these issues had a one-size-fits-all solution, they probably don’t.
Additionally, in trying to understand causality in these fields, we are plagued by small or incomplete sample sizes. We can’t re-run the DotCom bubble with a different Fed Chair or a different President. We can’t easily test the effect that one particular food has on overall health.
There are too many other variables that are changing at the same time and are highly correlated. Just try and find me a sufficient sample size of ultra-marathoners that also smoke a pack of cigarettes a day and you will understand this plight.
Does this mean we are doomed? Not necessarily. While we will likely never have the ability to predict the future of chaotic systems (i.e. the stock market), if we stay cognizant of the inherent difficulties in assigning causality, we stand a better chance of understanding what is true. Thank you for reading!
If you liked this post, consider signing up for my newsletter.
This is post 97. Any code I have related to this post can be found here with the same numbering: https://github.com/nmaggiulli/of-dollars-and-data

