High returns and low risk. It’s what every investor wants, but what few investors get. However, even if you could limit the amount of money you could lose in the stock market, would it be worth it? Is avoiding the downside worth missing some potential upside? To test this question, consider the following thought experiment:
Imagine there exists a market “genie” who approaches you every December 31 with information about the U.S. stock market for the next year.
Unfortunately, this genie cannot tell you which individual stocks to buy or how the market will perform, but the genie does know how much the stock market will be down at its worst point (“maximum intrayear drawdown”) in the next 12 months.
My question to you is: how much would the market have to decline at its worst point in the next year for you to forgo investing in stocks (S&P 500) to invest in bonds (5-Year U.S. Treasuries)?
Before you answer the question, let me provide you with some data so that you are better informed. Since 1950, the average maximum intrayear drawdown for the S&P 500 has been 13.5% with a median drawdown of 10.6%. This means that if you had bought the S&P 500 on January 1 of any given year, on average, the market would be down by 13.5% at some point during the year:
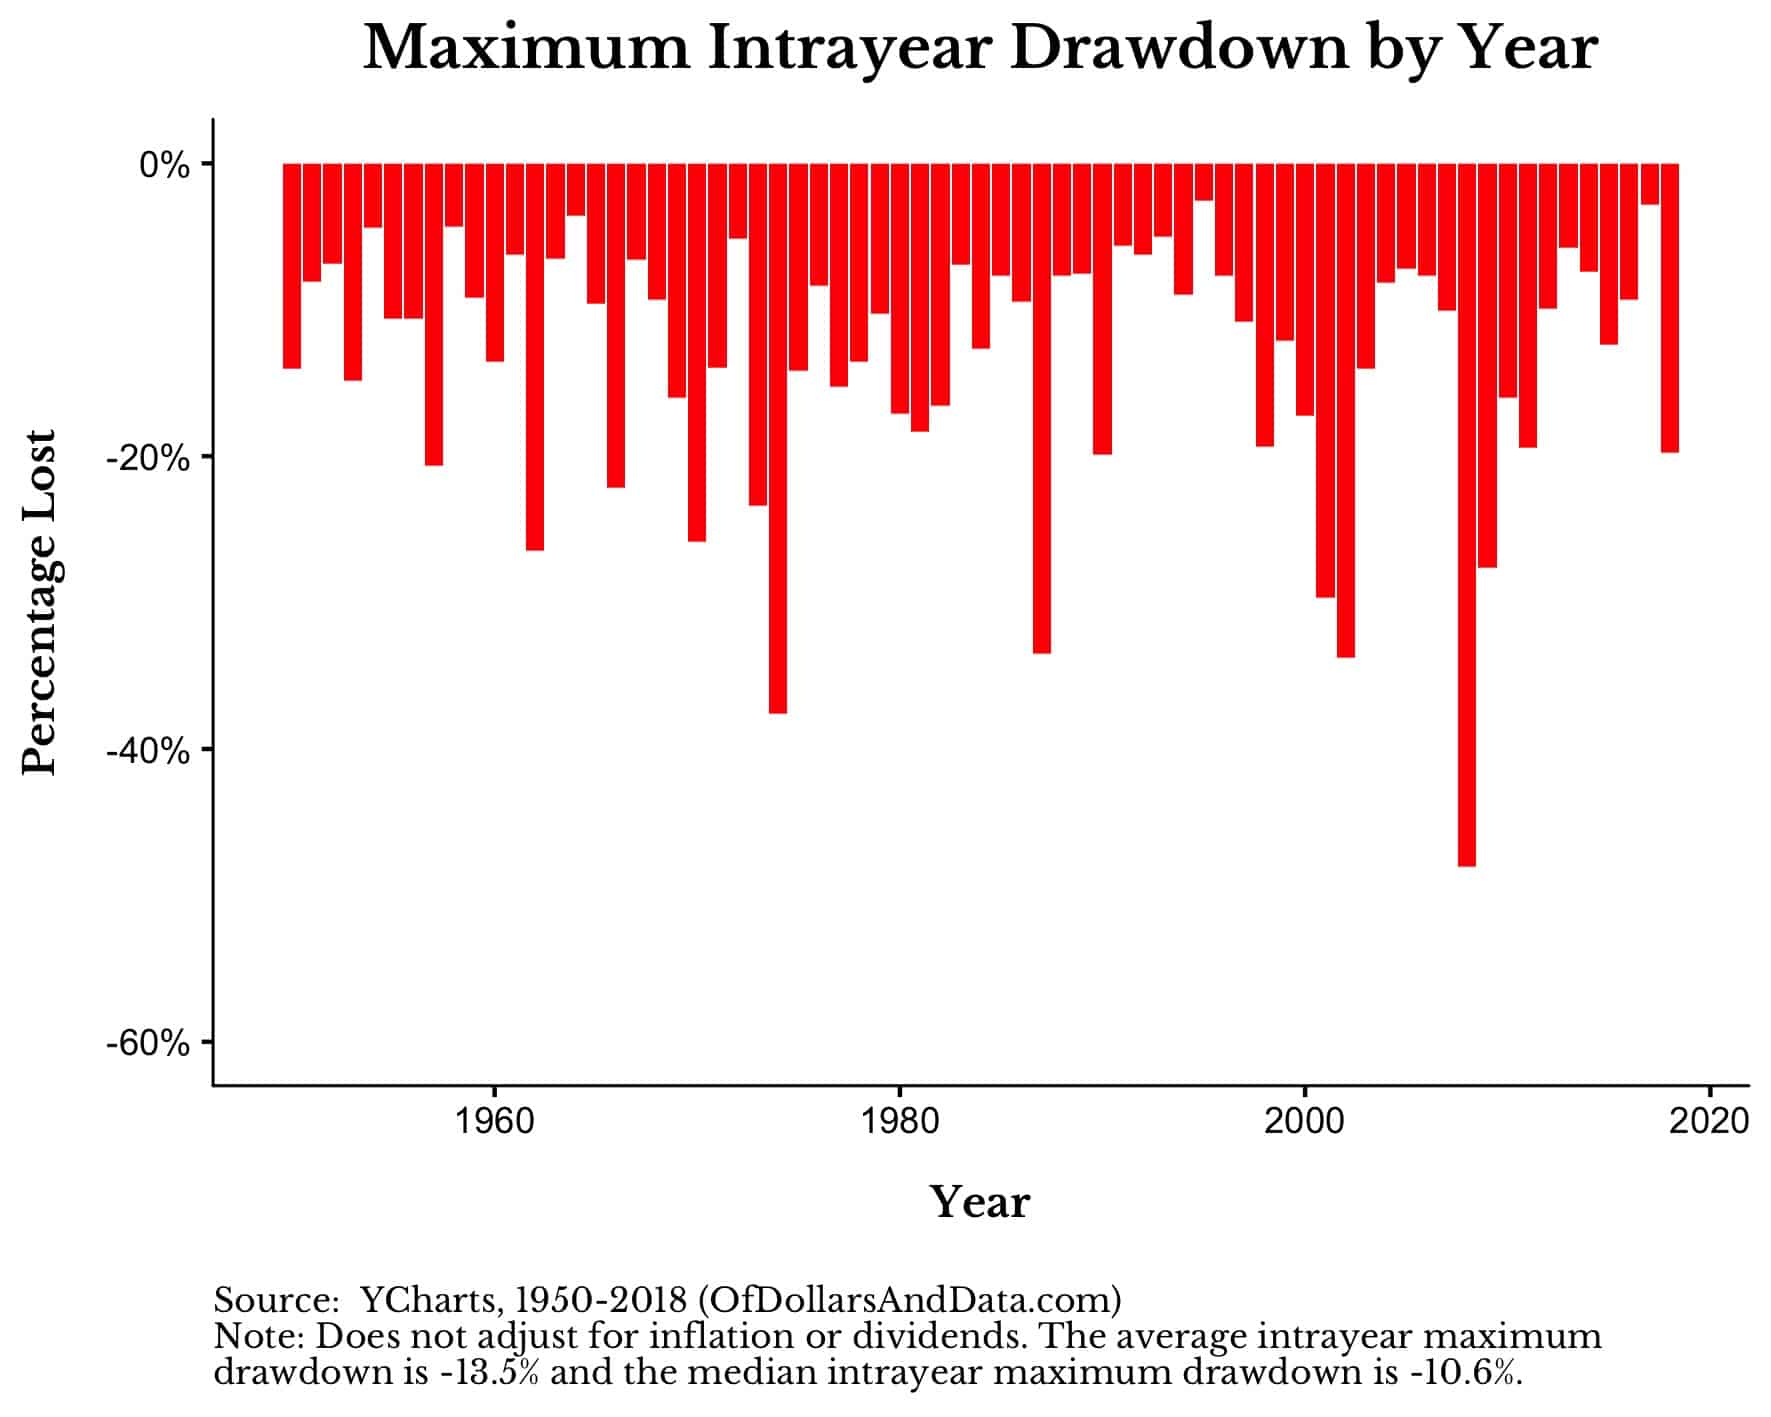
Seeing all this red, what drawdown threshold would you choose to avoid?
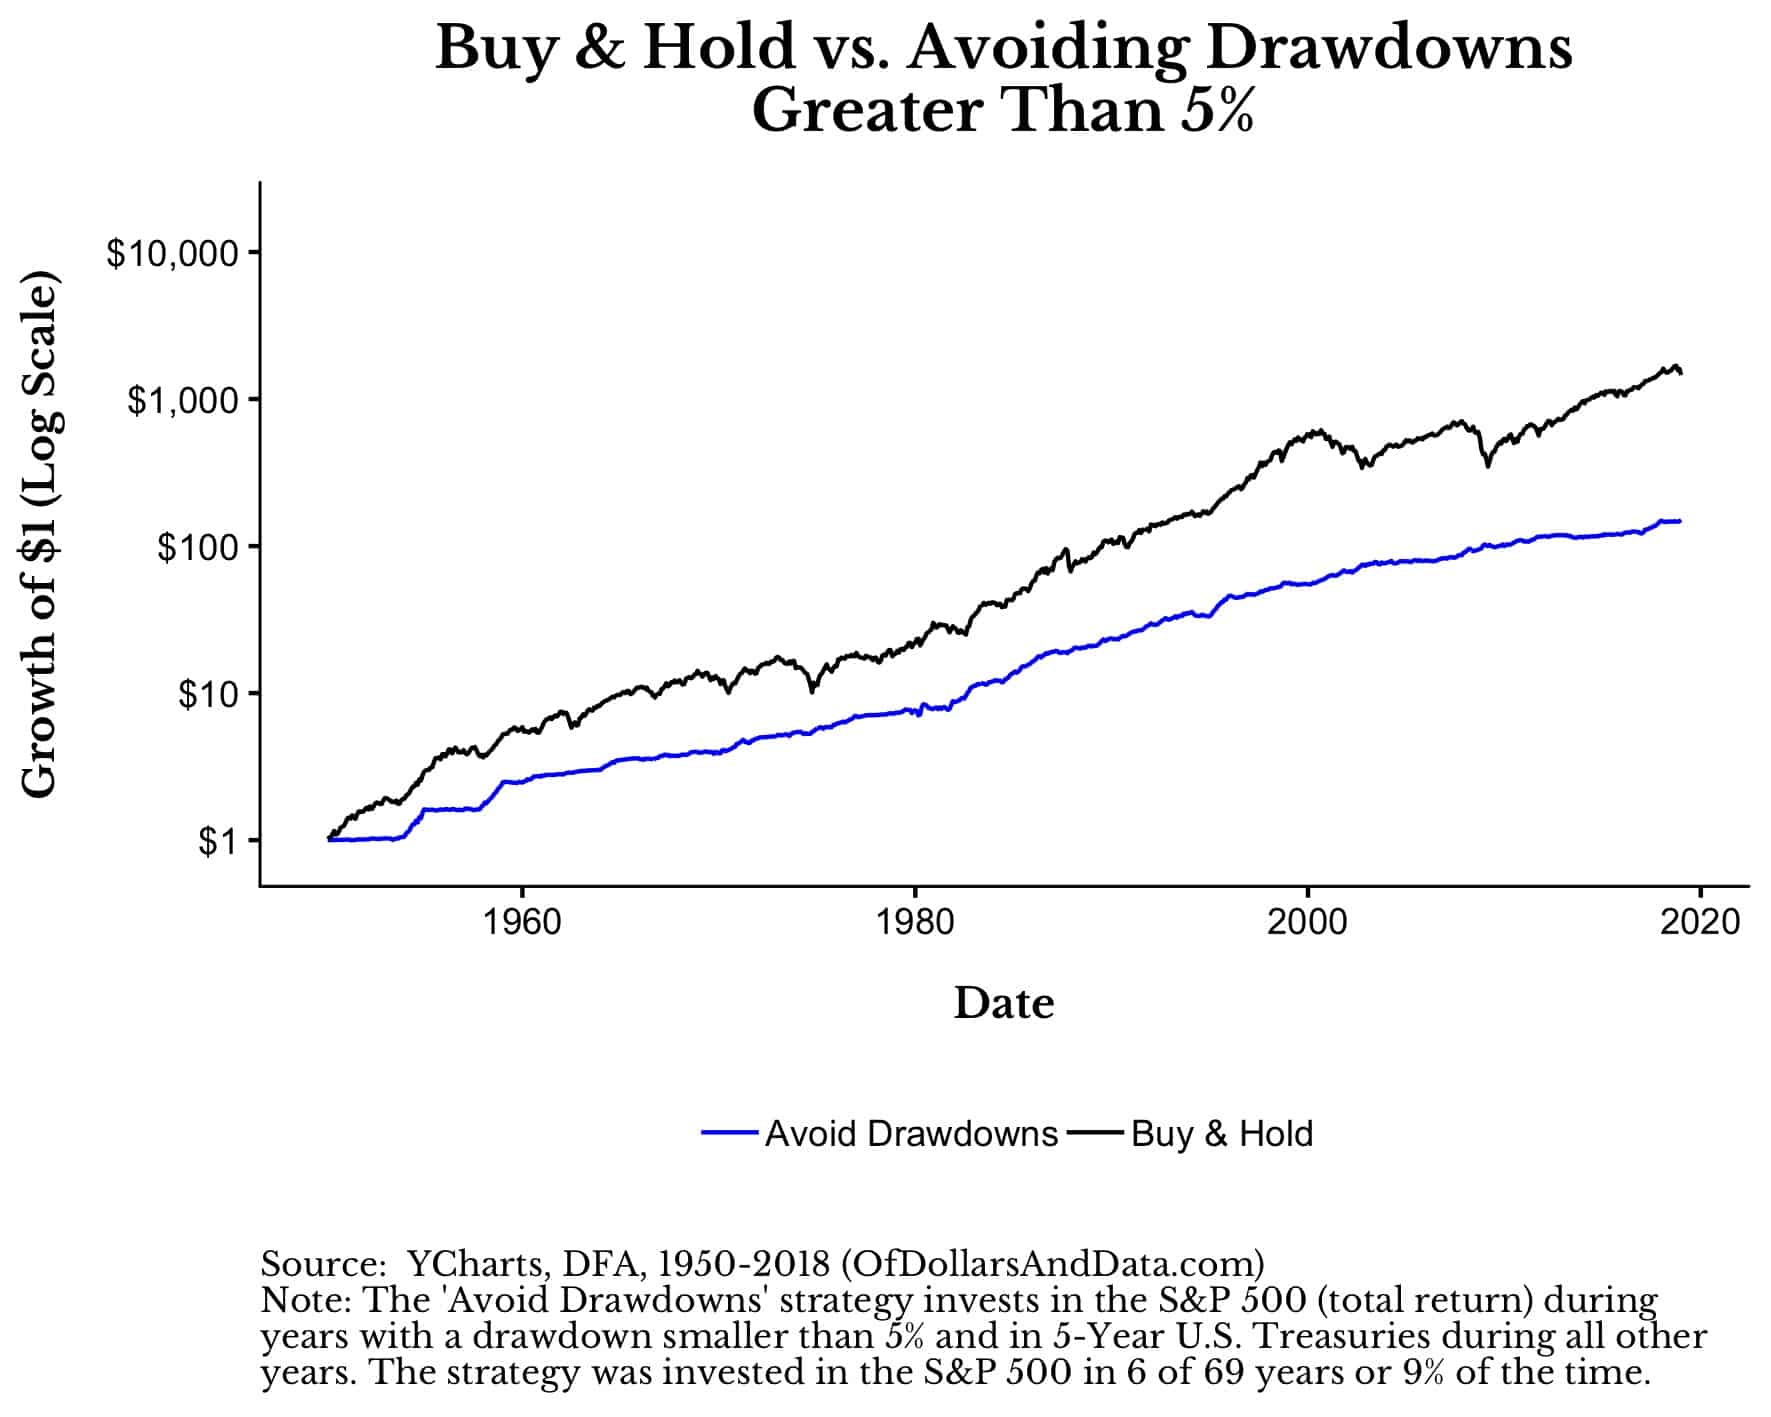
Let’s start by assuming you go ultra-conservative with your money. You tell the genie that you would avoid stocks in any year where there was a drawdown of 5% or more.
If you had decided to avoid all years with 5% drawdowns (or greater) since 1950, it would have cost you dearly. By 2018 you would have 90% less money than Buy & Hold (Note: the y-axis is a log scale):
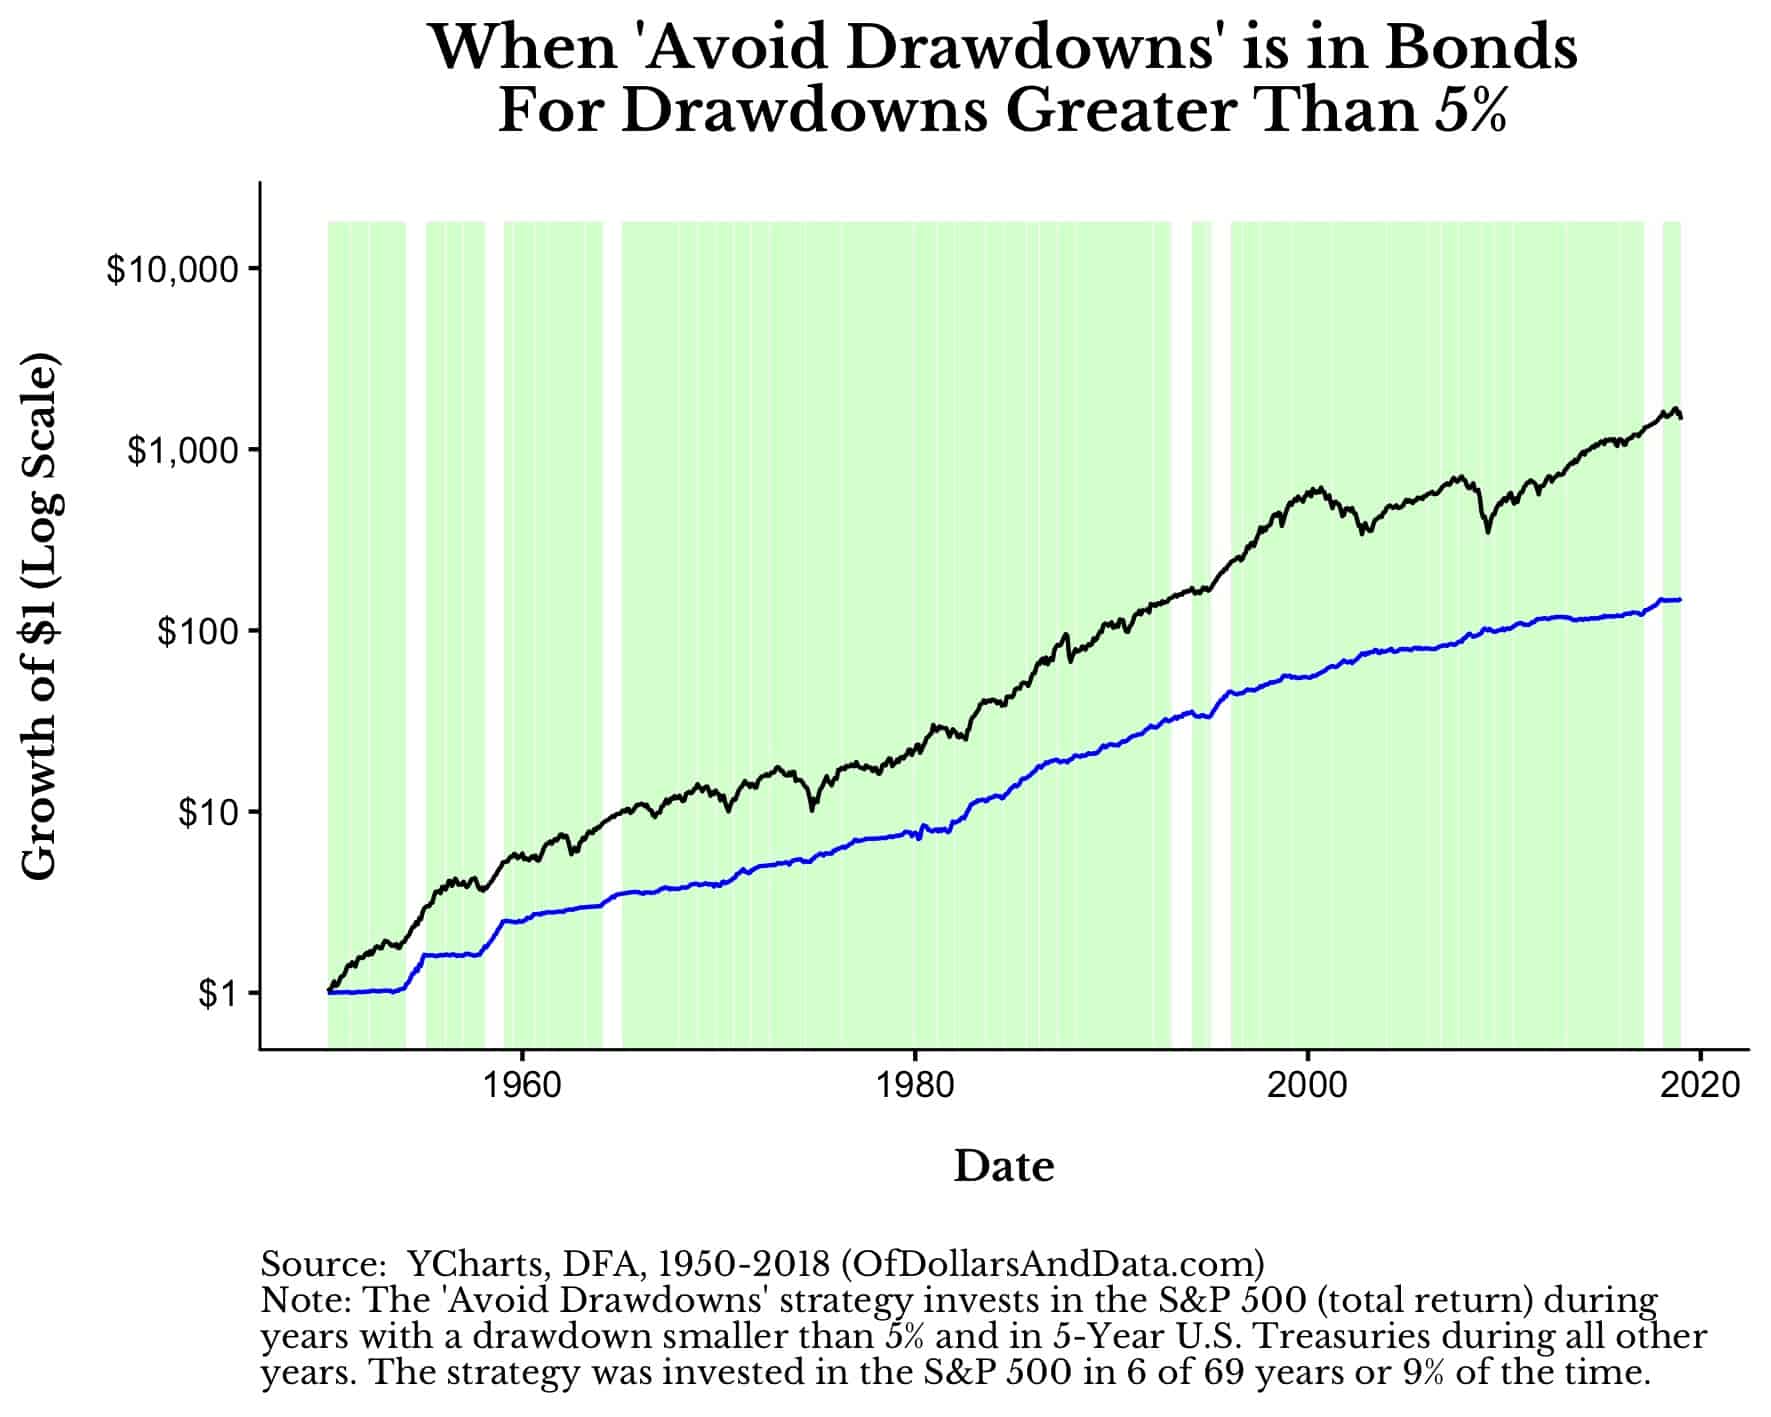
The reason you underperform Buy & Hold is simply because you are out of the market too often. As you can see below, the ‘Avoid Drawdowns’ strategy is in bonds (green shading) in all but 6 years since 1950, or 91% of the time:
This is obviously too safe of a route to take, so the question is what if we increased the drawdown threshold? Instead of avoiding 5%+ drawdowns, what if we avoided 10%+, 15%+, etc? The GIF below shows what happens as you increase the drawdown avoidance threshold from 5% up to 40% (note: the largest intrayear drawdown in our data is 48% in 2008):
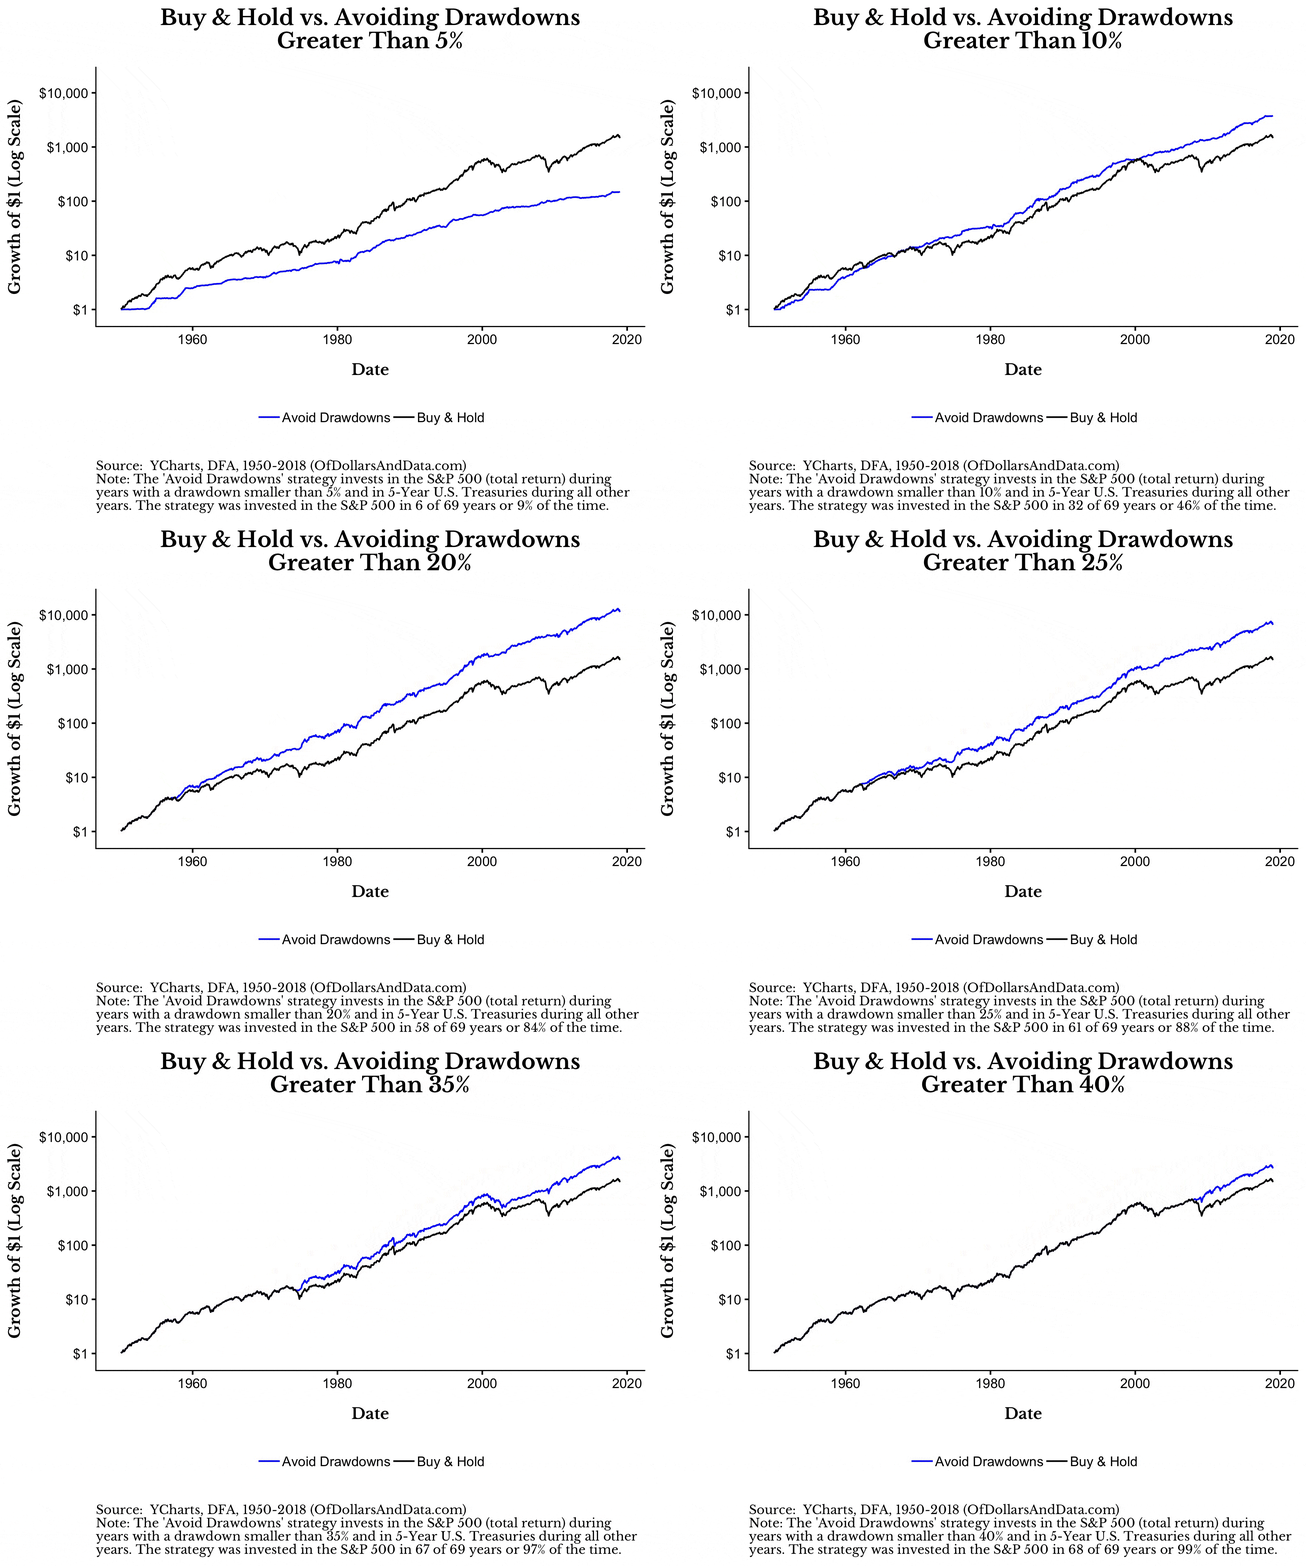
What you will see is that the ‘Avoid Drawdowns’ strategy doesn’t start to outperform until you can avoid drawdowns greater than 10%. Additionally, you will notice that the absolute best performance happens when avoiding drawdowns of 15% or greater. While avoiding all 15%+ drawdowns, you would be in bonds about one-third of the time:
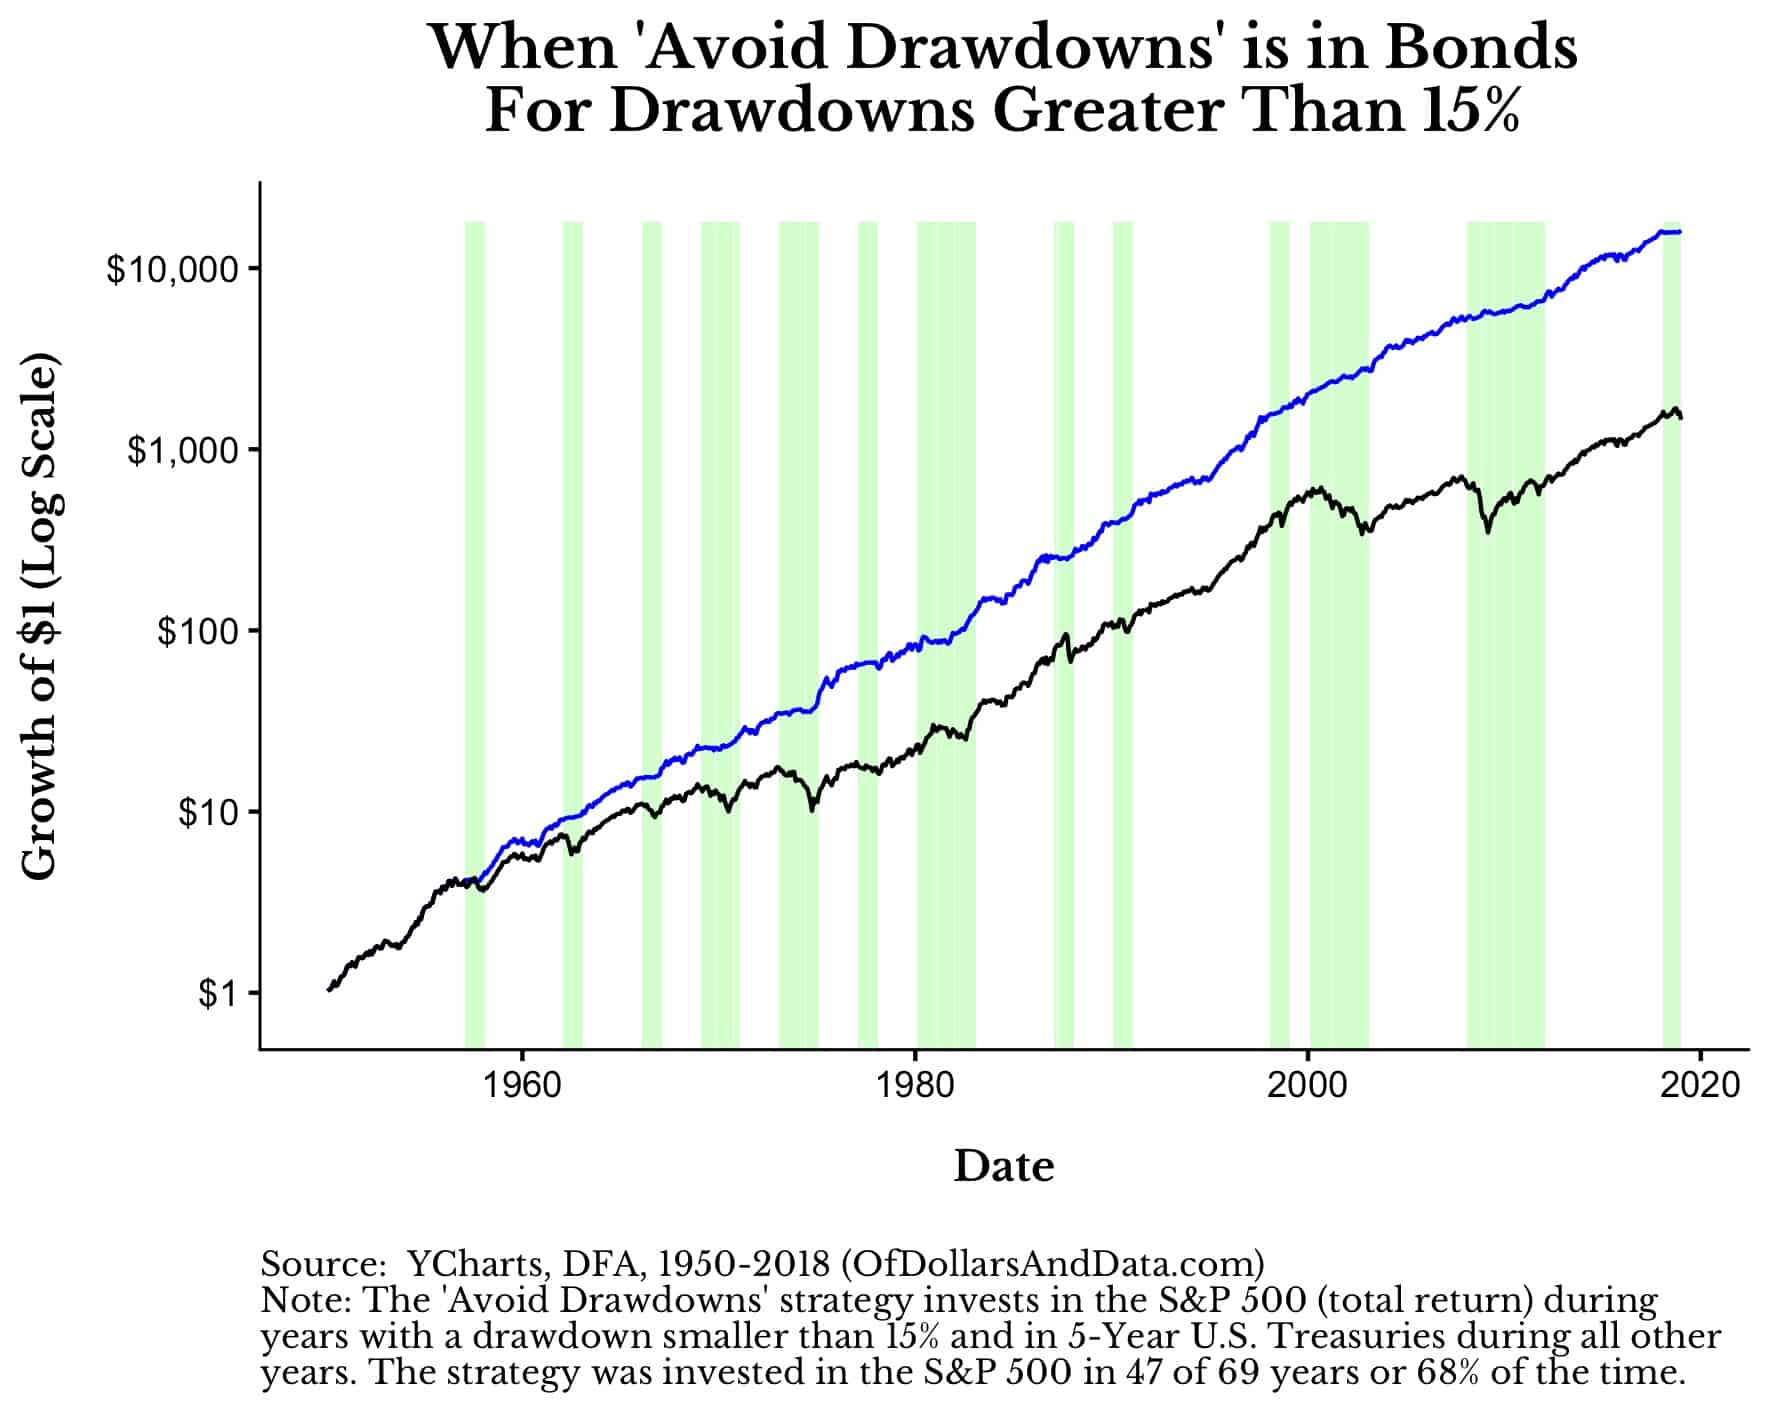
However, increasing the drawdown threshold above 15% (i.e. 20%, 30%, etc.) gives you less outperformance as you spend more time in stocks.
Why is this result this way? Because larger drawdowns are generally correlated with worse return performance by year end. Looking at all intrayear drawdowns and annual returns for the S&P 500 you will see this negative relationship:
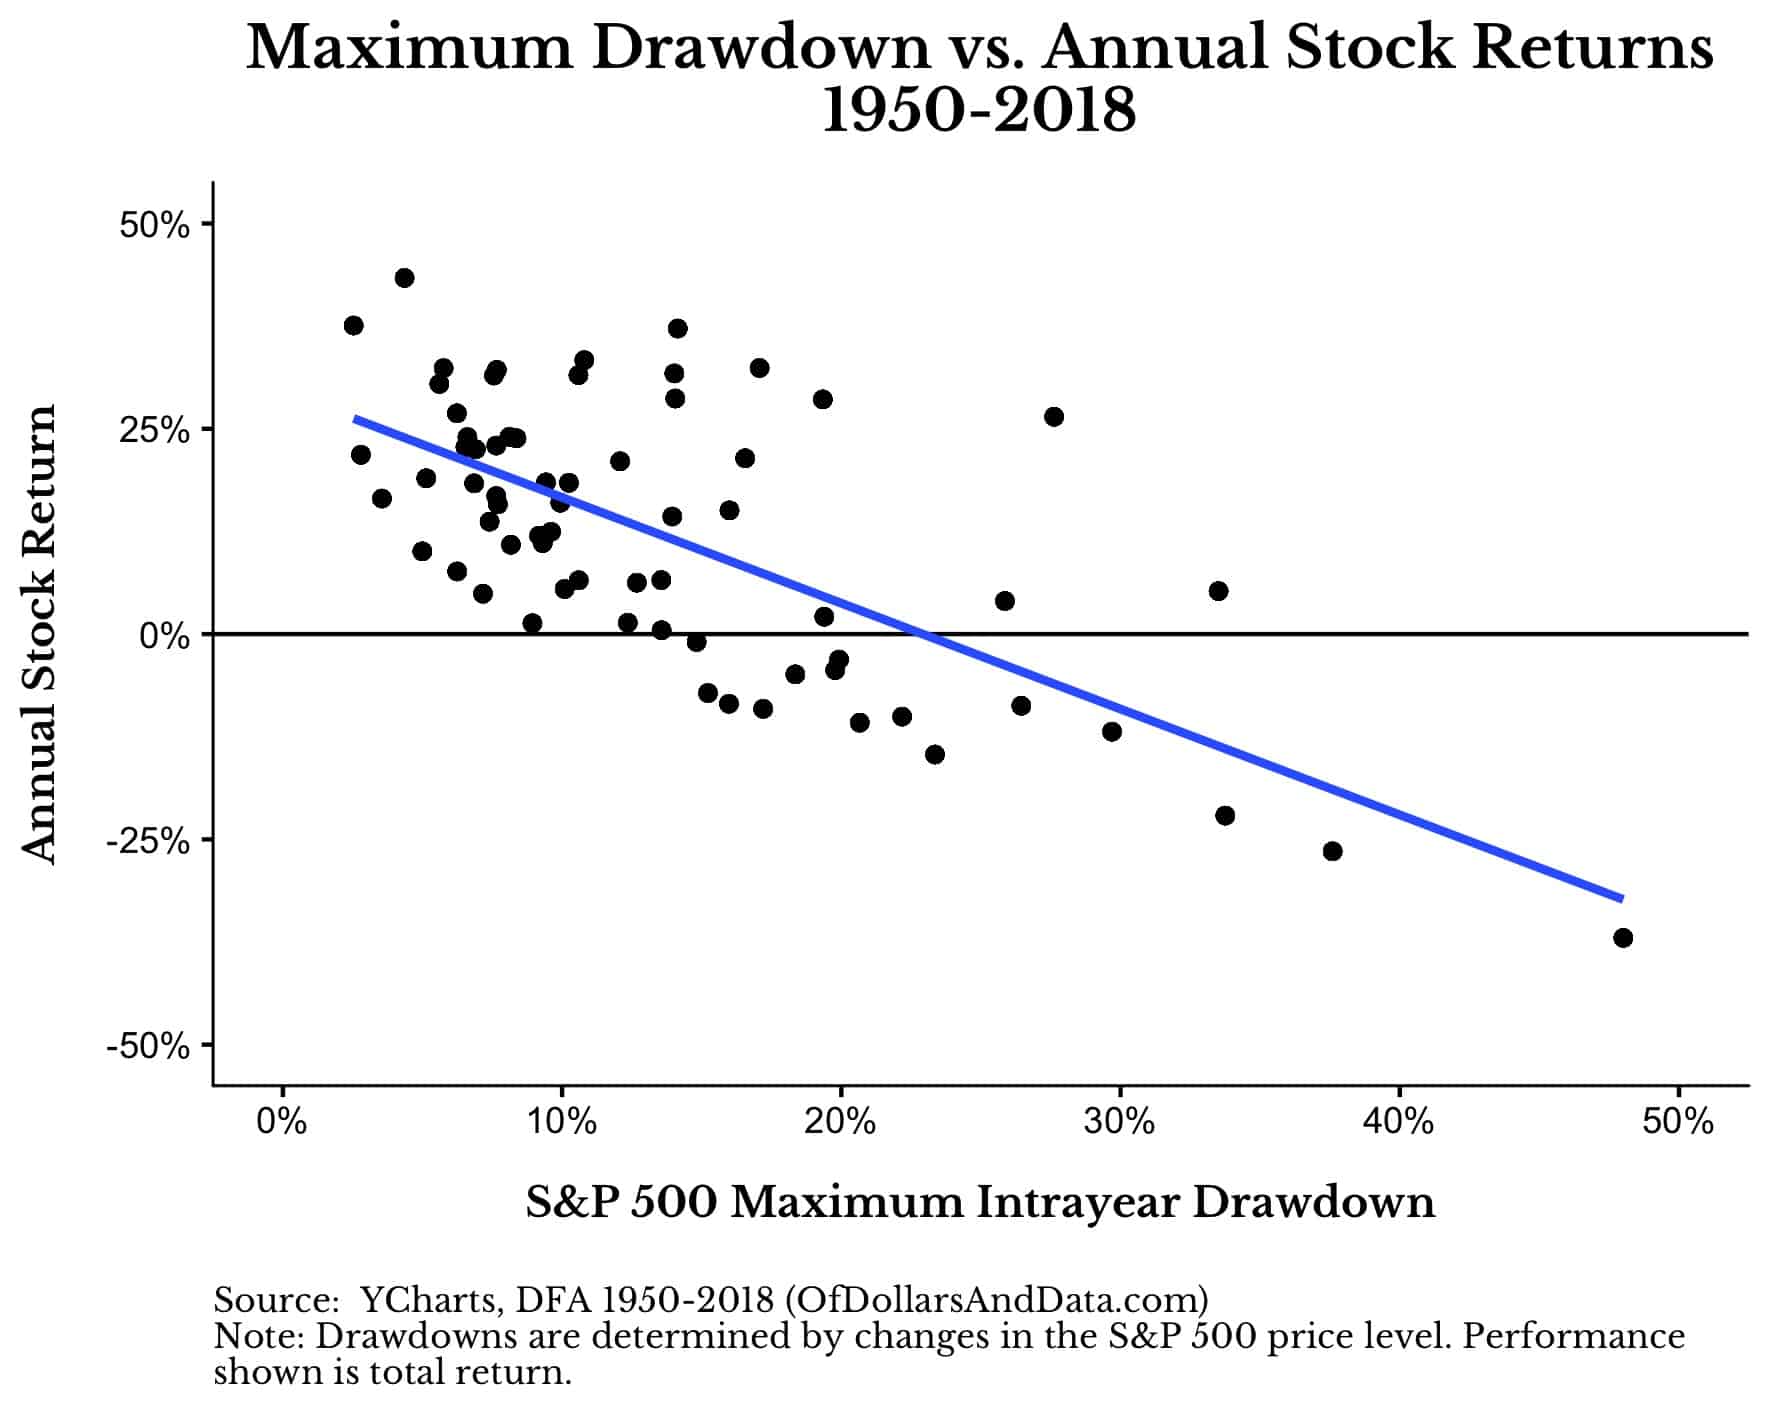
This relationship implies that there is some level of drawdowns we want to accept (5%-15%) and some level at which it is no longer beneficial for performance (>15%).
The more important insight from the plot above is that the S&P 500 has had a positive return in every year since 1950 with an intrayear drawdown of 10% or less.
This, my friends, is the price of admission. Because markets won’t give you a ride without some bumps along the way. You have to experience some downside to earn your upside. And, as the plots above illustrate, avoiding these bumps can be beneficial, though knowing when they will occur is near impossible. Unfortunately, there is no magic genie.
What do we have instead? We have the ability to diversify. I know you have probably heard this many times over, but the plot below illustrates why diversification is important. Like the plot above, it shows the intrayear drawdowns for the S&P 500, but instead of plotting the annual returns for stocks it plots the annual returns for bonds (5-Year U.S. Treasuries) :
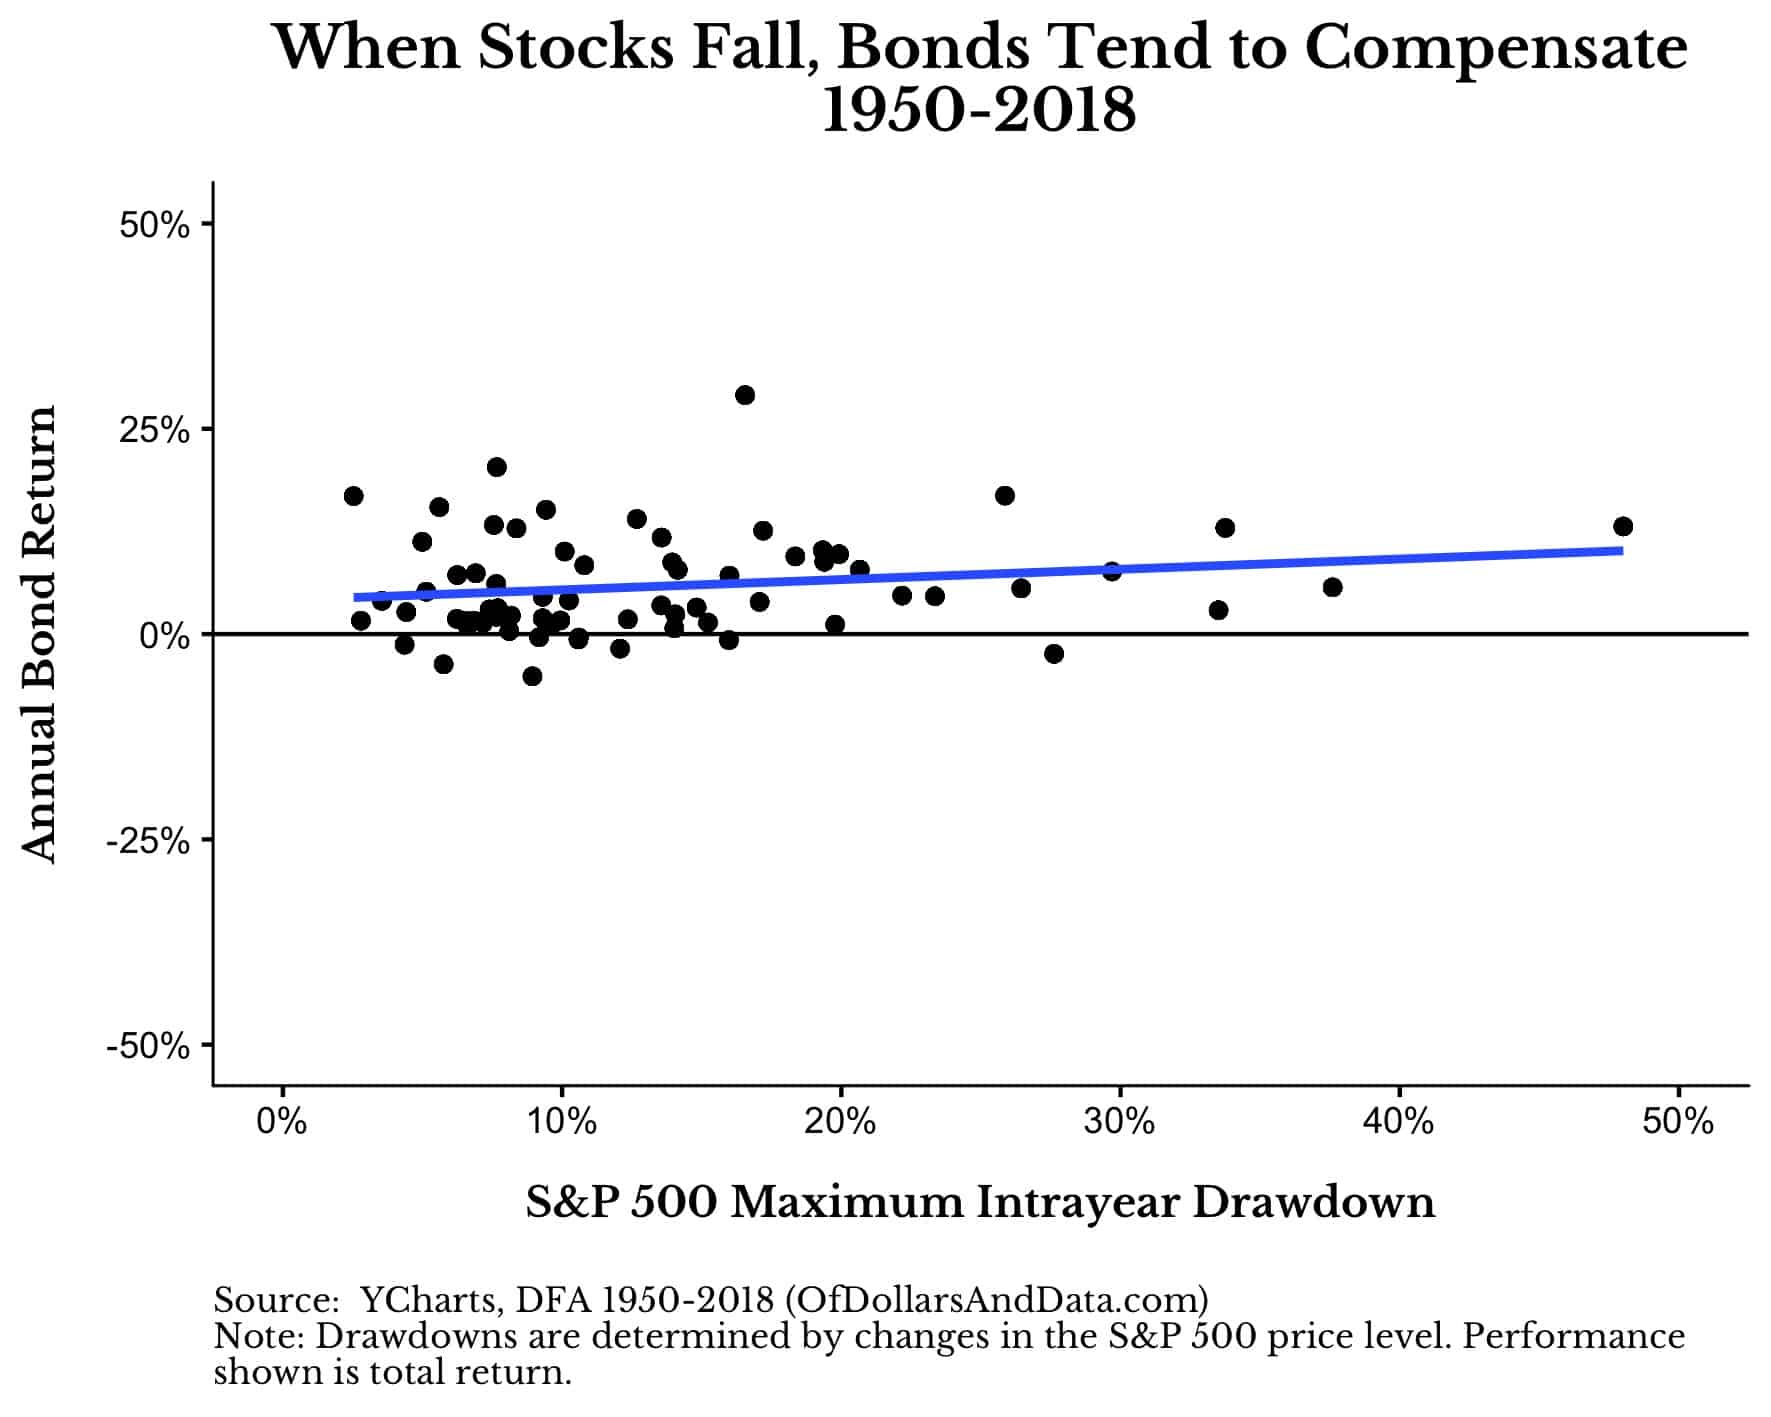
It’s this slightly positive relationship between S&P 500 intrayear drawdowns and bond returns that make it easier to stomach volatility when it inevitably arrives. And it will arrive and in full force. But you should expect this to happen. It’s quite normal. But, don’t take it from me, consider the wisdom of Charlie Munger:
If you’re not willing to react with equanimity to a market price decline of 50% two or three times a century, you’re not fit to be a common shareholder and you deserve the mediocre result you’re going to get.
Munger, like many other great investors, was willing to stomach this volatility. Can you?
Avoid Downturns…If You Dare
While we don’t have a magic genie that can tell us when to avoid declines in the stock market, we do have trend following. Trend following uses simple price signals, such as the 200-day moving average, to determine when to be “in” or “out” of a market and it has quite a bit of evidence in its favor.
However, the problem with trend following, as Ben Carlson pointed out, is that it can go through long periods of underperformance when there are no large declines in a market. So, while I would recommend the approach for some portion of a portfolio, you have to understand its limitations.
As Michael Batnick once said:
The price of being tactical are the inevitable false positives, where you sell only to buy back in at higher prices. I’m fine with this; I’m willing to accept small paper cuts in order to avoid a giant gash.
That’s the price of admission. Thank you for reading.
If you liked this post, consider signing up for my newsletter.
This is post 132. Any code I have related to this post can be found here with the same numbering: https://github.com/nmaggiulli/of-dollars-and-data

