For most of us, March 9, 2020 was the worst day of our investment lives. Before I dig into why this is true for the vast majority of the people reading this, let’s discuss how that day played out.
Shortly after the opening bell, the market opened down 7% and the NYSE was forced to halt all trading for 15 minutes (per its trading rules). The last time the NYSE halted trading due to volatile market activity was on October 27, 1997.
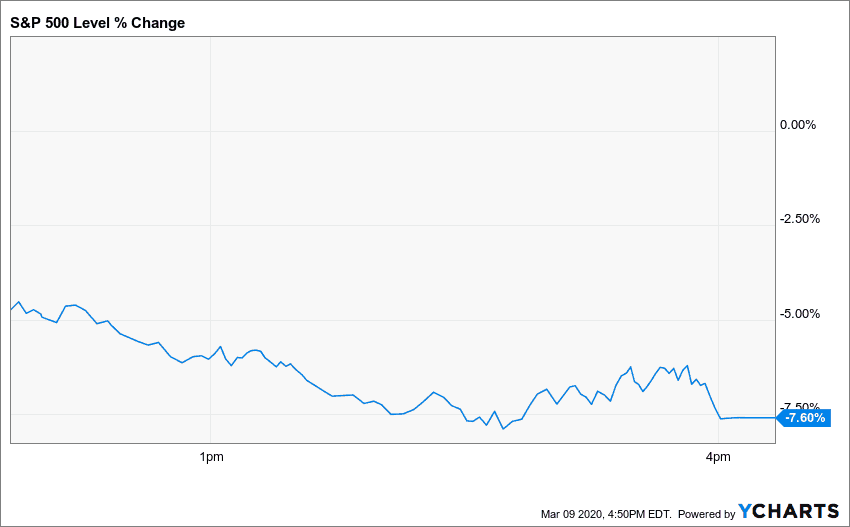
Nevertheless, upon re-opening, the S&P 500 continued to accumulate losses throughout the day and closed down 7.6% with the Dow closing down over 2,000 points:
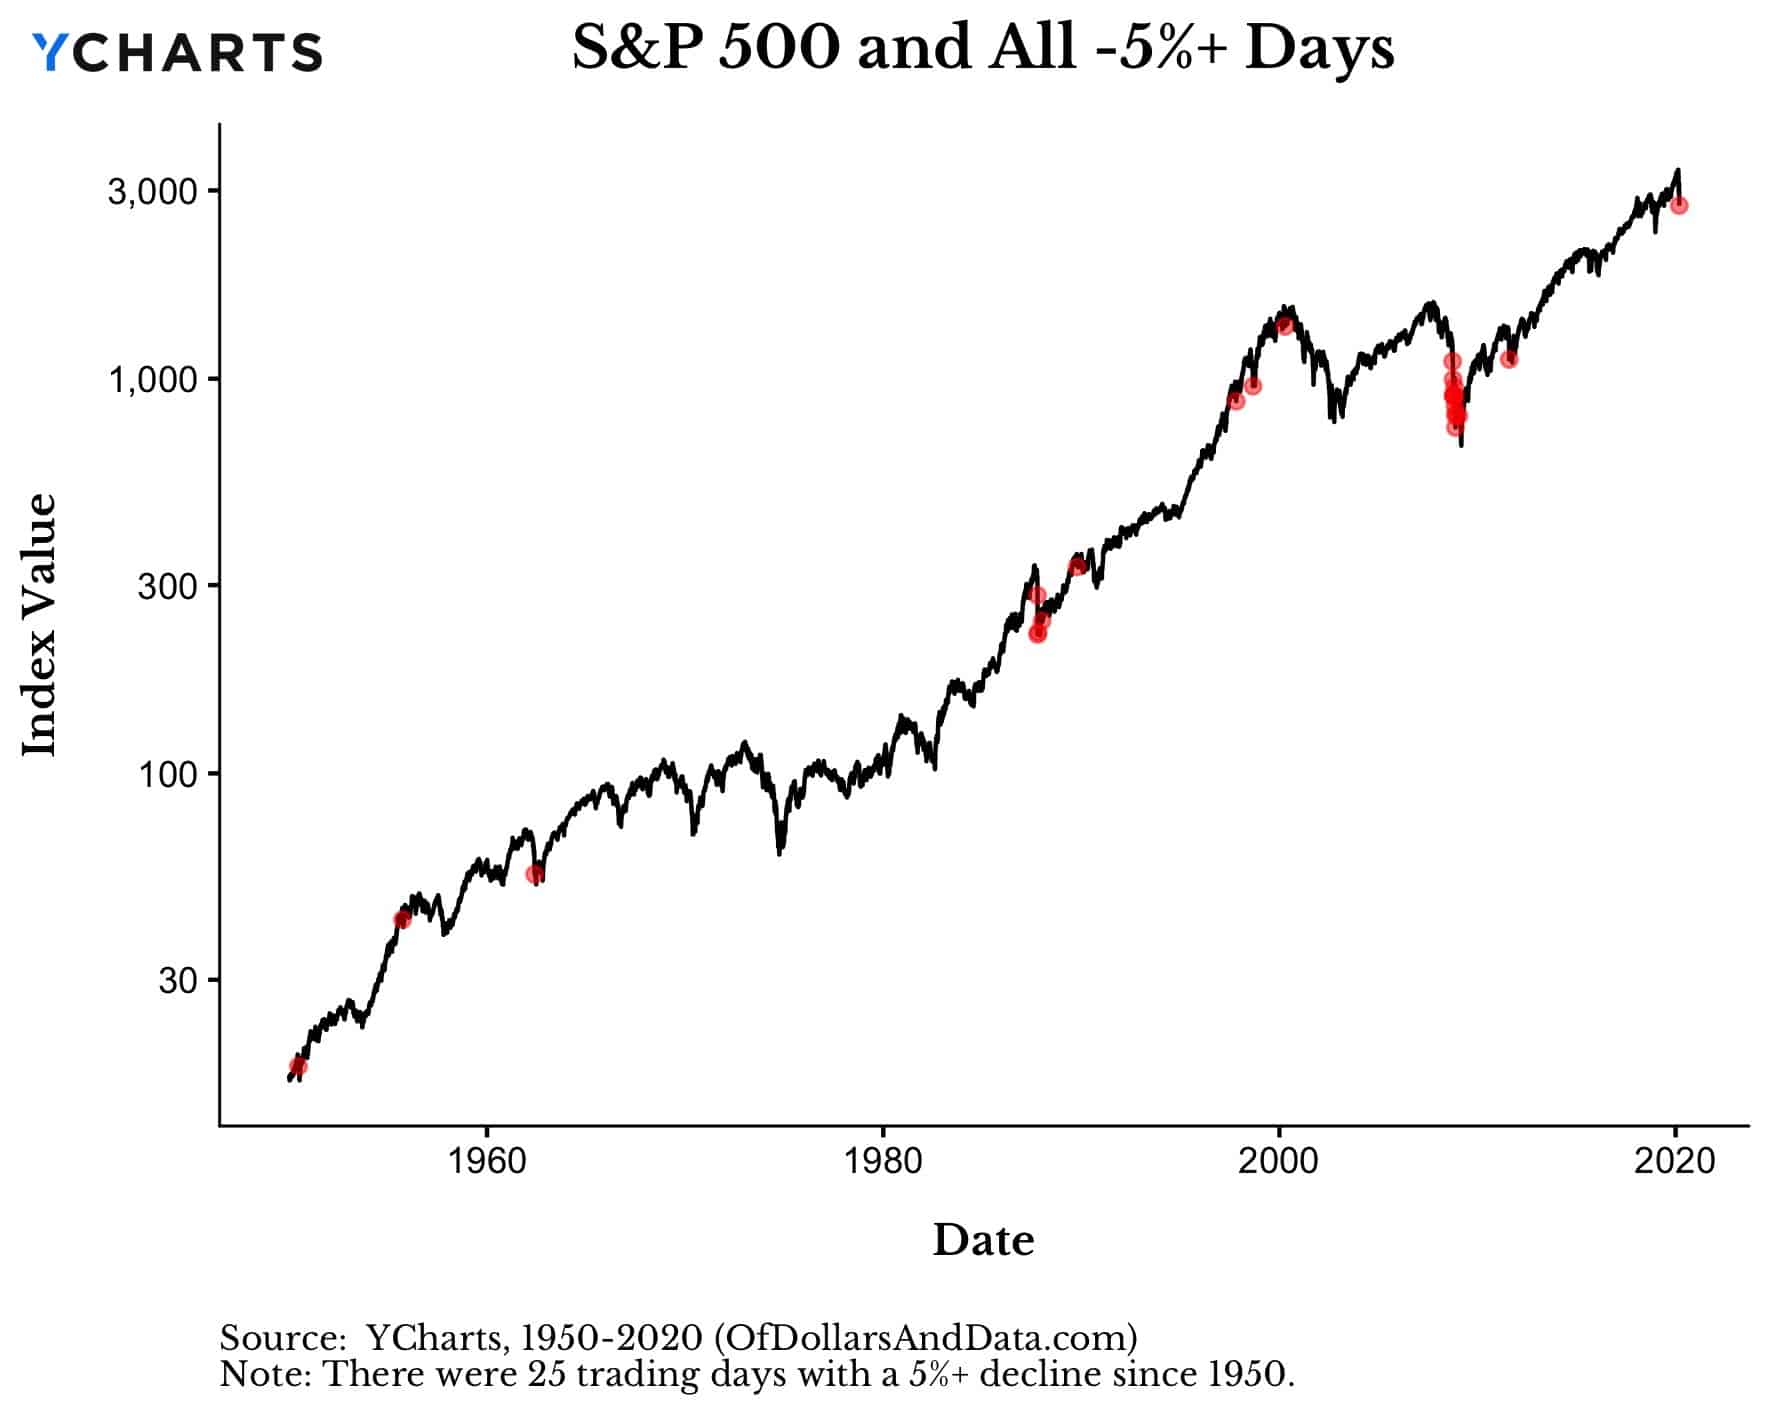
Since 1950, the S&P 500 has closed down more than 5% in a single session on only 25 other occasions:
And 3/9/2020 was the 7th worst session over this time period:
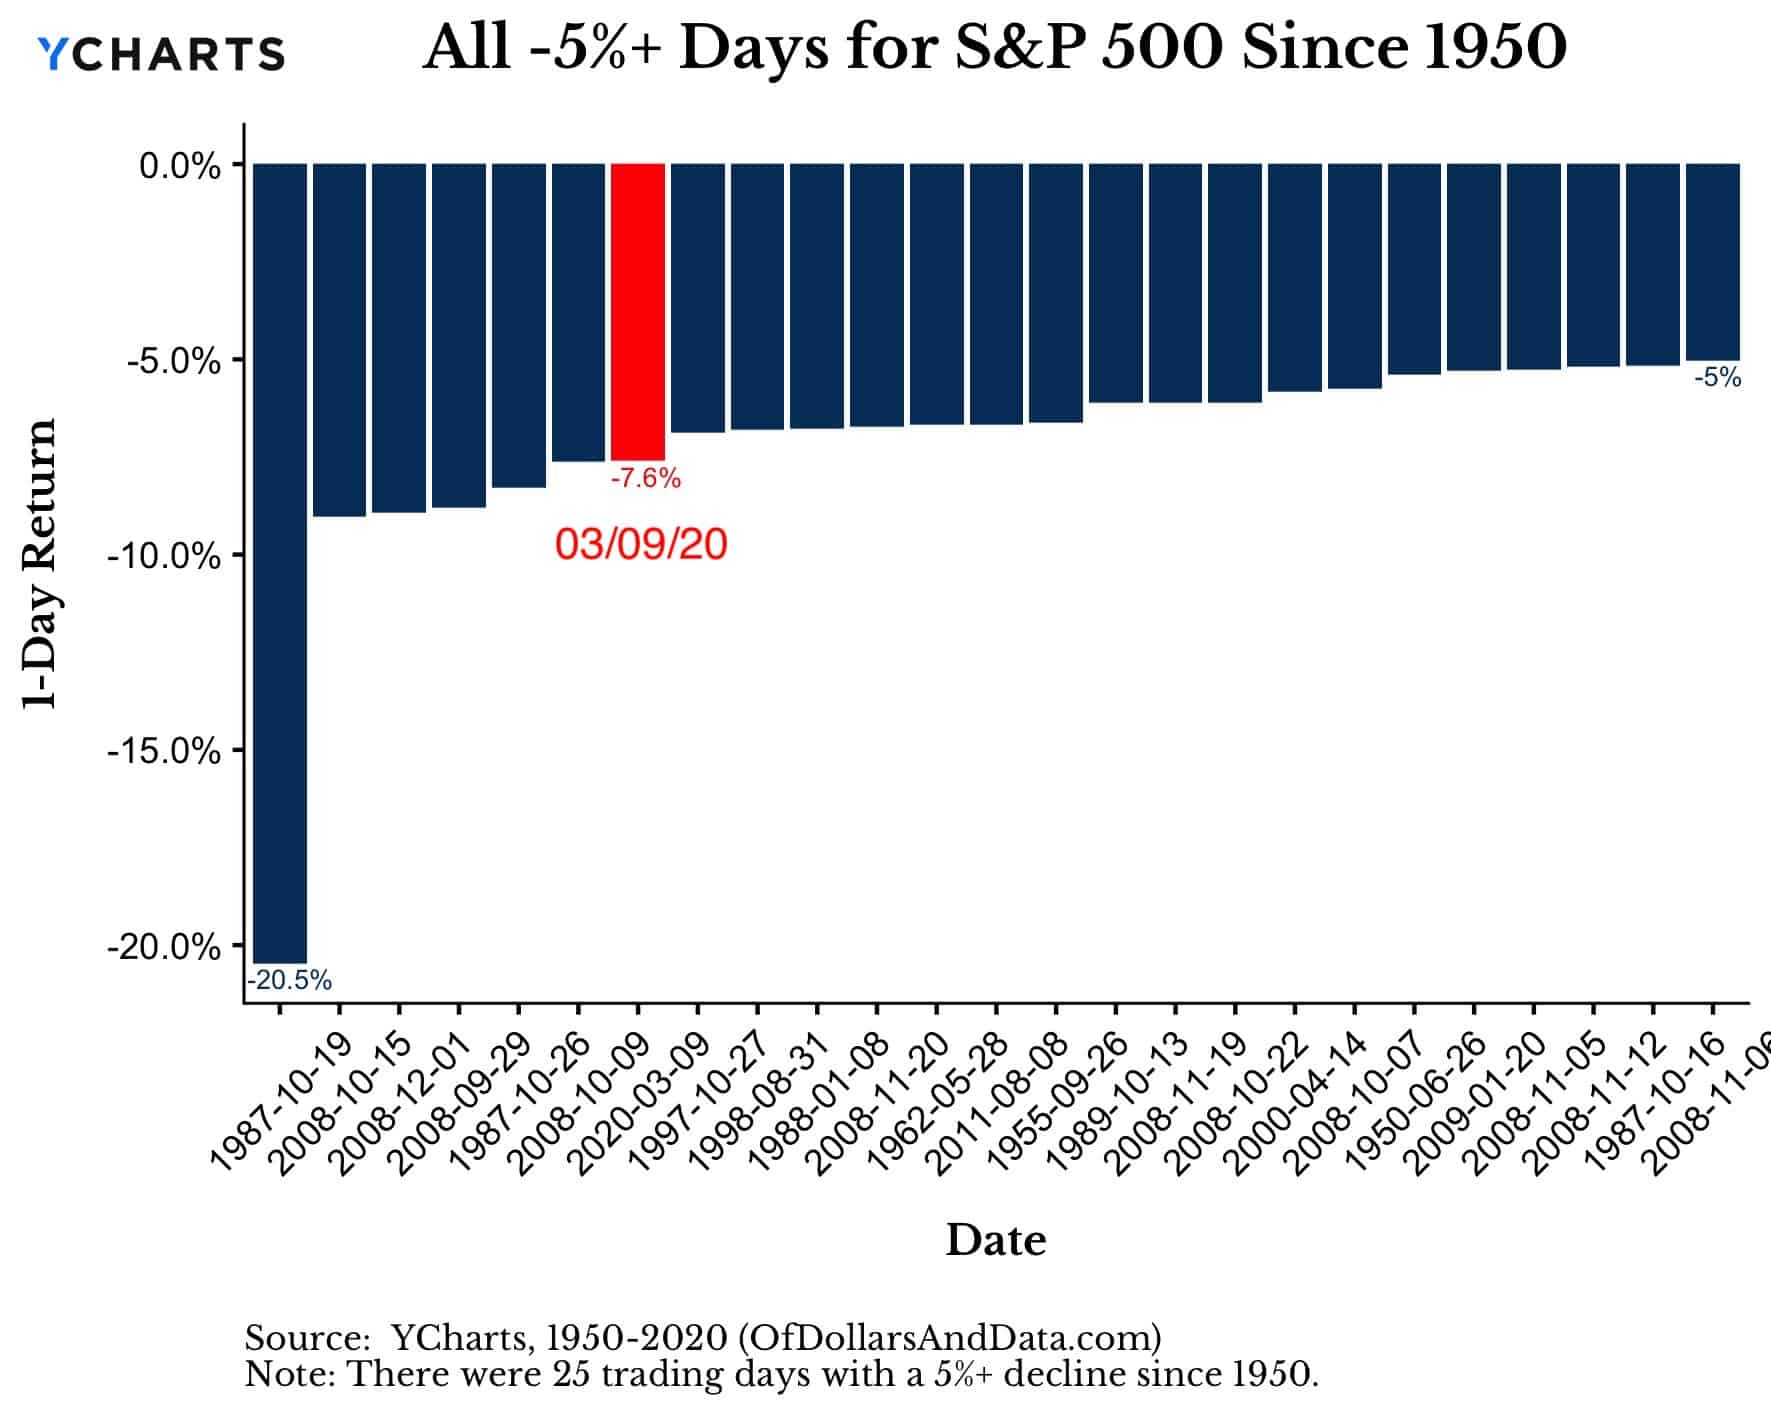
While this was only the 7th worst daily return since 1950, for many of us, March 9, 2020 was the worst investment day of your lives.
You might be thinking, “But Nick, what about 2008?”
Yes, 2008 did technically have 4 individual days that were worse than 3/9/20 on percentage terms. However, in absolute dollar terms, almost every single person reading this sentence lost more money on 3/9/20.
How do I know this?
Because unless you retired before or shortly after 2008 and started taking sizable withdrawals, you have only seen the market (and likely your portfolio) increase in value over the past 12 years. You very likely have more skin in the game now than you did back then.
For example, when the markets collapsed in September and October 2008, I wasn’t worrying at all. Why? Because I was a freshman in college and had no assets to my name.
But, that isn’t true anymore. Monday, March 9, 2020, made those record losses that I have read about for so long, come alive.
And now, for the first time, I am starting to understand why you can’t just tell people “Don’t panic because the market usually recovers.” Because reading about -7% days on paper or watching them on TV as a teenager isn’t the same as feeling the hurt in your pocketbook.
As Fischer Black brilliantly stated:
Markets look a lot less efficient from the banks of the Hudson than from the banks of the Charles.
This is the difference between financial theory and financial reality. When backtests become bankruptcies and simulations turn into suffering, you start to understand the nature of investing in a far more intimate way.
And though I lived through the 19% drawdown in December 2018, this time, dare I say it, feels different.
I have a good friend who may have to cancel his wedding in South Korea and another friend who probably won’t get to present his doctorate research at a medical conference scheduled to happen in Italy later this year. I feel terrible for both of them.
When I’m out in public in New York City, I am constantly in a state of worry. Does that person have the virus? Maybe they do? It’s madness that is all-consuming.
And, on top of all of this, my portfolio losses are starting to mount, in what Michael and I discovered is, the fastest bear market ever. Though the S&P 500 is down about 19% right now, my portfolio is only down about 12% (Thanks bonds!).
So, whether you started investing in 2012 (like me) or 1995 or 2015, you are probably feeling this one a lot. And I am right there with you.
Because the past is defined by the present. And, right now, for many of us, the present feels more real than 1929, -37, -74, -87, -97, 2000, or 2008 ever did.
The Rightful Owners
There’s an old saying that goes:
In bear markets, stocks return to their rightful owners.
With the financial reality that has been thrust upon us so recently, I hope you take this statement to heart, especially if things get worse in the coming months.
And though things could get worse, after a -5%+ day, the S&P 500 is usually up over the next year:
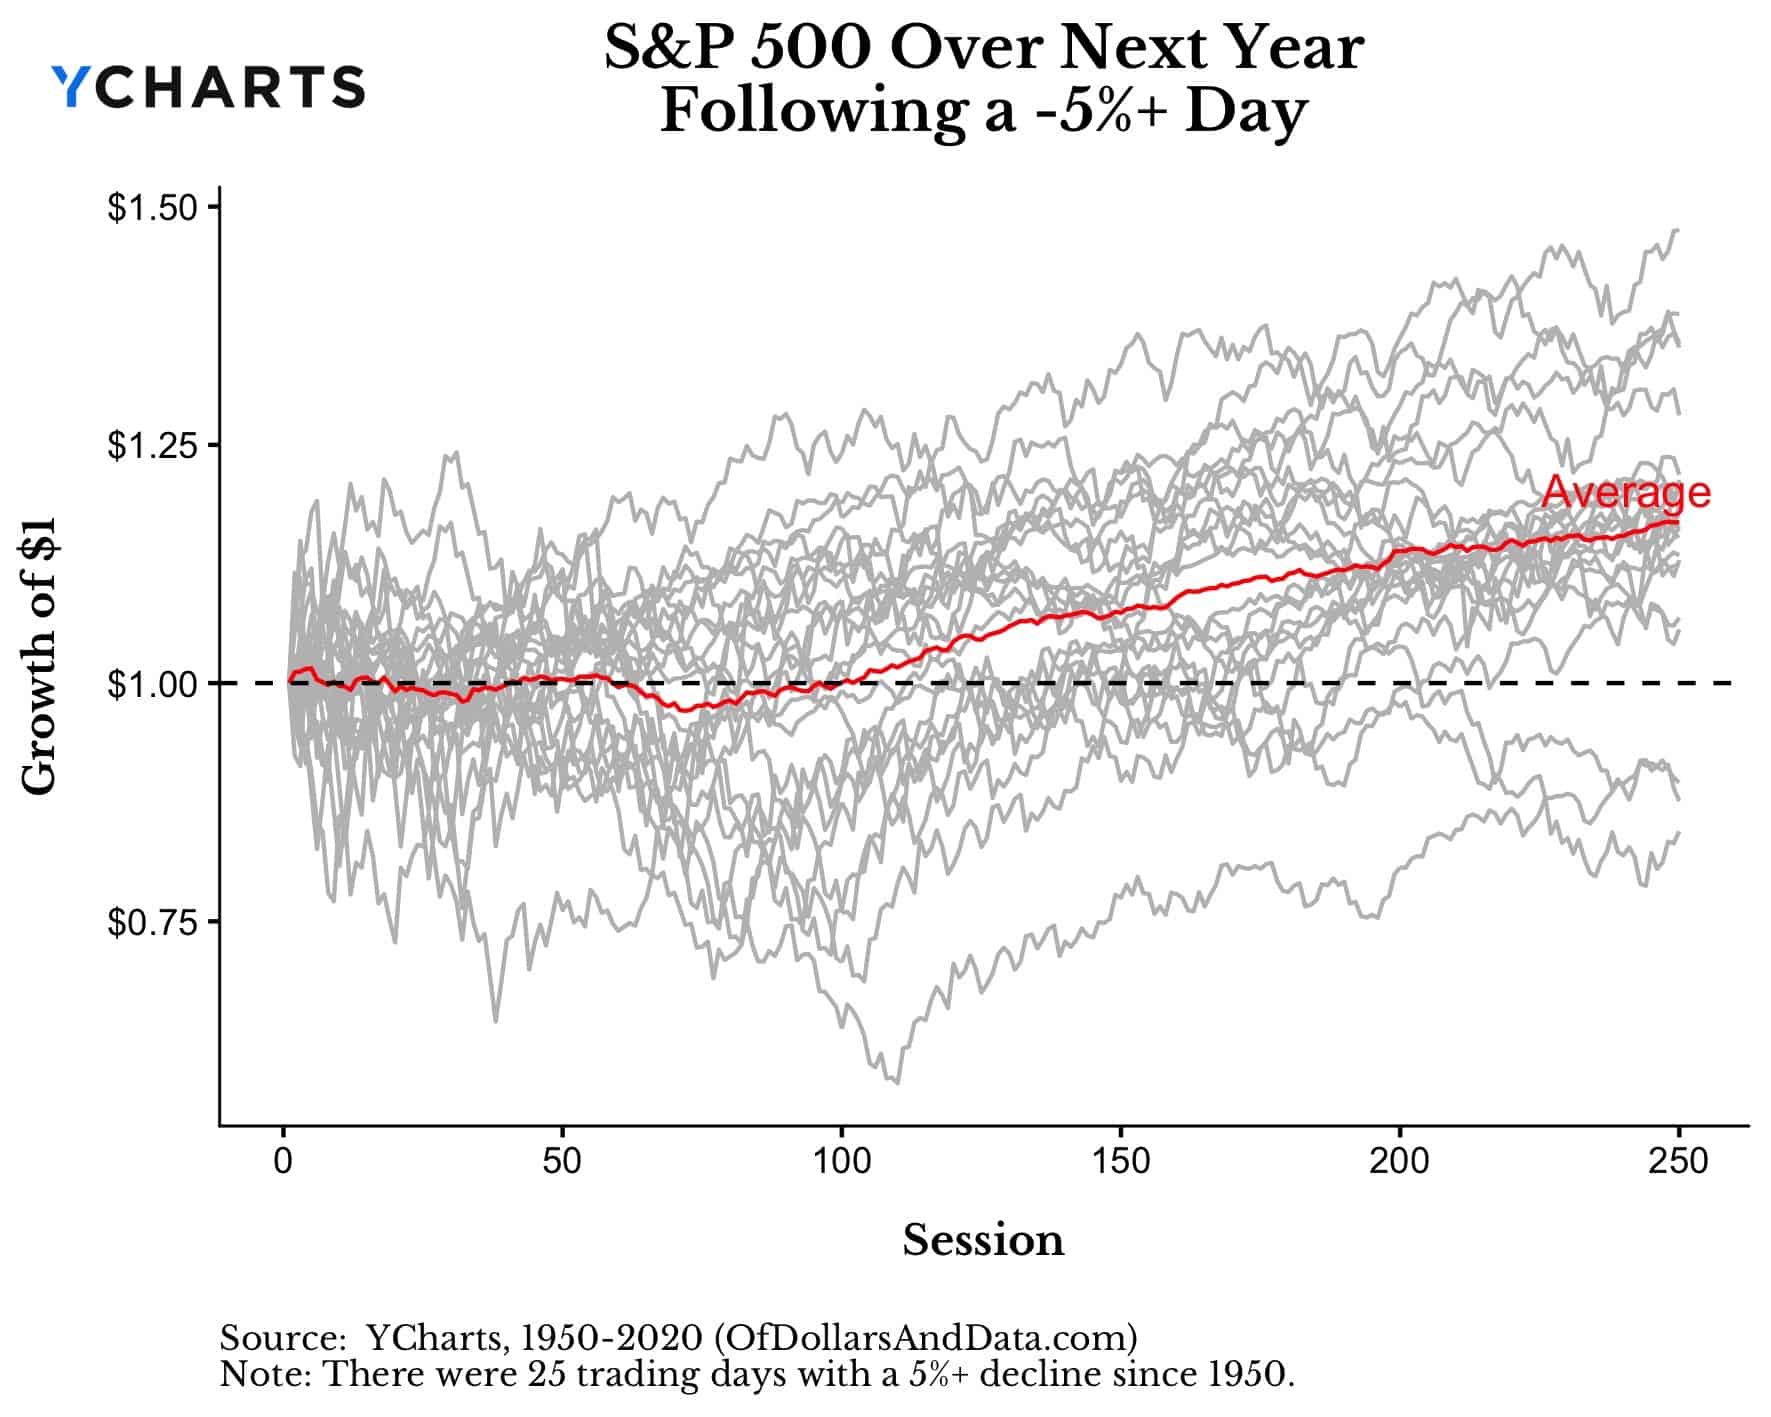
You can look at this chart and decide to sell everything, or you can take your chances in becoming one of the rightful owners. Choose wisely.
Stay safe out there and thank you for reading!
If you liked this post, consider signing up for my newsletter.
This is post 168. Any code I have related to this post can be found here with the same numbering: https://github.com/nmaggiulli/of-dollars-and-data

