Unless you’ve been living under a rock, you already know that the stock market has been dropping, and badly.
Over the last 2 sessions, the S&P 500 erased more than 6.2%, which is the most over any 2-day period since the flash crash of August 2015. And the last time before that was back in 2011.
But, without historical context, this doesn’t mean anything. So, what happens next?
Of course, no one truly knows, but history may provide some guidance.
Since 1950 there have been 34 instances where the S&P 500 was down by more than 6% over its prior two sessions. Considering that there are 17,655 two-day trading sessions over this time period, we have only seen trading activity this severe (or worse) on 0.2% of all trading days, or once every 2 years, on average.
So, yes, the sudden drop we experienced over the last two days is quite rare. Maybe the economic impact from coronavirus is greater than most people originally assumed, but who knows?
Nevertheless, for those 34 trading days where the S&P 500 was down by more than 6% over its last two sessions I wanted to know, “What happens next?”
Well, it depends on what time scale you look over.
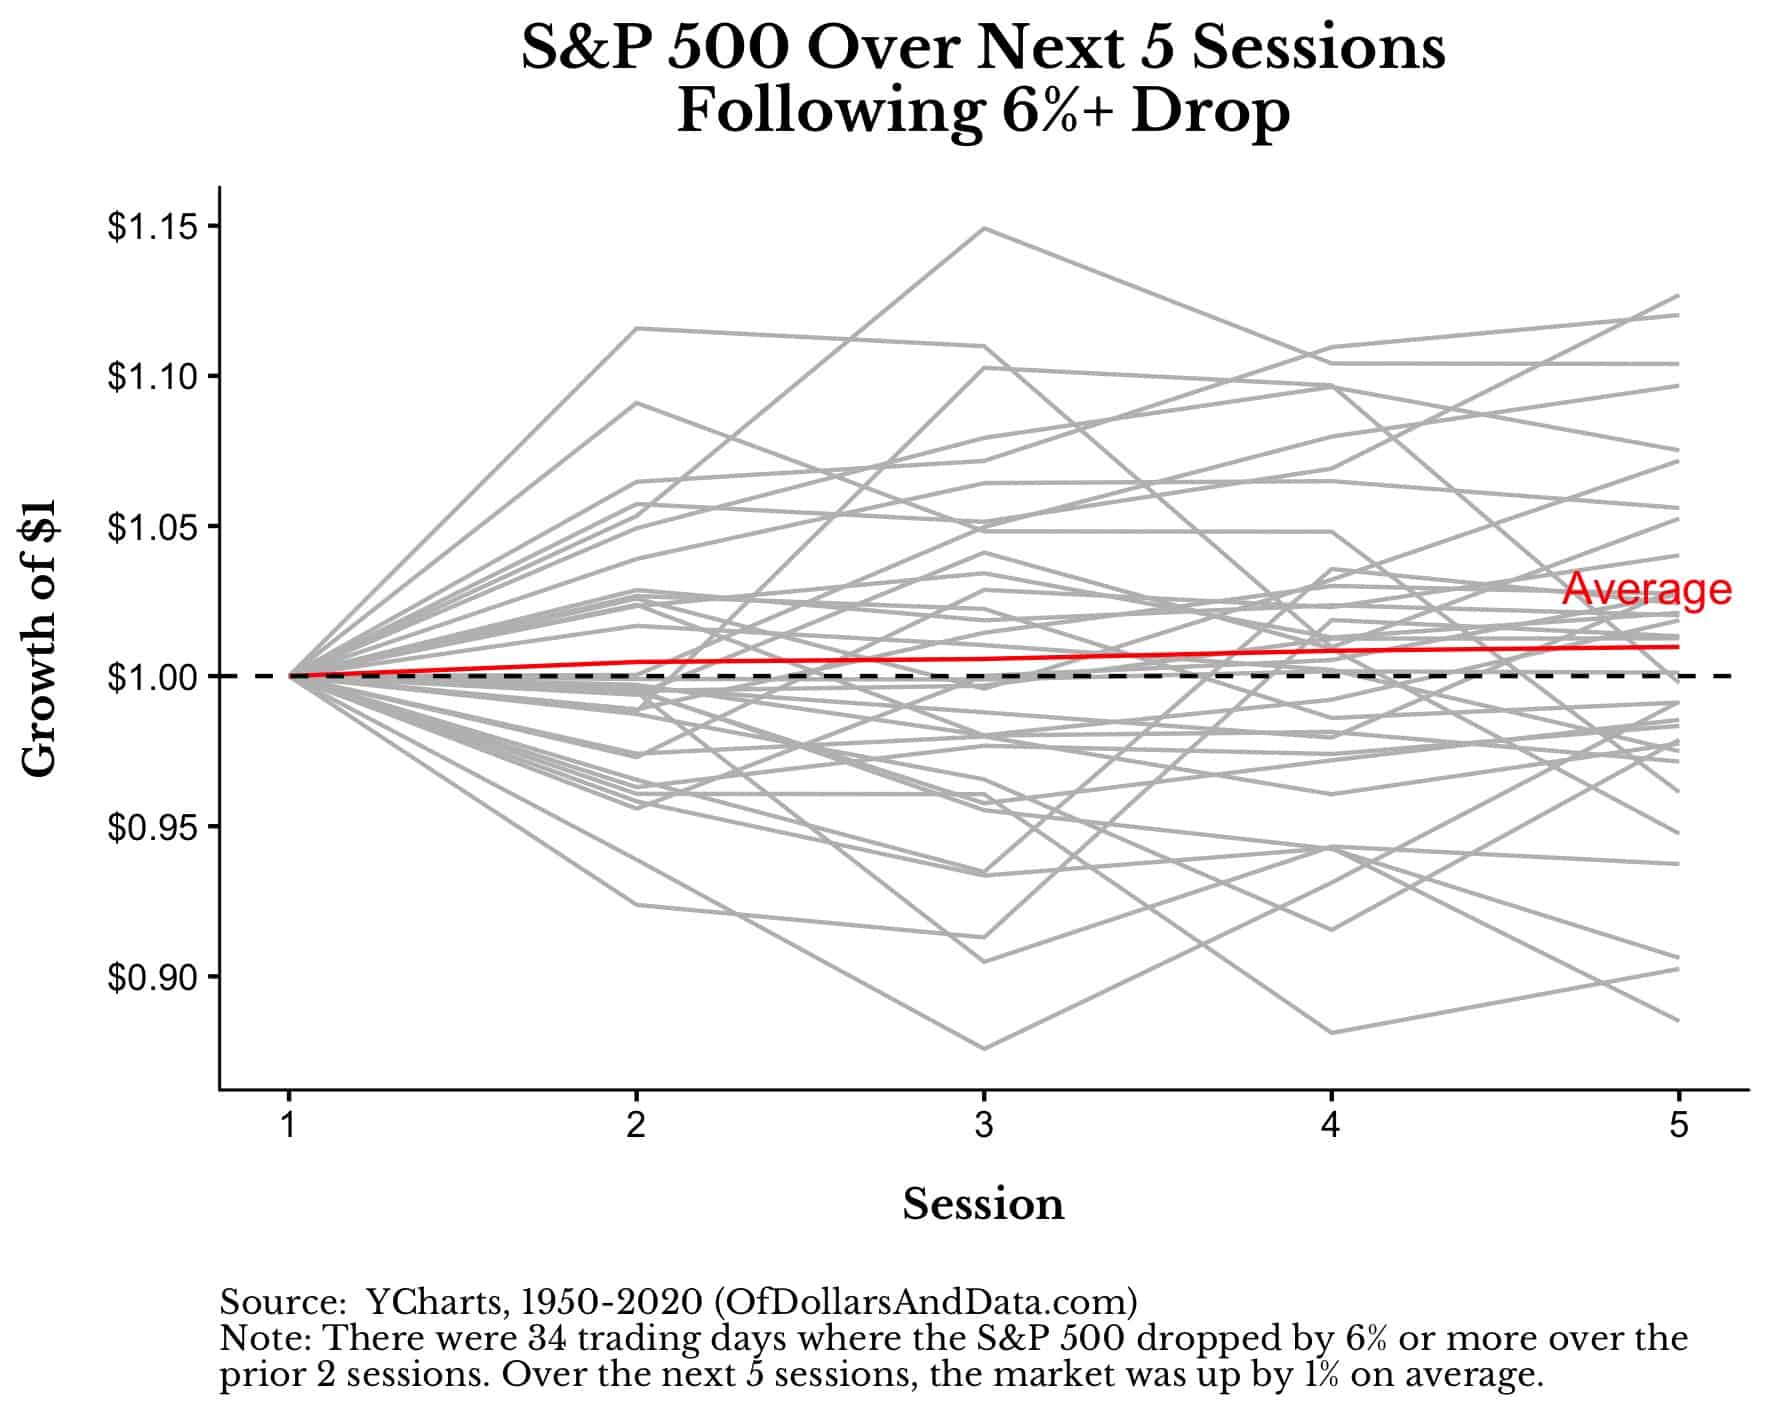
For example, over the next 5 sessions (i.e. 1 week), the market was up by 1% on average, but the 5-session performance ranged from +12% to -12%:
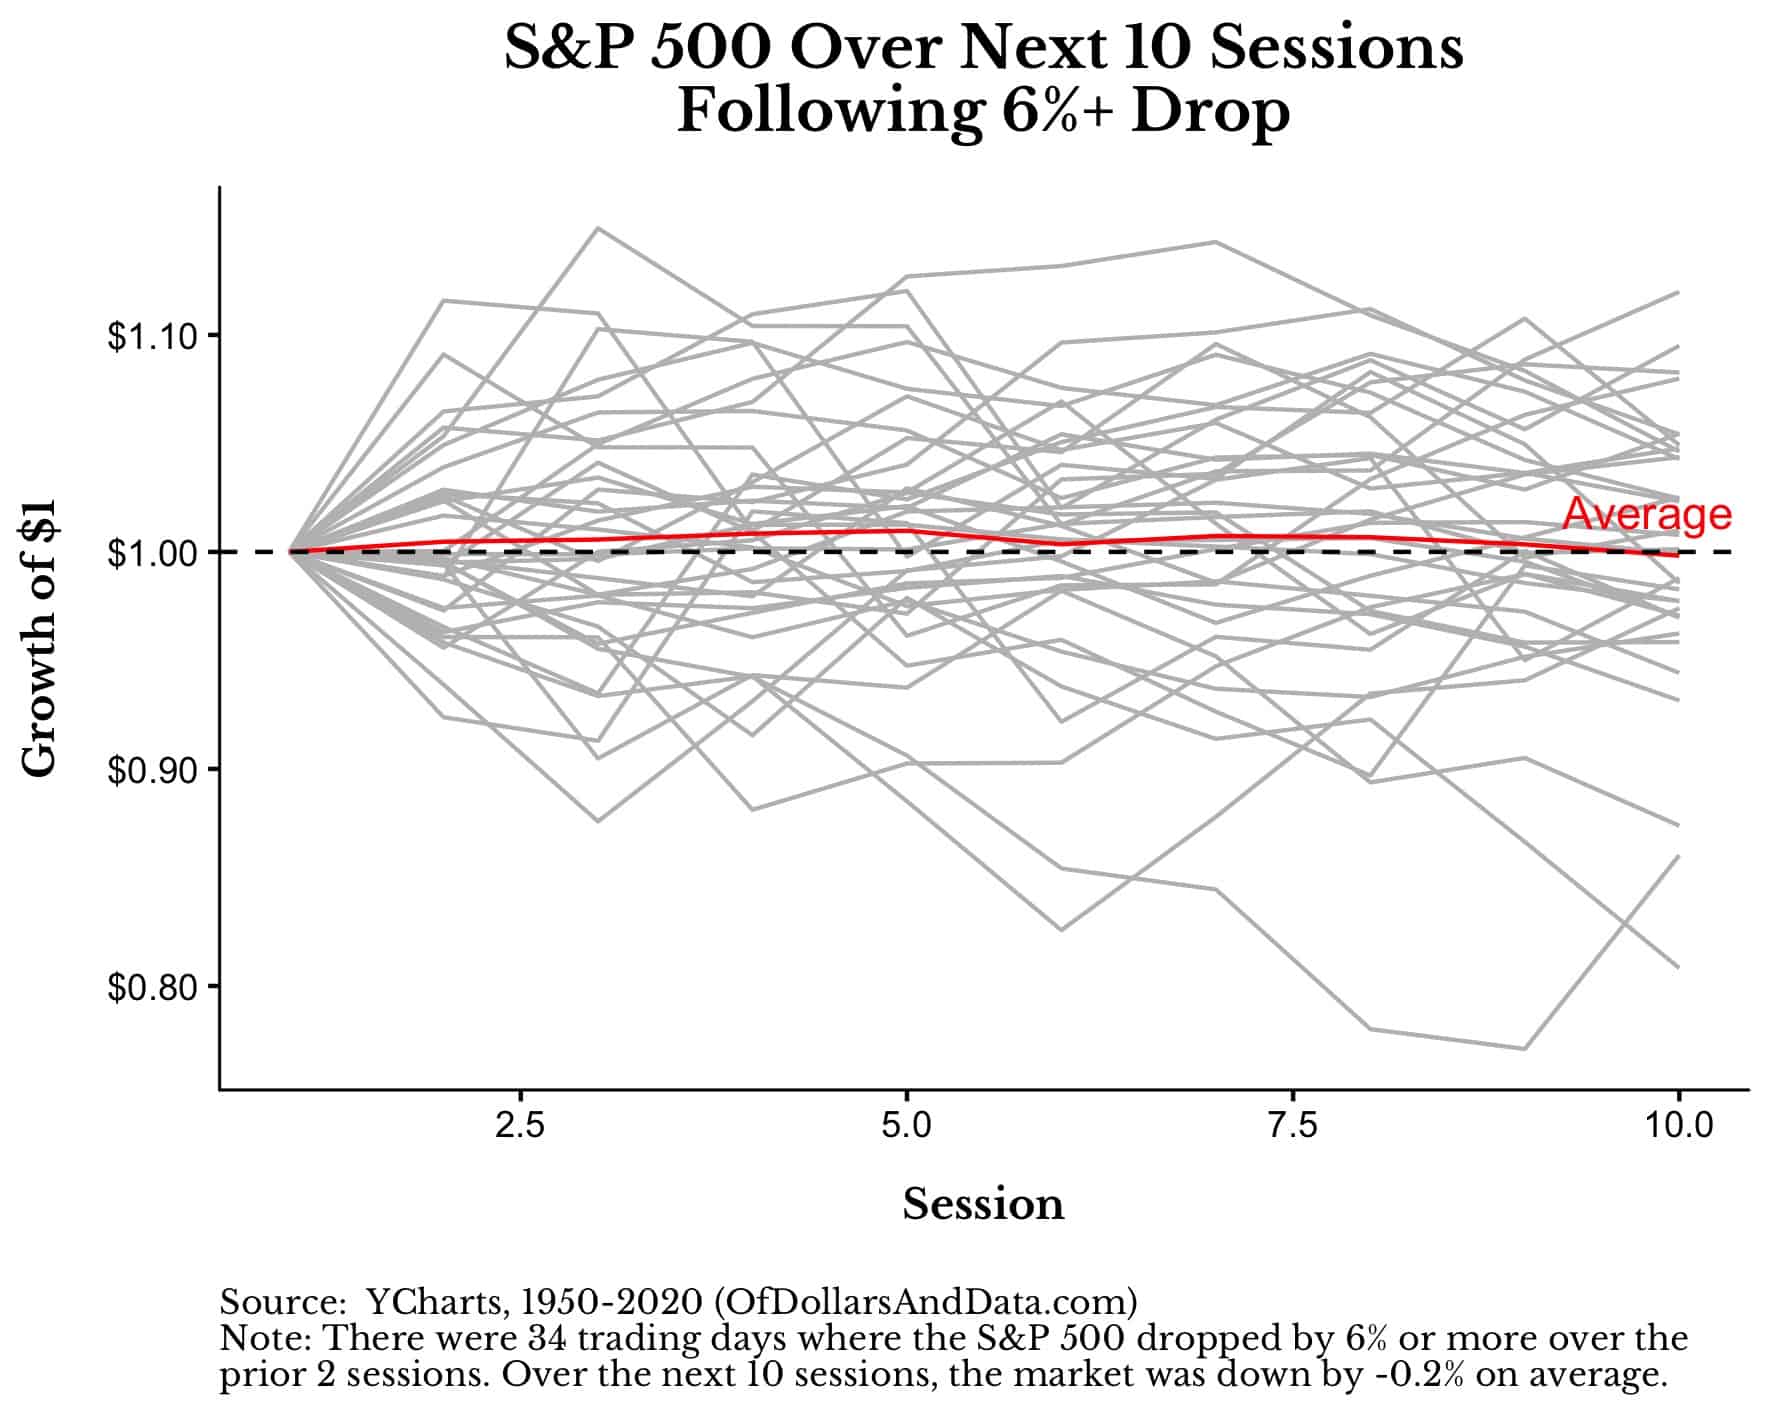
Over the next 10 sessions (i.e. 2 weeks), the market was down 0.2% on average, with far more downside variation than upside variation:
However, over the course of the next 250 trading days (i.e. 1 year), the S&P 500 was up by 16.7% on average:
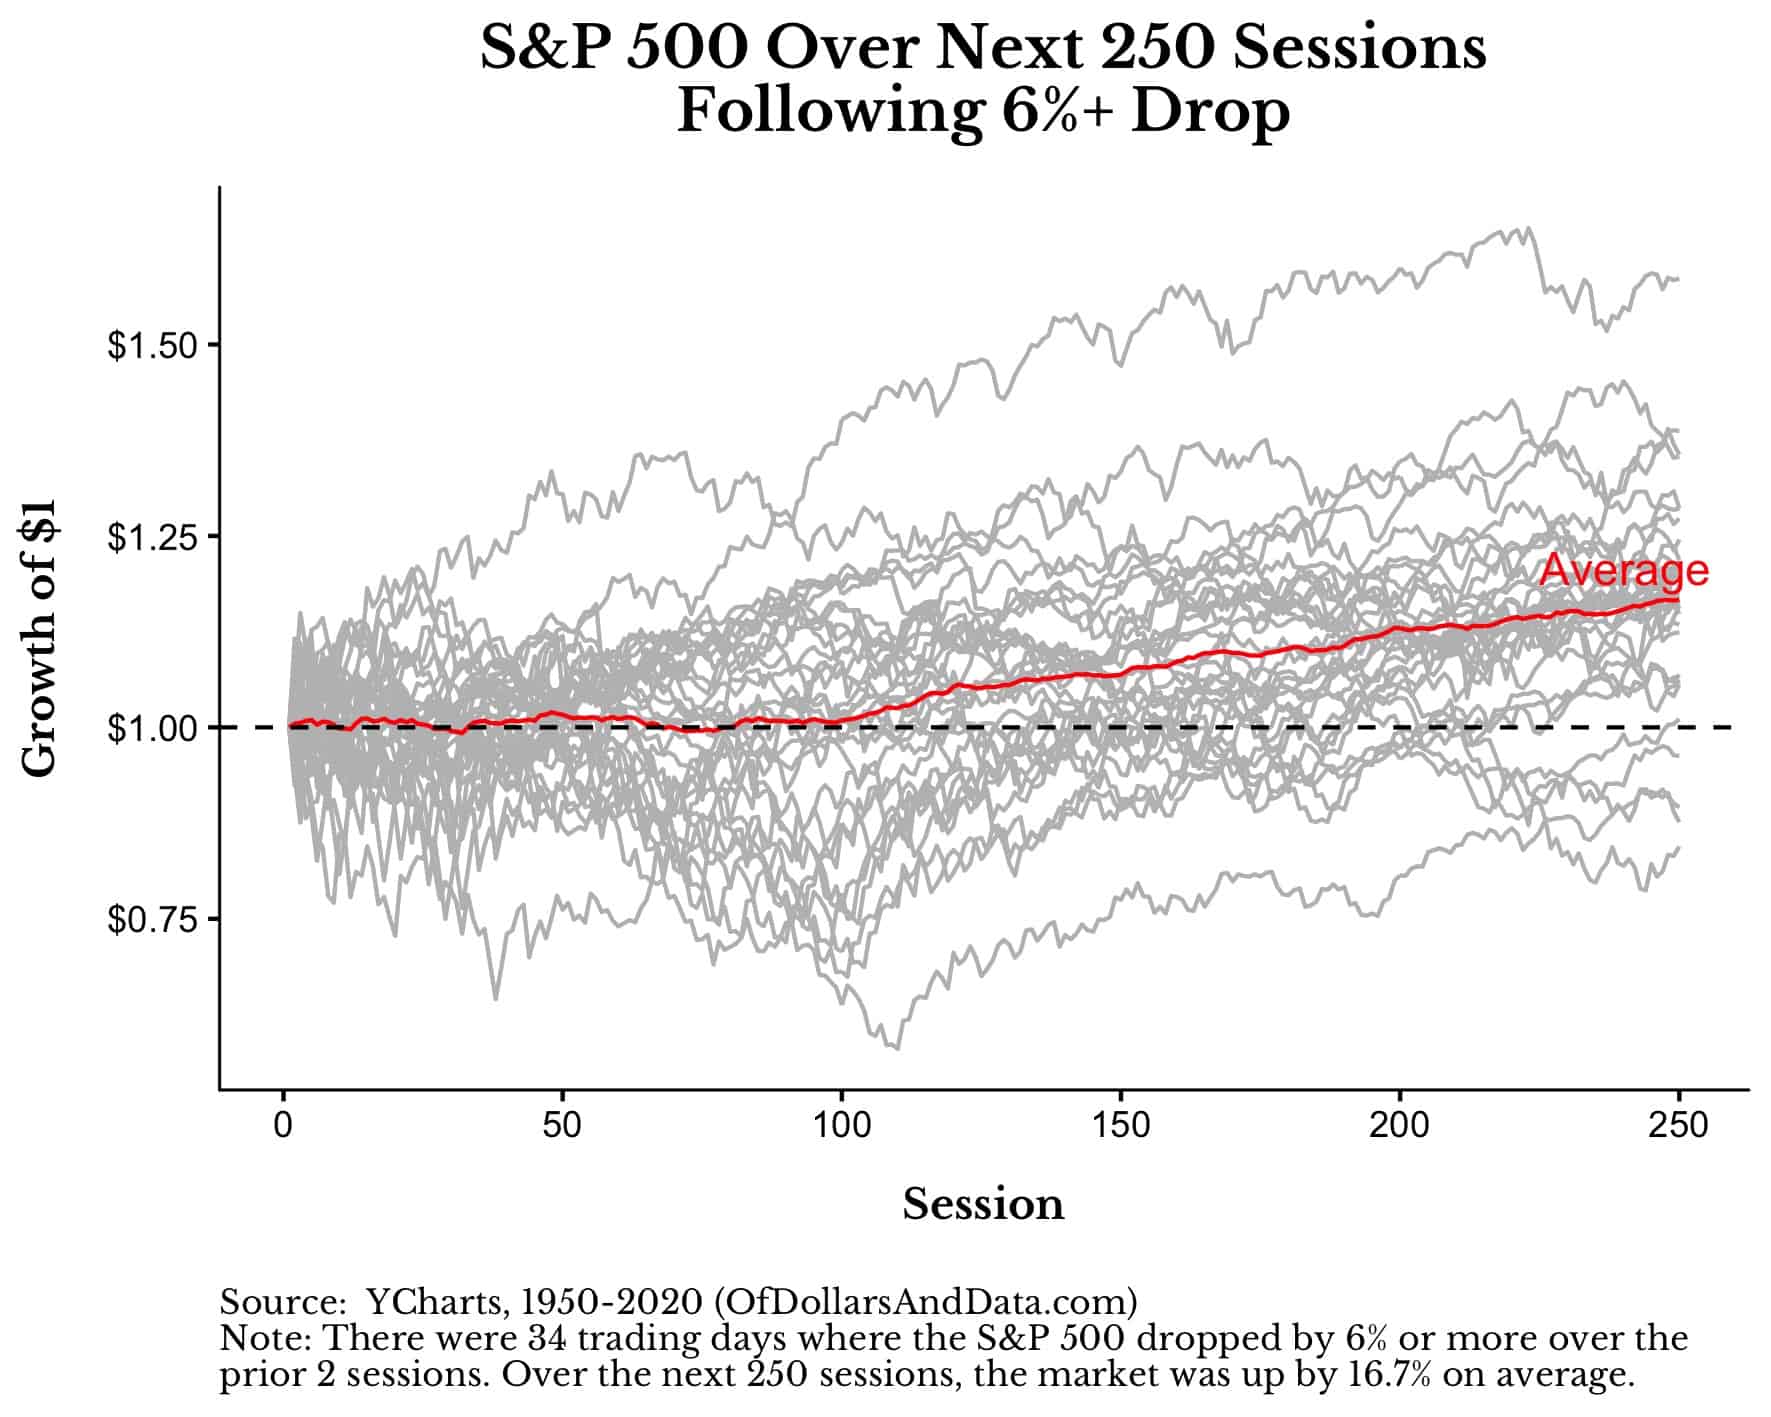
This chart is particularly useful because you can see that the S&P 500 didn’t break out of its panic-induced slump (on average) until about 100 sessions later.
More importantly though, of the 34 gray lines on the chart above, I count only 4 that had lost money 1 year after their large two-session decline.
You can see this more clearly by looking at the chart of the S&P 500 with these 34 trading days highlighted in red (note that the y-axis is a log scale):
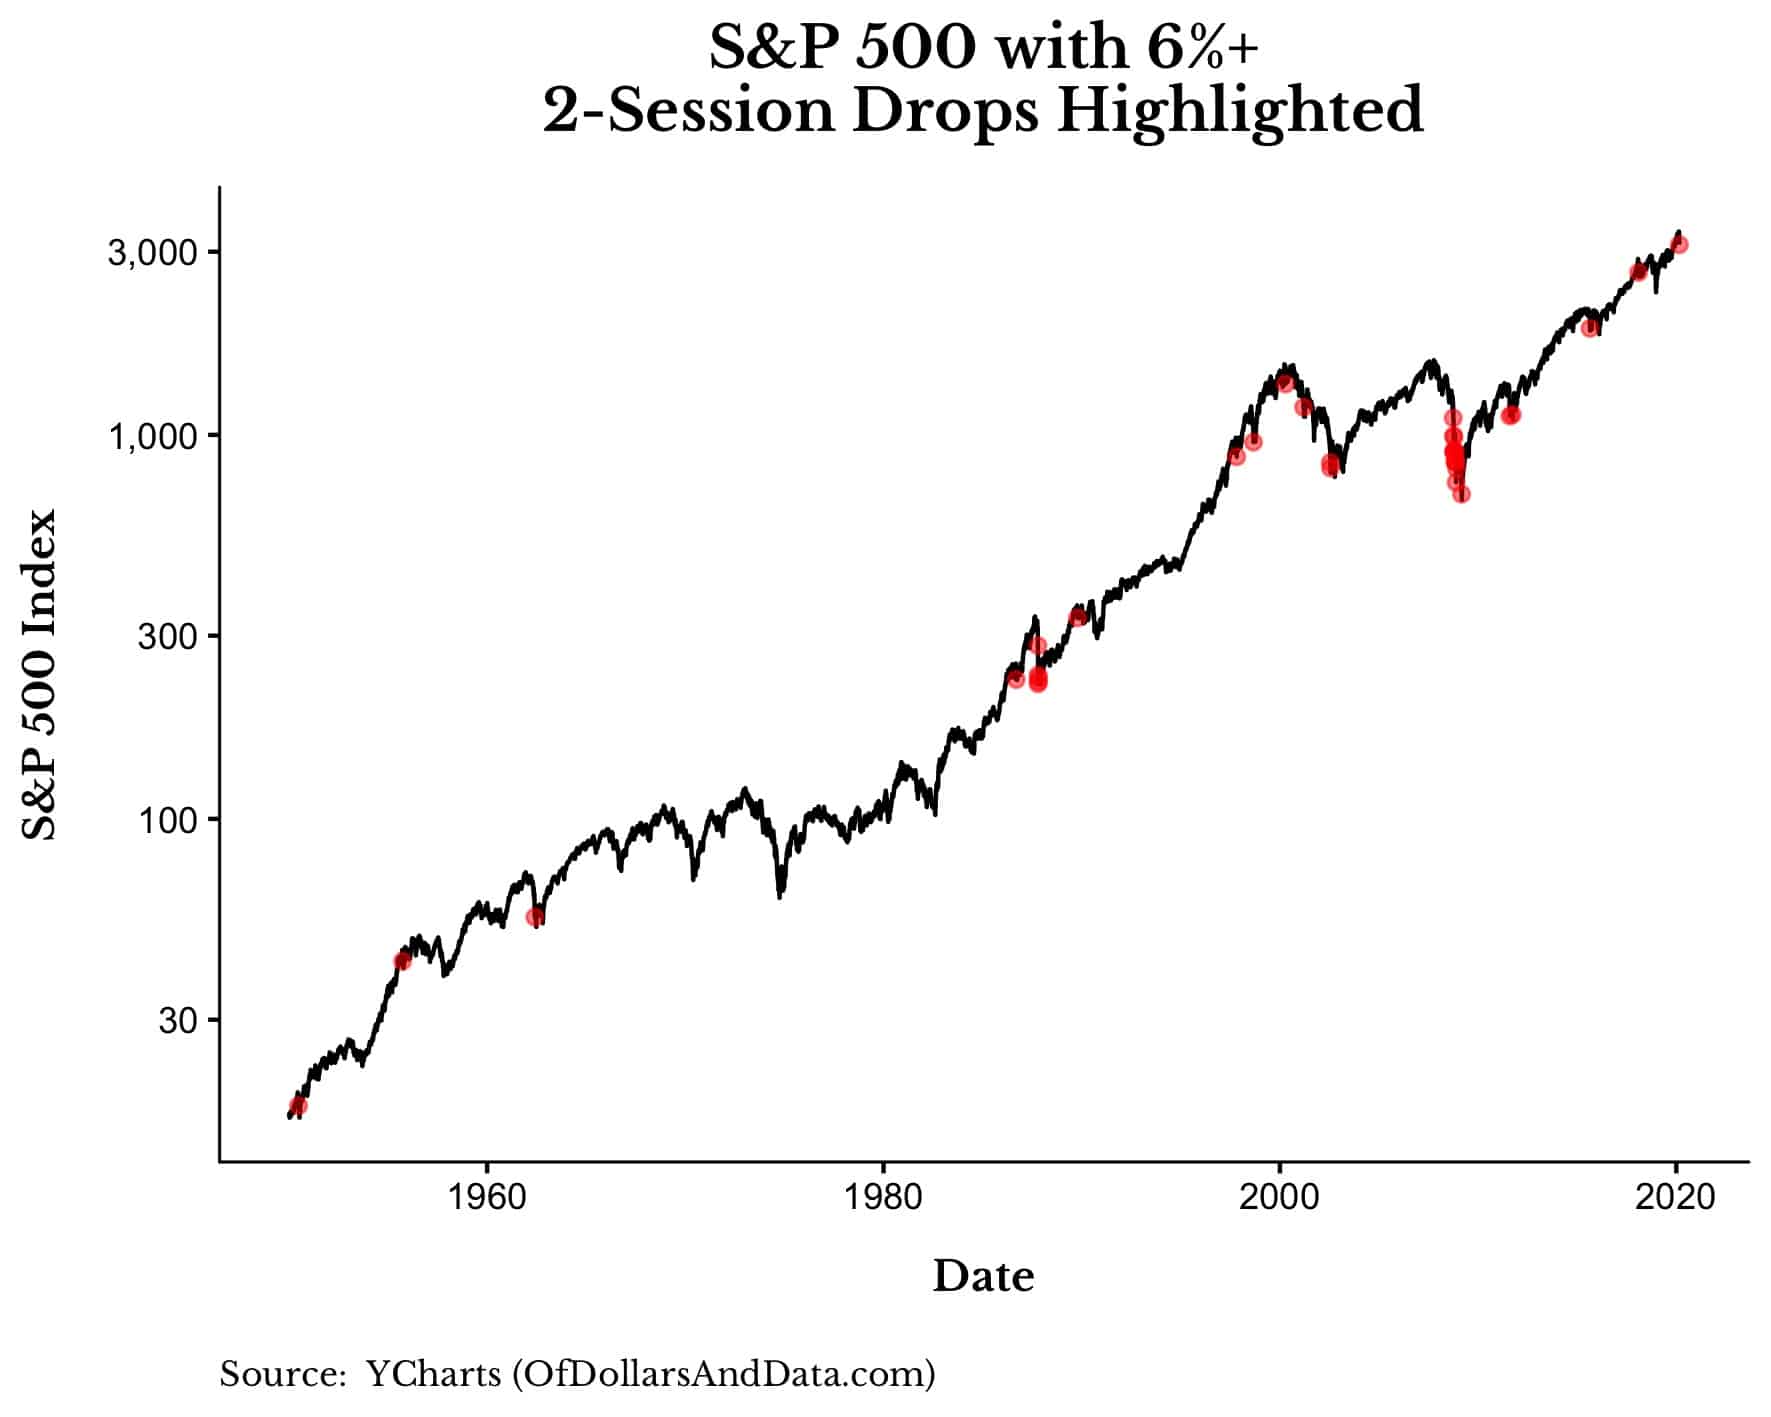
There are two big things to takeaway from this:
- Many of the highlighted dates above are not followed by a major market decline.
- There are a few big clusters of these large 2-session drops, most notably in 1987 and 2008.
Point 1 is good news for investors, but point 2 is quite bad news. Point 2 is bad news because, of the 34 large 2-session declines highlighted above, over half of them occurred in 1987 or 2008 (with most being in 2008).
This is why a little market fear can turn into a lot of market fear very quickly. It’s not the 6% drop that worries investors, but what happens next. As my colleague Michael Batnick so beautifully stated:
Every time stocks fall a little, there’s always a possibility they fall a lot.
And it is the “falling a lot” that makes some investors run for the hills though no real danger is in sight. Yet, I’d argue that this behavior is completely rational.
Because these skittish investors see volatility and say to themselves, “I’ve seen this before and I know how it ends. I’m getting out of here.”
Unfortunately, many times this reaction ends up being misplaced as these fearful souls sit in cash while the market continues its march upward. However, these cautious capitalists will eventually be right.
But, after being right and avoiding a 2008 (or similar scenario), do you think these investors will be able to jump back into the markets so easily? Of course not.
Because after sidestepping a downturn, they probably never thought to ask themselves: what happens next?
This Time is Different?
For the last 164 weeks in a row I have posted every Tuesday on Of Dollars And Data. But, this is the first time I have ever posted outside of this schedule.
With friends blowing up my phone asking about the markets and my Dad claiming that he “bought the dip,” I thought an emergency post was warranted. Maybe this time is different. Or maybe my emotional side is just getting the better of me.
Either way, I have absolutely zero plans to make changes to my allocation. Because investing isn’t about what happens next, but what happens after that.
Thank you for reading!
If you liked this post, consider signing up for my newsletter.
This is post 165. Any code I have related to this post can be found here with the same numbering: https://github.com/nmaggiulli/of-dollars-and-data

