It was 1949 and Fred Charles Iklé wanted to know why some European cities had been abandoned during World War II while others survived. While traveling through war-torn Germany, Iklé discovered that the city of Hamburg was still inhabited despite losing 3.3% of its population and half of its homes to Allied bombing raids.
Iklé realized that Hamburg, and other cities, were able to persevere because its residents crowded together as they faced waves of destruction. However, this only worked…to a point. Command and Control tells of Iklé’s startling revelation:
Iklé was impressed by the amount of urban hardship and overcrowding that people could endure. But there were limits. The tipping point seemed to be reached when 70 percent of a city’s homes were destroyed. That’s when people began to leave en masse and seek shelter in the countryside.
Iklé’s research illustrates how systems can exhibit radical changes in behavior from seemingly small changes in environmental conditions. When 65% of local homes were in ruins, people clung to hope. By 70%, they fled.
This phenomenon, known as a tipping point, has been documented in biological and non-biological systems throughout the world. For example, zoologists discovered that the aggressiveness of certain spiders is dependent on environmental temperature and Science magazine recently published a study showing how at least 25% of people need to take action for social change to occur.
Malcolm Gladwell’s book by the same name, describes the defining characteristics of tipping points:
These three characteristics—one, contagiousness; two, the fact that little causes can have big effects; and three, that change happens not gradually but at one dramatic moment—are the same three principles that define how measles moves through a grade-school classroom or the flu attacks every winter.
We can find these same principles at work within financial markets as well.
Just consider how Bitcoin rose from $10,000 to nearly $20,000 a coin in less than 3 weeks or how the Dow Jones lost 22.6% in a single day:
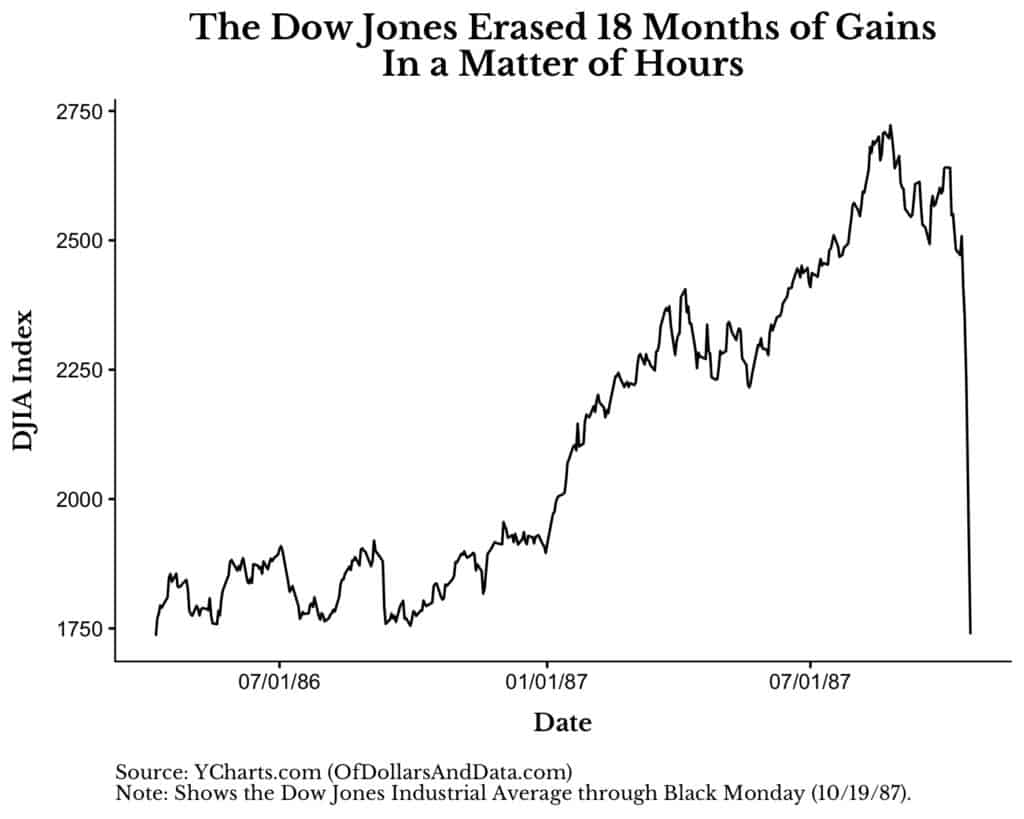
What caused such a massive decline? Some say it was portfolio insurance and the rise of programmatic trading, but no one knows for sure.
While we may not be able to identify a single tipping point for large changes in asset prices, there is one tipping point that you should know better than the rest—your personal selling point.
What do I mean by this? Consider your current net worth (all of your assets minus all of your liabilities). What number would your net worth have to reach, as a result of a market crash, for you to give up all hope and sell your equities?
I ask this question because I used to believe that there was no number at which I would give up hope and sell stocks. Markets always recover, right? At least in the U.S. this has been true.
But, as I thought about it more, I realized that there is some psychological number in my head at which I would not be okay. After doing a simple calculation (tipping point/current net worth – 1) I realized that I would need to see a portfolio decline of 63% across my total portfolio before I truly panicked.
With my current allocation this would require ~70% decline in stocks to occur. Given this has only happened once in U.S. history, I am not too worried.
So, where is your tipping point? The fictionalized character Russ Hanneman in HBO’s Silicon Valley reached his tipping point when he went from a billionaire to a millionaire and lost his status as a member of the Three Commas Club.
All jokes aside, things like this matter. You might have $1.3 million in a retirement account at age 65 and feel great, but a 30%+ decline and you are no longer a “millionaire.”
That psychological re-labeling of your identity might be enough to force you to sell. It is things like this that you have to consider in addition to your other financial goals and liabilities when you consider your financial tipping point.
Don’t Forget the Upside
While it can be a useful exercise to think about how much you would need to lose for you to panic, it is equally useful to think about the opposite question:
How much money would you need to gain for you to feel secure?
Be realistic and think at what level you could de-risk your portfolio and not worry anymore. Now, write this number down somewhere where you can refer to it later.
It is important to write this down because there is plenty of evidence that people will revise their number upward as they approach their original goal. The hedonic treadmill is a tempting one.
While $1 million might make you happy now, you might see the people with $2 million and start chasing that. This is why knowing your lower and upper tipping point are so important for your psychological and financial well being.
Don’t take my word for it though. Consider the lesson, which I have told before, from Joseph Heller, the famed author:
At a party given by a billionaire on Shelter Island, Kurt Vonnegut informed his pal, the author Joseph Heller, that their host, a hedge fund manager, had made more money in a single day than Heller had earned from his wildly popular novel Catch 22 over its whole history. Heller responds, “Yes, but I have something he will never have . . . Enough.”
If you want to learn more about tipping points, I highly recommend The Tipping Point by Malcolm Gladwell. It is a fun, easy read that illustrates how dramatic shifts in culture, biology, and policy can be more art than science. Thank you for reading!
If you liked this post, consider signing up for my newsletter.
This is post 94. Any code I have related to this post can be found here with the same numbering: https://github.com/nmaggiulli/of-dollars-and-data

