


With the massive selloff in the S&P 500 last week, the market is now 17.6% off of its February highs. As a result, it’s the perfect time to examine how long U.S. stocks typically take to recover from such a decline.
Knowing this information can help you set the right expectations about what might happen next in the stock market. And, with the right expectations, it’s much easier to stay invested for the long term. But, how long is the “long term” anyways? And what is the typical recovery time from a bottom to a new all-time high?
Before we can answer these questions, let’s first look at how long it takes for U.S. stocks to reach a bottom.
[Author’s note: An earlier version of this post showed the bottom and recovery times for the price index only. Currently, this post shows the bottom and recovery times when we include dividends and adjust for inflation.]
How Long Does it Take for U.S. Stocks to Bottom?
Imagine I transported you somewhere between 1920 and 2024 when U.S. stocks were at an all-time high. Also imagine that you knew with certainty that the market was about to drop by at least 10% (before recovering). In this scenario, how long would it take for the market to go from peak to trough?
The median time, which we will look at momentarily, is 4 months. But, what if I changed the conditions? What if you knew with certainty that the market was about to drop by at least 20% (before recovering)? What about 30%? Would it take less time for the market to hit bottom when it goes by 20%+ versus 30%+?
Technically the answer is yes, but the difference in timing is smaller than you think! In general, it takes more time for U.S. stocks to reach a deeper trough, but not that much more.
When we examine all drawdowns exceeding 20%, the typical time to hit the bottom (from an all-time high) is anywhere from 7-24 months (0.6-2 years). You can see this in the table below which shows the median number of years for the market to go from an all-time high to a known decline of various magnitudes:
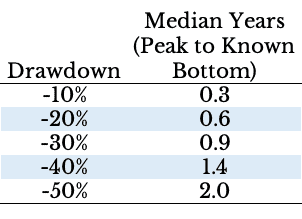
Once again, I am saying known decline because I’m controlling for the size of the drawdown beforehand and then figuring out the time to reach the bottom. In reality, we won’t know the size of the decline as we are experiencing it since the market could keep dropping.
The good news is that it doesn’t take that much longer for us to hit the bottom whether the bottom is 20% from the peak or 50% from the peak. So though we can’t know the future, historically, U.S. stocks tend to reach their low point rather quickly (within 7-24 months).
But what if we didn’t know whether a drawdown was coming? How long does it take to reach a bottom then?
The answer is much longer. Since all-time highs tend to follow all-time highs (i.e., they cluster), the average time to a given bottom is much longer than what I’ve shown above.
In other words, if you were at a random all-time high somewhere in history, how long would it take before you experienced a 10%+ drawdown? What about 20%+? Etc.
The answer is in the table below which shows the median number of years from any all-time high to a given drawdown threshold:

The time from any peak to a specific drawdown is much longer when we don’t know the decline is coming beforehand.
The reasoning for this is simple—large drawdowns have been rare throughout U.S. stock market history. As a result, from any all-time high the expected amount of time before we experience such a drop is many years.
This is important context, but isn’t as helpful for us right now. After all, we are already in our decline. So given we’ve reached some thresholds (e.g., down 10%, down 20%, etc.) how long does it typically take for U.S. stocks to recover? Let’s turn to that now.
How Long Does it Take for U.S. Stocks to Recover?
While U.S. stocks tend to bottom rather quickly, the time it takes for them to recover is typically much longer. Below you can see a table showing the median number of years to recover for the same drawdown thresholds we’ve analyzed previously:
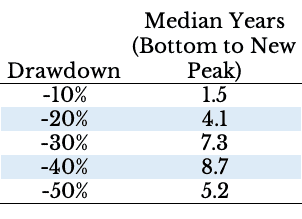
Putting it altogether, we can see that U.S. stocks tend to fall fast but rise slow. While it takes 0.6-2 years for U.S. stocks to decline by 20%-50%+, it takes anywhere from 4-9 years for them to recover!
Note that the median number of years for a 50% decline is smaller than for a 40% decline because there simply haven’t been that many declines of that magnitude throughout history. Going back to 1920, U.S. stocks have declined by 40% (or more) on 4 occasions and by 50% (or more) on only 3. With such a small sample size, weird things like this can occur.
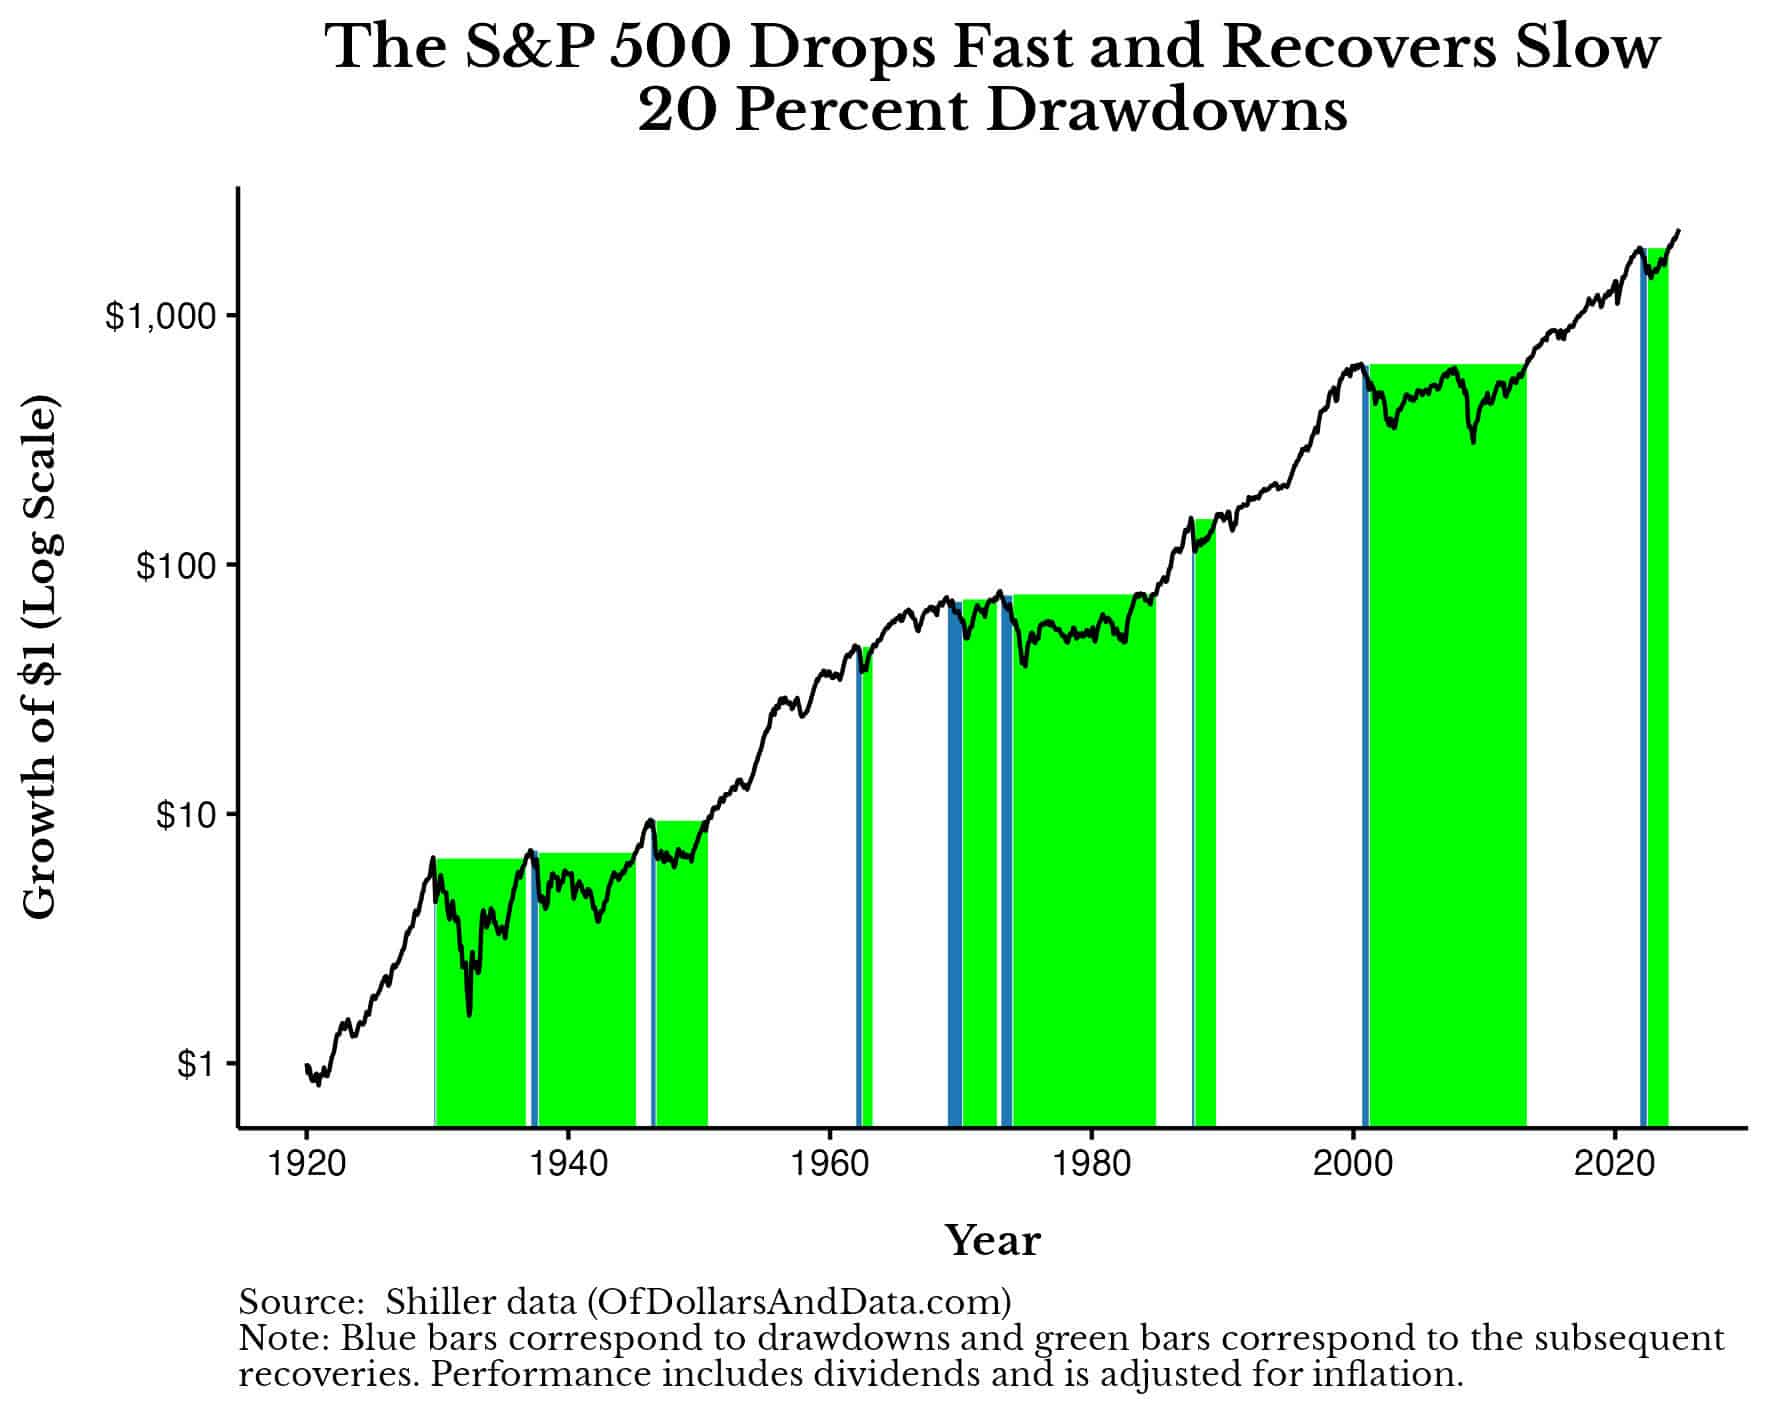
Either way, you can get a better idea for how stocks “fall fast and rise slow” from the chart below. It highlights every 20%+ decline in U.S. stocks (in blue) and it’s subsequent recovery (in green):
Since the end of the Great Financial Crisis, U.S. equity investors have been lucky that market declines have been followed by quick recoveries relative to history. This has likely distorted individual investor expectations about what typically happens following a market decline. After all, if everyone expects a quick recovery after a crash, when such a recovery doesn’t materialize, it may lead to an even larger selloff.
Then again, maybe quicker recoveries are the new normal. Since information moves faster than ever, I could see an argument for why we shouldn’t expect recoveries to take as long as they used to. Nevertheless, whether this will continue to be true remains to be seen.
Nothing Lasts Forever
When it comes to thinking about both drawdowns and recoveries, the only advice I have for you is…nothing lasts forever. This applies to both good times and bad. Markets don’t go up forever. They sometimes lose money, even for decades.
On the other hand, every drawdown ends at some point too. Of course, there are rare exceptions to this throughout history, but most developed equity markets eventually recover. Even Japan, which had a drawdown that exceeded 30 years, hit new all-time highs last year. As the phrase goes, “This too shall pass.”
The crazier part about how markets typically recovery is how they happen. Typically, prices start to rebound even as the headlines get worse!
This happened in the Great Depression when markets bottomed in the summer of 1932 even as the economy got worse. As historian Richard H. Pells noted, “Economically, the winter of 1932-1933 was the worst in American History.” The same thing happened in March 2020. The market bottomed during the early days of COVID as the death toll was rapidly rising.
Thankfully, both of those dreadful periods came to an end. And so will the economic uncertainty we are experiencing today. I’m not sure how it’s going to end, but it will pass eventually.
It’s easy to forget this and think that the world is coming to an end, but it probably isn’t. Of course, this doesn’t mean that bad things won’t happen. They definitely will. People lose jobs and wealth and experience other serious problems during periods of economic uncertainty. I never root for these things as a result.
At the same time, such events rarely turn out as badly as our worst fears suggest. Keep this in mind as the headlines roll in over the coming weeks. I don’t know when the storm will end, but I’m confident we will get through it.
Thank you for reading!
If you liked this post, consider signing up for my newsletter.
This is post 445. Any code I have related to this post can be found here with the same numbering: https://github.com/nmaggiulli/of-dollars-and-data