


I know you have probably heard it all before:
You can’t time the market. Give up. It’s too hard.
While I don’t disagree with this advice, it doesn’t actually address what conditions you would need to meet in order to be a successful market timer (without using quantitative approaches). So instead of writing off market timing, let’s ask, “When does market timing work?”
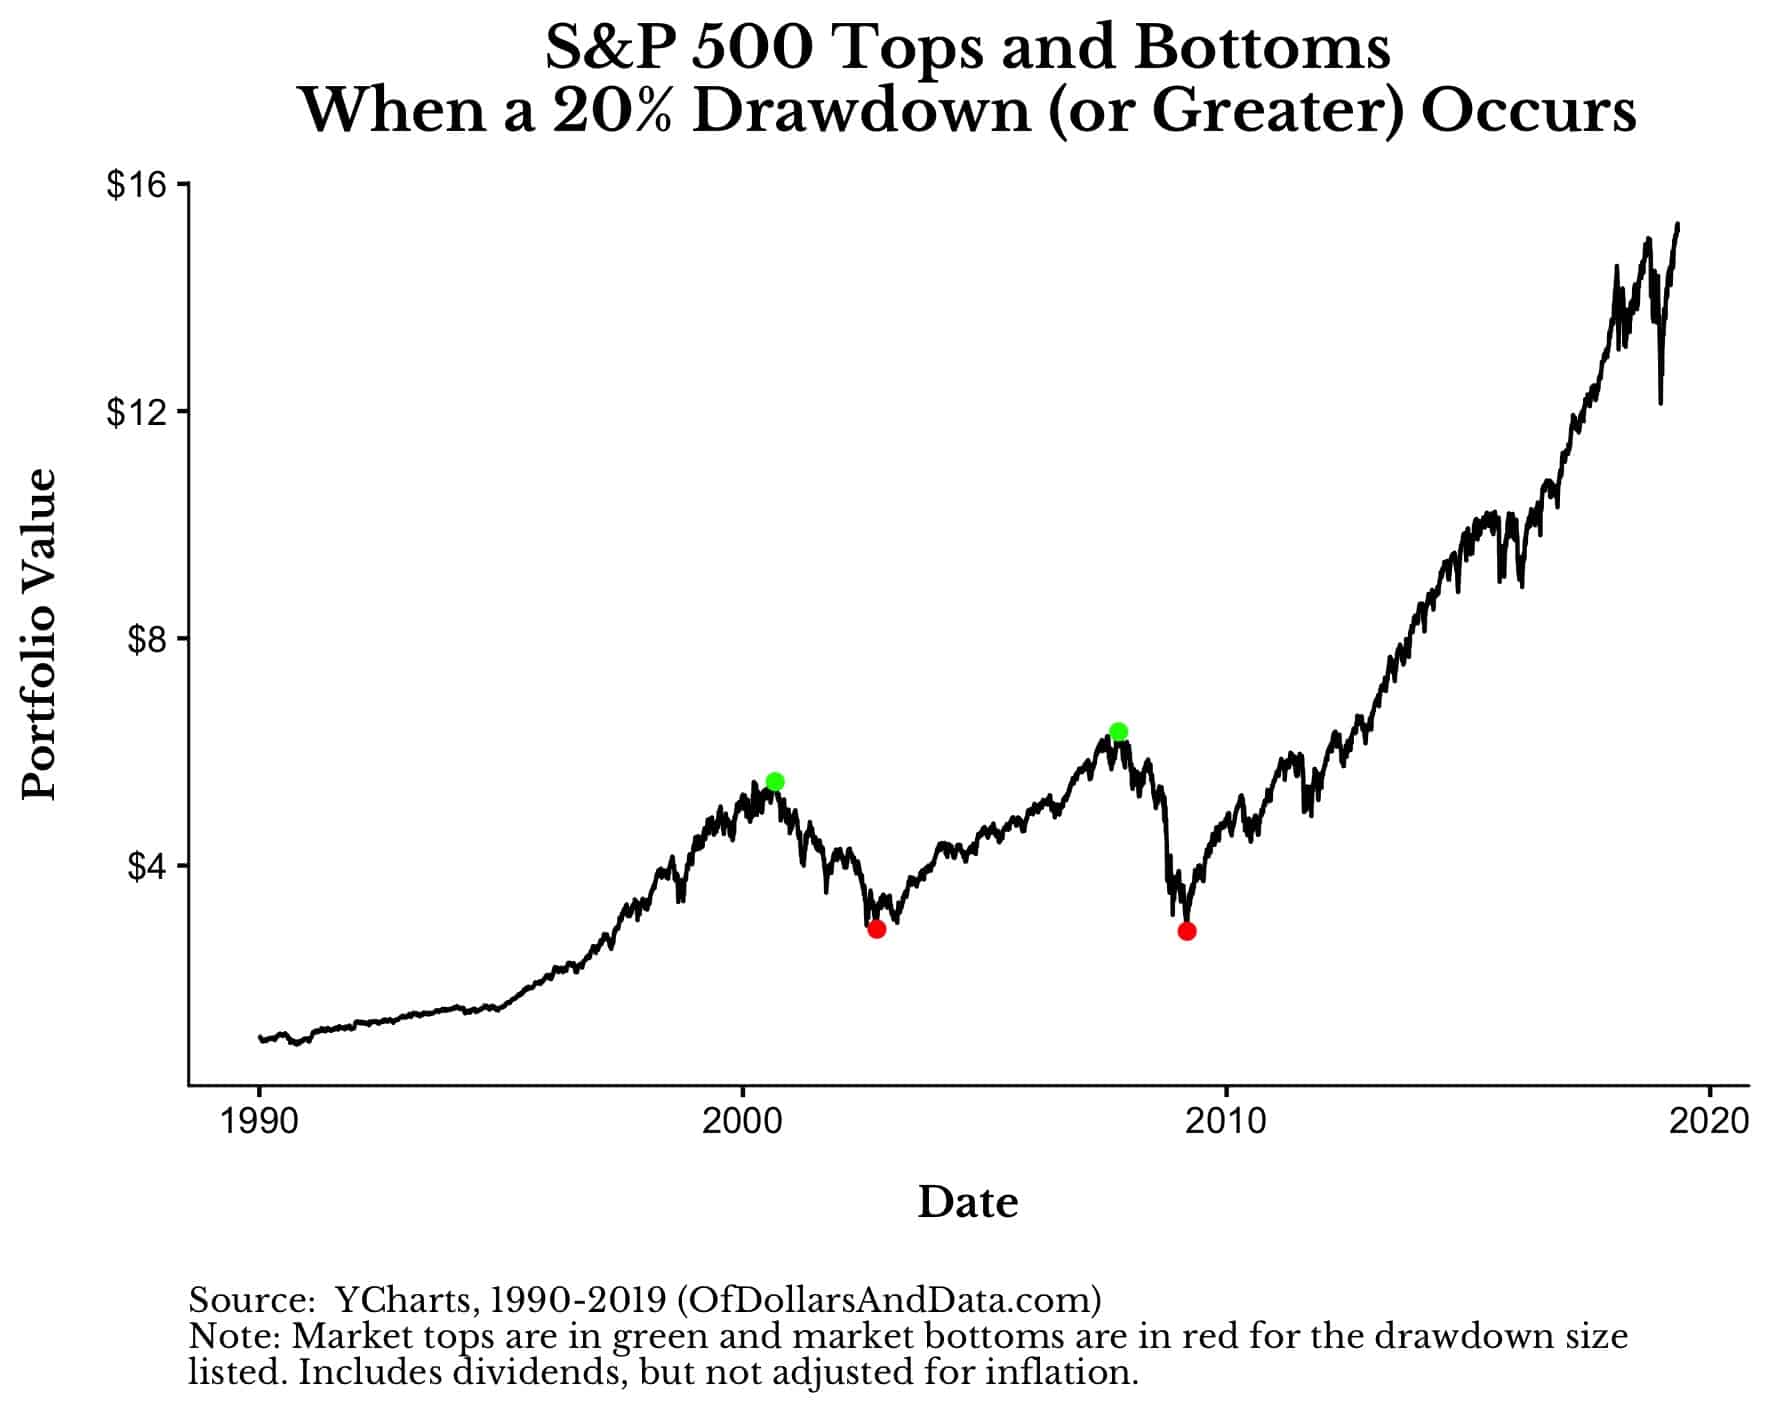
I looked into this, using the S&P 500 (with dividends) since 1990, and discovered that to succeed as a market timer you would have to:
- Know when the market is about to decline by some threshold amount (i.e. 20% or more).
- Act on this knowledge by selling within 250 trading days (1 year) of the top and re-buying within 250 trading days of the absolute bottom.
If we generalize this, successful market timing requires the ability to anticipate future declines and to act on them within a reasonable time frame. It doesn’t mean that you have to know exactly when the top/bottom is, but it does mean that you need to have a general sense of the market’s direction in the near future.
While this conclusion might seem obvious to you, what isn’t obvious is how much you can miss the top/bottom while still outperforming Buy & Hold. So, let’s dig in to find out.
To start, we will assume that you are invested in the S&P 500 and you never want to lose 20% (or more) of your money. This implies that you needed to miss the two major crashes (Dot Com Bubble and GFC) that have occurred since 1990:
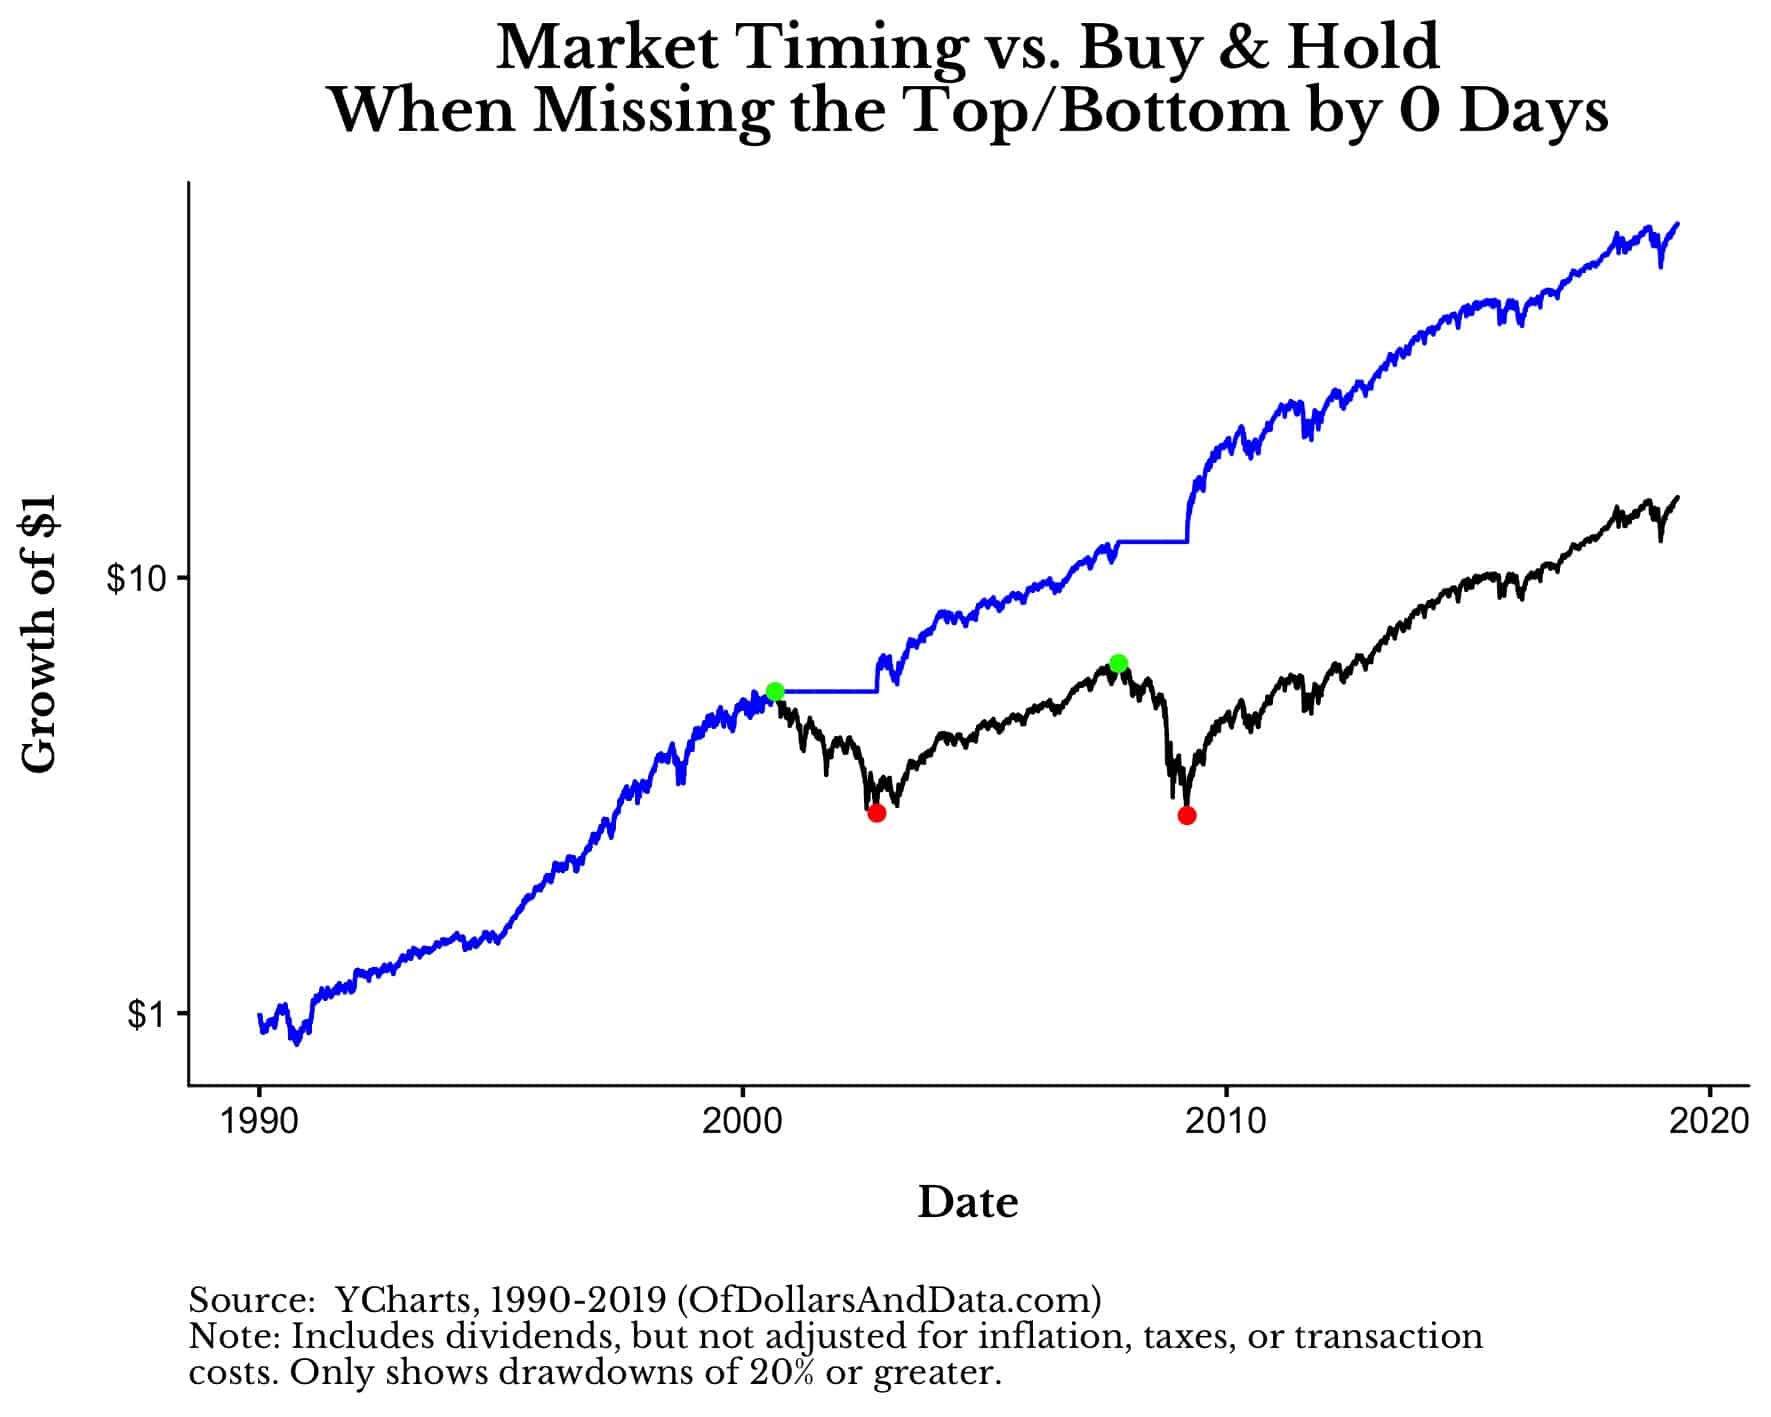
In this instance, your $1 invested in 1990 would have grown to $31. This still beats Buy & Hold’s performance, where $1 grew to $15, but it is far below the perfect timing model.
As we continue to extend the number of trading days by which you miss the top/bottom, market timing continues to lose its performance edge. By the time you miss the top/bottom by 250 trading days (1 year), market timing actually starts underperforming Buy & Hold:
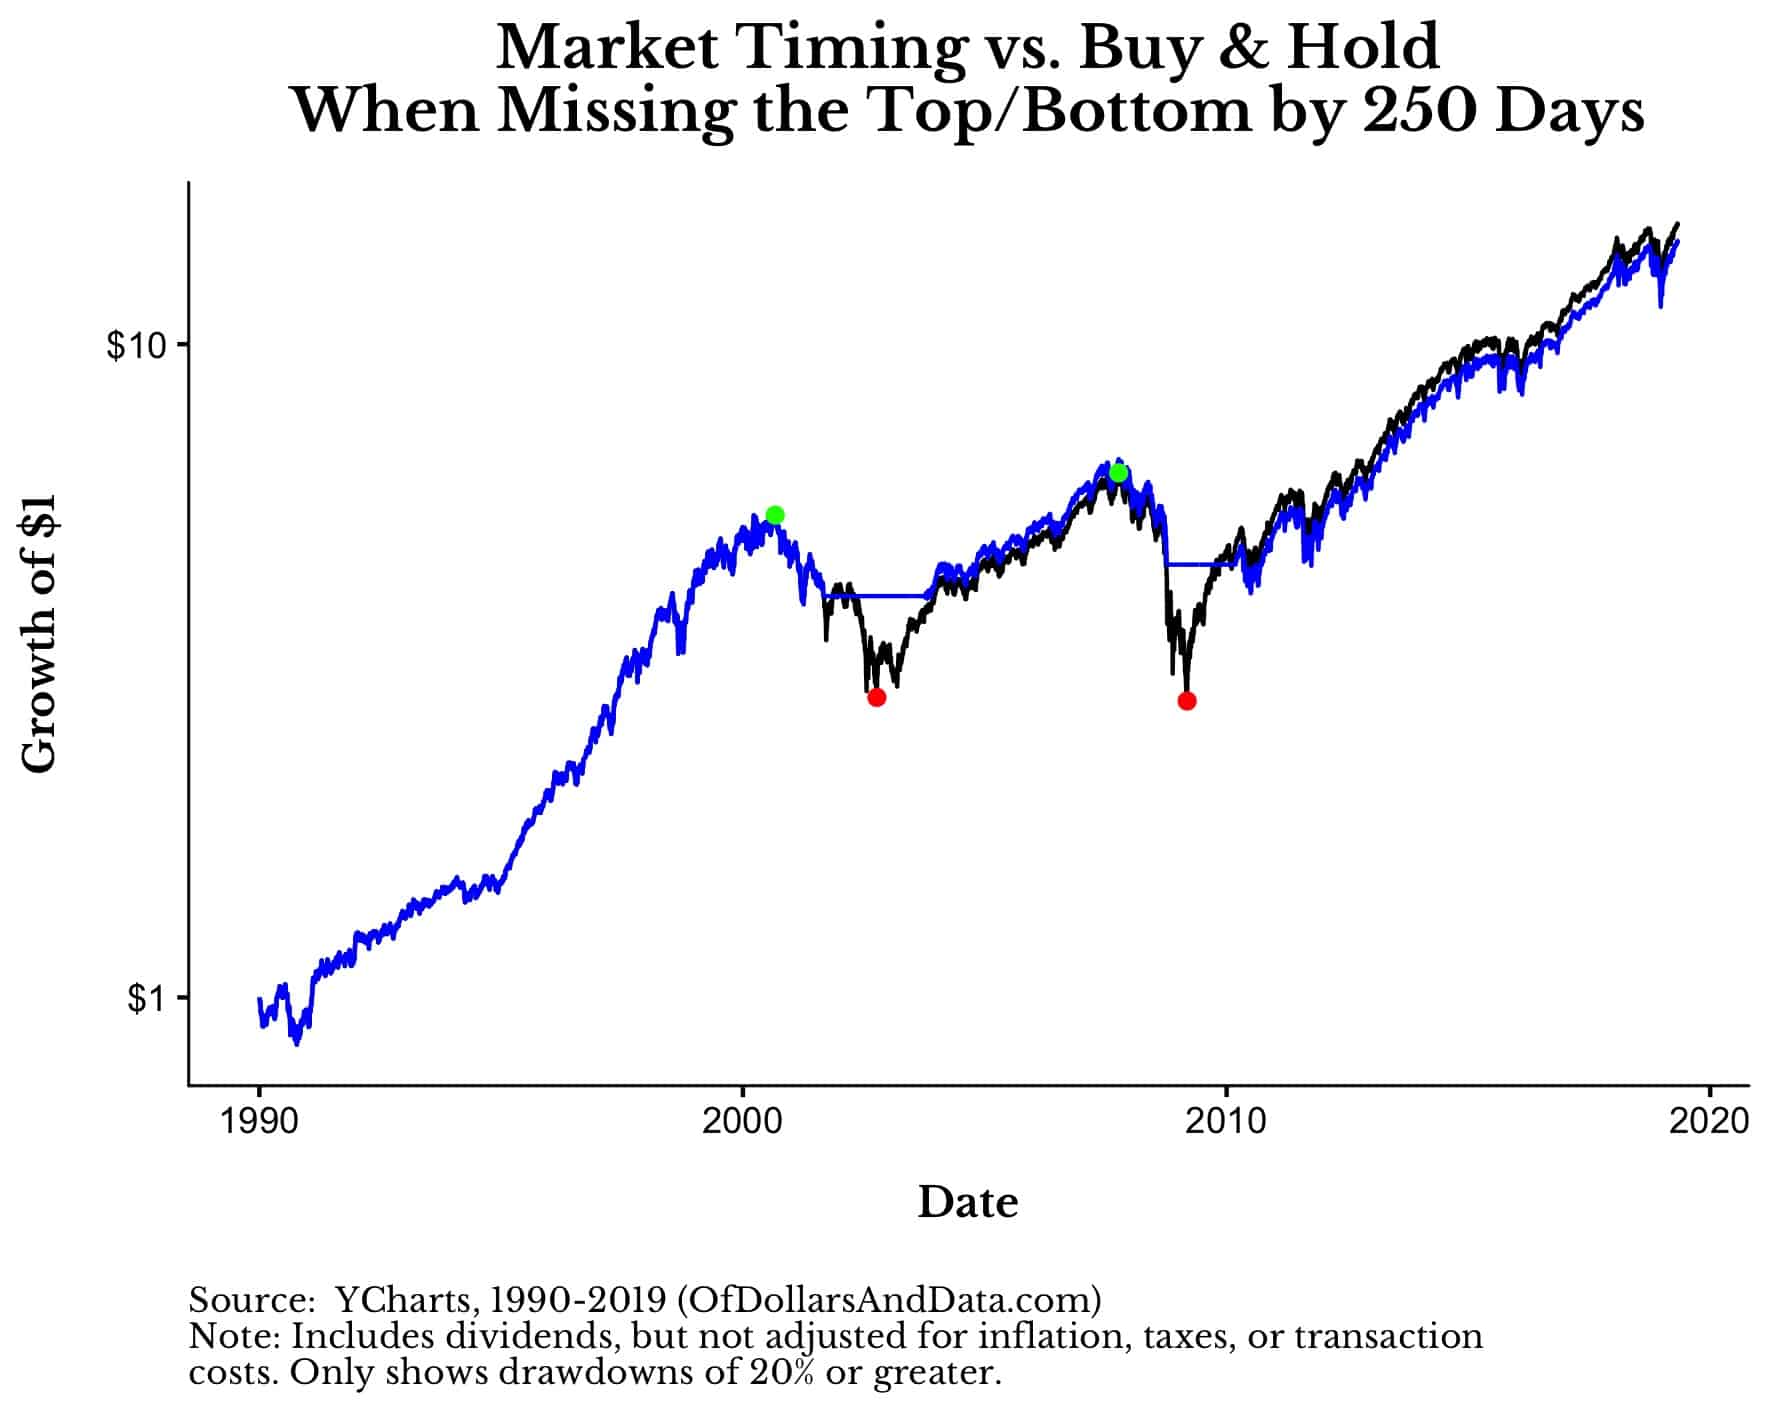
As you can see, selling 1 year after the top and buying 1 year after the bottom has similar performance to Buy & Hold.
But, I don’t just want to show snapshots. The chart below illustrates how market timing loses its performance edge as the number of days missed from the top/bottom increases. This decline in outperformance happens quickly and then more slowly as the number of days missed from the top/bottom grows larger. Additionally, I have also broken this relationship down by drawdown size (20% vs. 10%) to show that market timing has greater outperformance when avoiding larger declines:
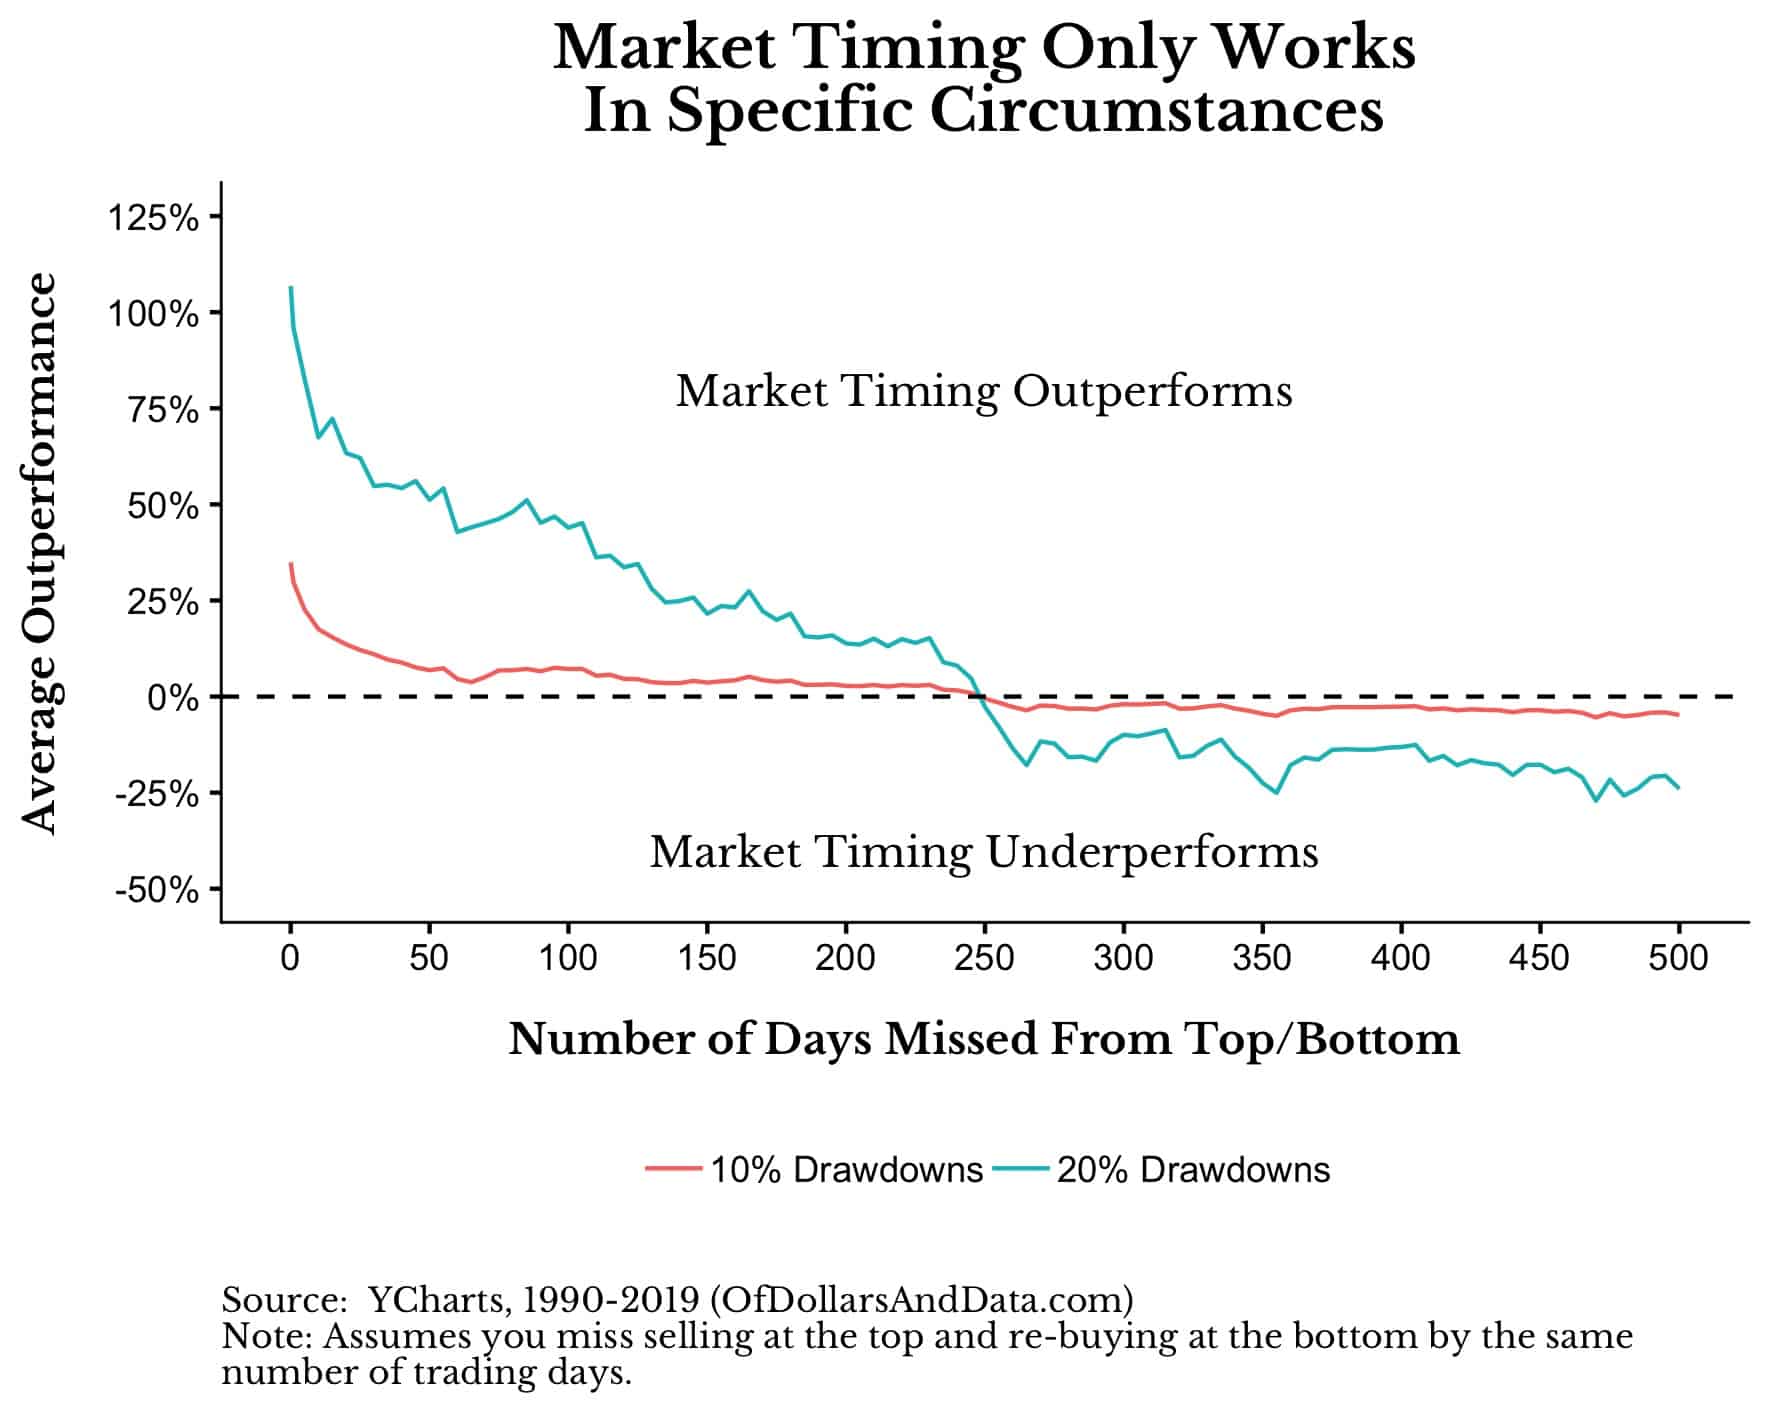
The main takeaway is that the more quickly you can avoid larger drawdowns, the more you will outperform Buy & Hold. In addition, this plot illustrates just how small of a benefit market timing provides when executed imperfectly or on smaller drawdowns.
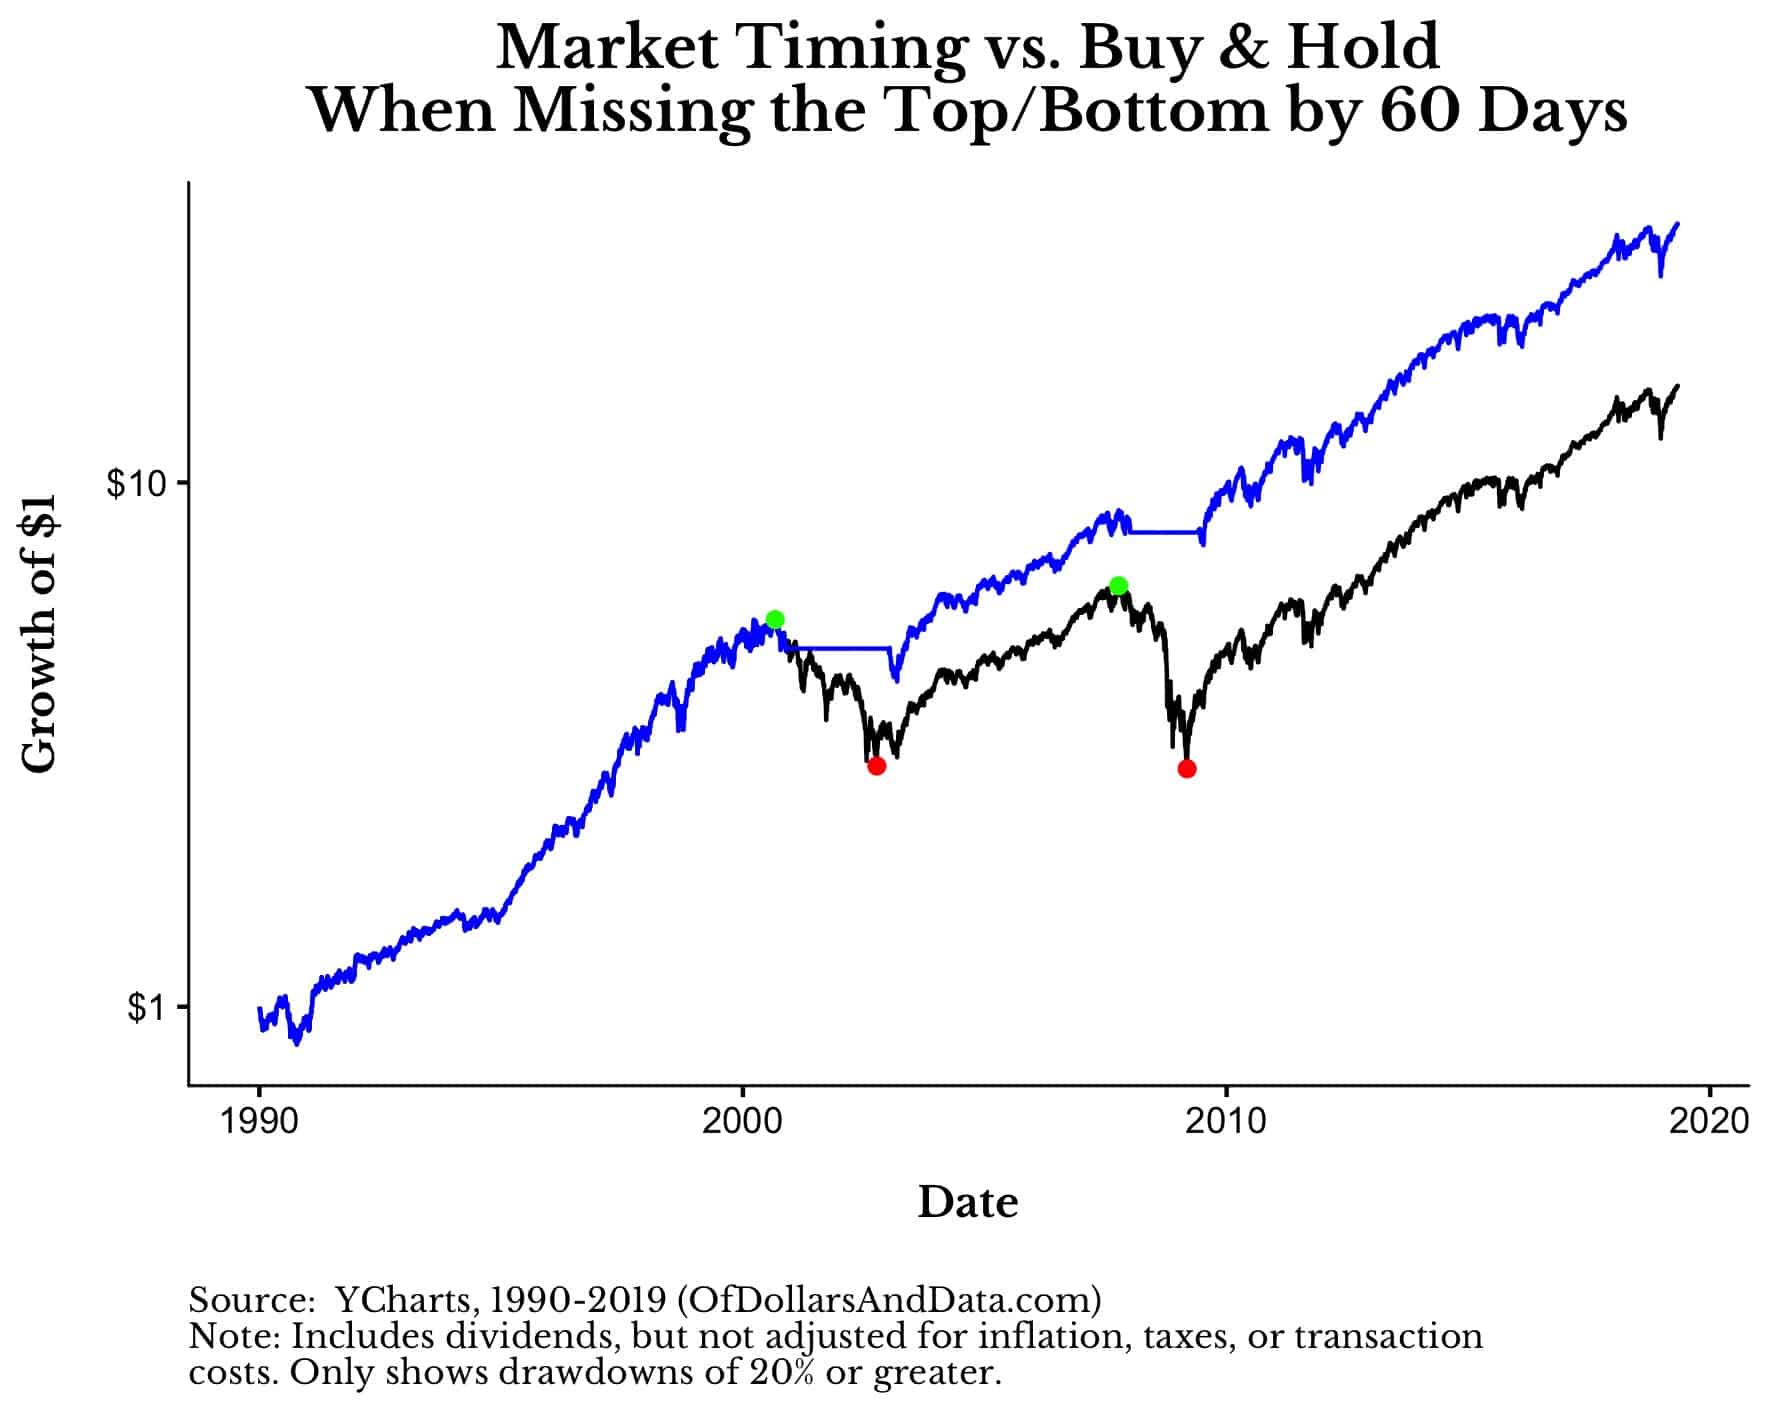
For example, missing a 10% drawdown by 60 trading days (3 months), only provides outperformance of 5% (on average) relative to Buy & Hold. Spending time and energy on such an endeavor may not be worth the hassle, especially if you are wrong.
Lastly, there is one huge issue with market timing that I have ignored for this entire article. How do you know when a market decline will be 20% (or greater) before it happens? You don’t. You have to go off some feeling that this decline is “the big one” and not one of the smaller declines that happen more periodically. Just look at this plot which alternates between the 10%+ drawdowns and the 20%+ drawdowns in the market since 1990:
How would you be able to differentiate between the 10% declines and the 20% declines beforehand? You could try to use valuation (i.e. P/E), but the evidence suggests that these are hard to use in real time and only work in the extremes. This leads me to the same conclusion as my colleague Ben Carlson: Market timing is hard.
In addition, my conclusion that you could miss the top/bottom by up to 250 trading days and still outperform Buy & Hold is based on…wait for it…two observations! Though I agree that there isn’t enough data to make specific conclusions like this, it does illustrate how its possible to outperform even if you miss the top/bottom by months.
Market timing isn’t impossible, but to do it successfully you need to be reasonably accurate on the market’s future direction. Just because you called a top/bottom this time doesn’t imply that you will call the next one. Things change and your way of gaining insight may no longer be valid in a different investing environment. Keep this in mind before you attempt any form of market timing.
The Only Way to Time the Market
Though I don’t believe that most individuals can time the market on a consistent basis, the data suggests that using a quantitative, rules-based approach to market timing can yield positive results. I didn’t used to believe this, but after reading Corey Hoffstein’s piece on two centuries of momentum, Meb Faber’s white paper on tactical asset allocation, and EconomPic’s post on trend following I became convinced by the evidence.
Why do these kind of timing strategies work in the long run? Because they fail a lot. They have false positives and this makes them difficult for many investors to stick with. I have written about this before if you want to a test the waters, but I still recommend doing a lot more research before embarking on a market timing strategy.
Lastly, a special thanks to Michael Batnick for heavily inspiring this post and thank you for reading!
If you liked this post, consider signing up for my newsletter.
This is post 123. Any code I have related to this post can be found here with the same numbering: https://github.com/nmaggiulli/of-dollars-and-data