


Say it with me:
Just. Keep. Buying.
This is the investing mantra that can change your life. These 3 words can make you rich. What I am talking about is the continual purchase of a diverse set of income producing assets. I am not talking about when to buy or how much to buy, just to keep buying. The idea seems simple because it is simple.
Many investors focus on the right time to buy stocks because they don’t want to buy near a peak in case of a future market crash. I understand the feeling. With the market near all time highs in early 2017, it can be tempting to hold off until there is a larger negative adjustment in prices.
The only problem with this approach is the market could go up for a significant period of time before a correction happens.
For example, if you search “stock market overvalued 2012” on Google you can find plenty of stories discussing how overvalued stocks were in 2012. If you had started waiting for an S&P 500 correction then, you would have missed out on the ~70+% increase in prices from 2012 through early 2017.
And I am not just picking on 2012, you can search in 2013, 2014, etc., and find similar accusations of the market being overvalued. Remember, there are always many reasons to sell.
Rather than worry about whether now is the right time to buy, just keep buying. Market high or market low, just keep buying. You should think of buying investments like you buy food–do it often.
Make it a habit to invest your money like you make it a habit to pay your rent/mortgage. As long as you can buy without paying fees or significant transaction costs, you should continue purchasing assets.
The investment concept I am describing is more formally known as dollar cost averaging (DCA). The only real difference between DCA and what I advocate above is that my approach has the psychological motivation built in.
The difference is that Just Keep Buying is an aggressive investment accumulation approach that will allow you to build wealth. Think of it like a snowball rolling down a hill. Just keep buying and watch that ball grow.
If I still haven’t convinced you, let me tell you a story. The story is about a man with possibly the worst luck in investing history. He made a total of 4 large stock purchases between 1973 and 2007. He bought in 1973 before a 48% decline in stocks, bought in 1987 before a 34% decline, bought in 2000 before the dot com crash, and bought in 2007 before the Great Recession.
Despite these 4 individual purchases that totaled a little less than $200,000, how did he do? He ended up with a $980,000 profit for a 9% annualized return. What was his secret? He never sold.
That’s right. Selling out is literally selling out your future wealth. You need to hold on to your assets as you acquire more.
This is the purpose of capitalism (i.e. acquiring capital). The only time you should sell your investments is for rebalancing (annually/quarterly, etc.) or in retirement. Otherwise, you already know the mantra.
If you want to see some data that illustrates my point, I will first need to explain a concept called the P/E ratio (price to earnings). Essentially this is a measure of how expensive a stock is relative to its current earnings. For any individual stock this can vary wildly for a number of reasons.
However, for the stock market as a whole, P/E has been a good proxy (historically) for when the market might be undervalued or overvalued. Therefore, a higher P/E ratio generally corresponds to an overvalued market and a lower P/E ratio an undervalued market.
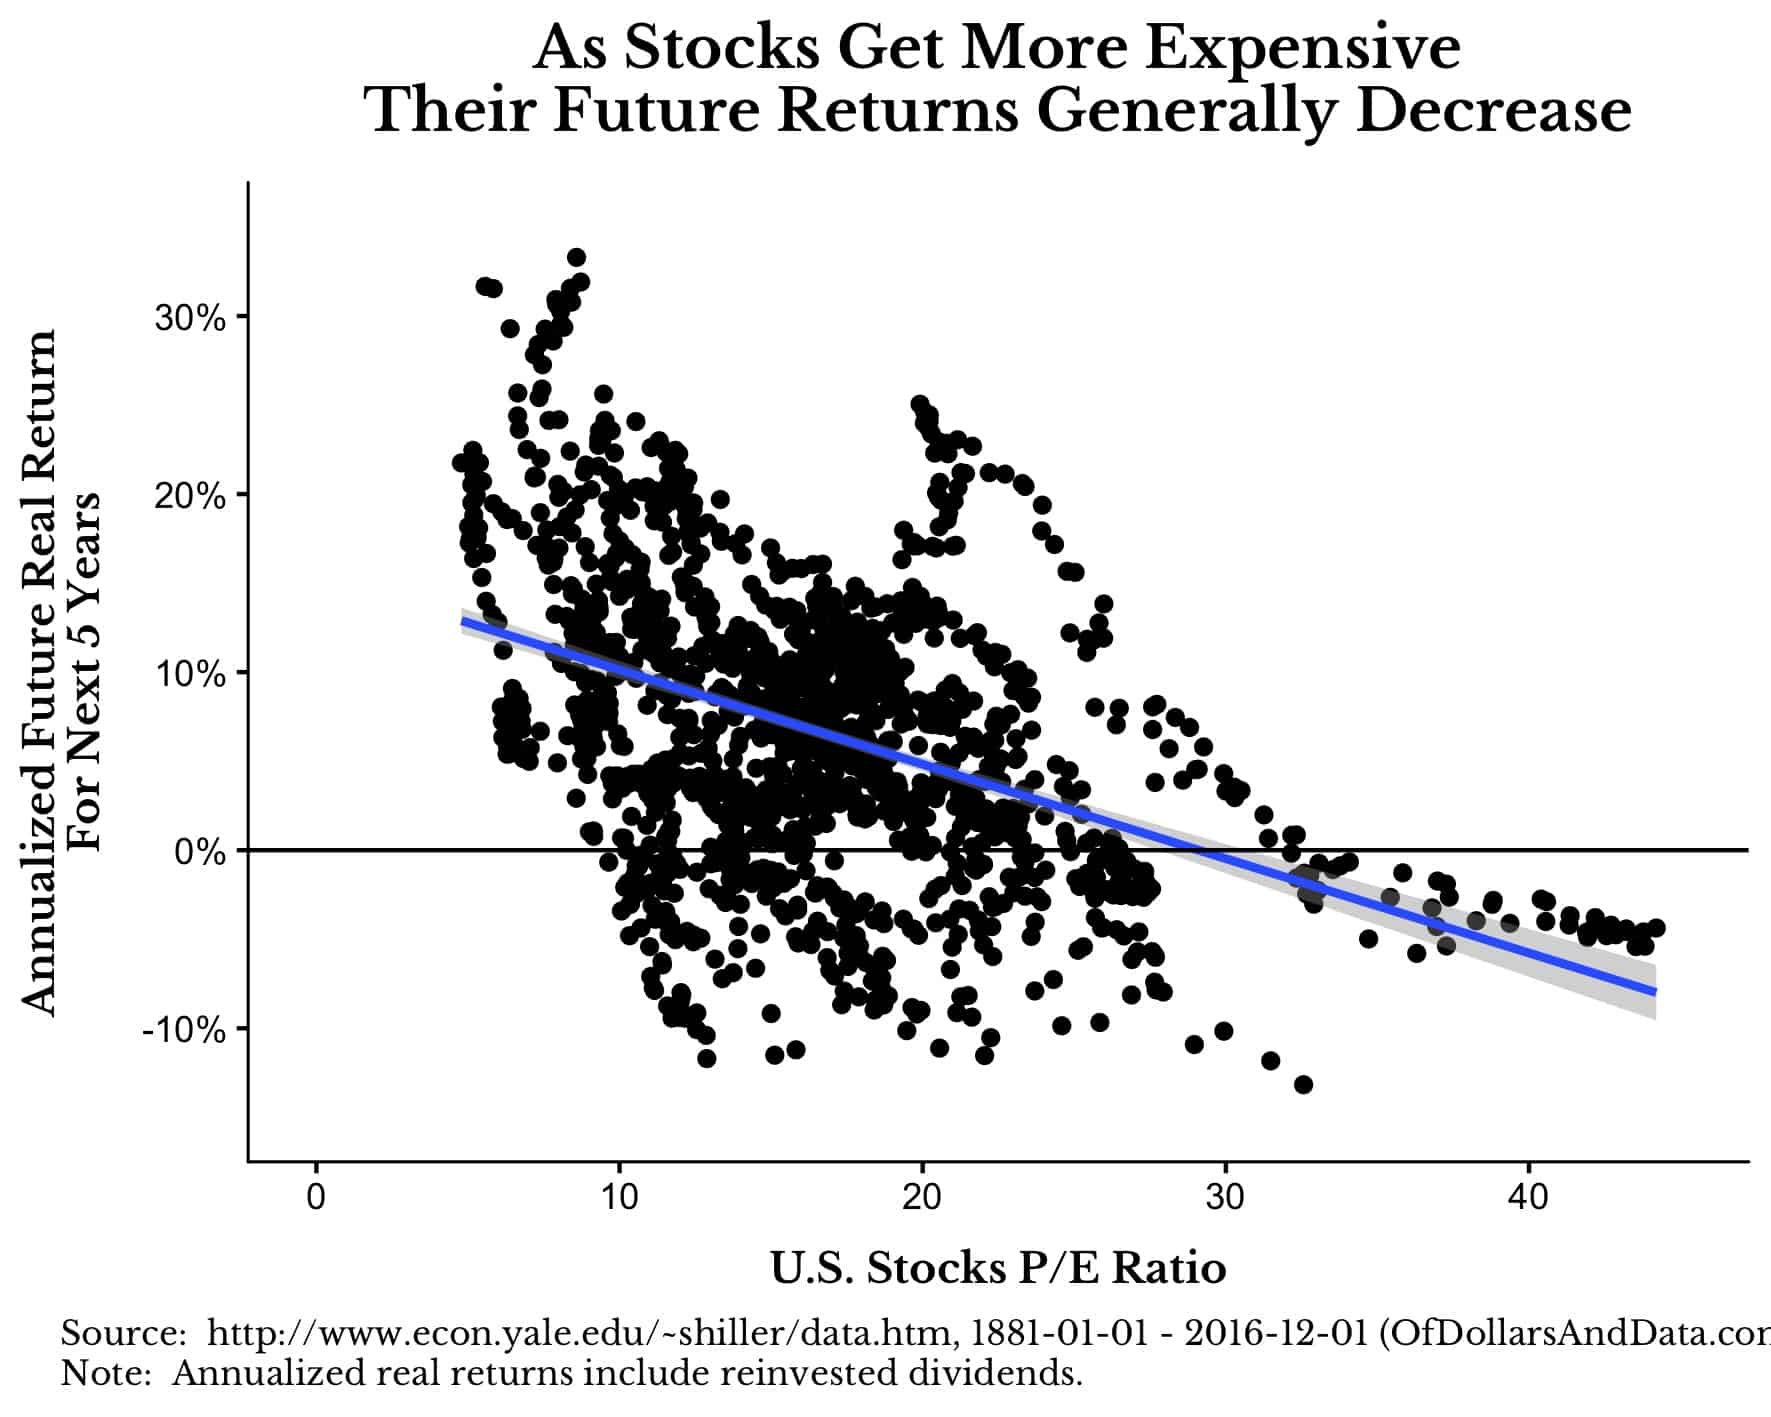
The following plot shows the historical P/E ratio of the U.S. stock market on the x-axis and the real return for the next 5 years on the y-axis. The data comes from Robert Shiller and has monthly market returns and dividends since 1881.
As you will see, there is a negative relationship between the P/E and the future real return. This means as stocks gets more expensive (moving to the right on the plot) you also can expect a lower real return going forward (moving down on the plot):
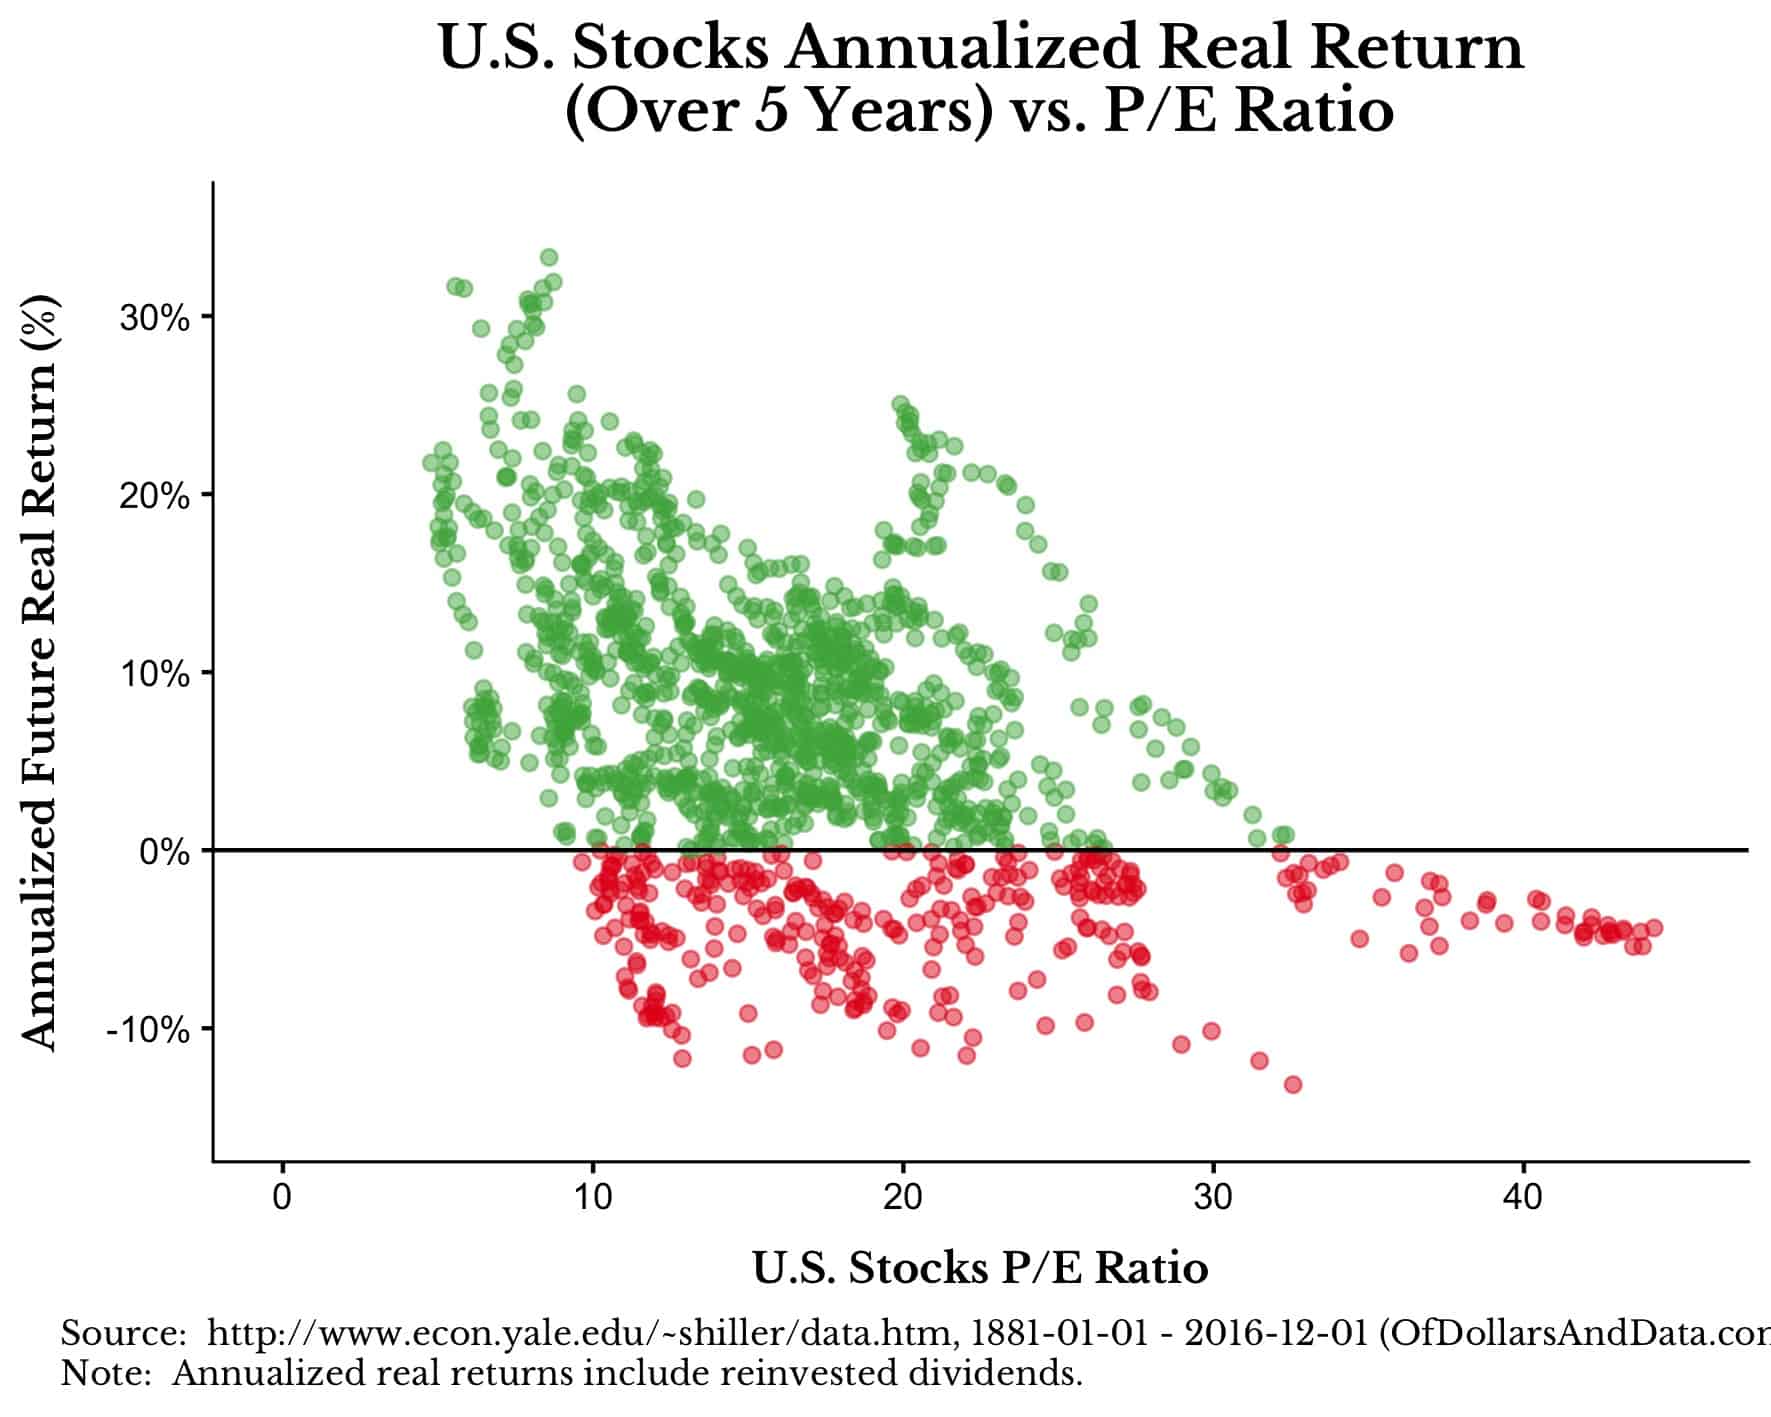
Now, let’s look at the same chart above without the fit line and coloring points as to whether the returns are positive (green) or negative (red) going forward:
While the relationship between P/E and future returns is somewhat strong over a 5 year period, as we increase our investment horizon to longer time periods, this relationship breaks down.
For the next graphic, you will notice that as you hold for longer periods of time the negative returns slowly disappear and you see more and more positive real returns.
Please start focusing when the graphic is at “(Over 5 Years)” to see this process in action:
What is interesting about this is that over any 20 year period U.S. stocks have had no real negative returns (when including dividends), and over a 30 year period the returns have generally converged despite some dispersion.
While I hope that future stock returns are similar to what they have been historically, there were two great pieces in the last week, one by blogger Jesse Livermore and one by Ben Carlson, that suggest future returns might be lower. Regardless of whether this is true, the animation above should illustrate the importance of holding assets over longer periods of time.
To Buy or Not to Buy?
Despite the optimism I have for just keep buying, there is a psychological barrier you will need to overcome to follow it. It is easy to buy when overall prices are rising or flat, however, when you are seeing declining prices over time, it will not be easy.
Ironically, the best time to buy is also the time when you are most likely to lose the faith and sell.
For example, let’s play out what happened during the Great Depression as described by William Bernstein in his book Rational Expectations (quotes are paraphrased from the original work):
It is June 1929 and you are on the verge of retirement holding a diversified portfolio of stocks and bonds. Over the course of the next year stocks fall by 26%.
At this point you are probably thinking it is a good time to buy because prices have dropped, right? So you decide to rebalance by selling bonds to buy stocks in June 1930.
Another year goes by and stocks fall an additional 26%.
That hurt, but you still have some bonds. Stocks must be near bottom now, right? With a cumulative fall of 45%, how much lower could they go? You decide that it is time to sell more bonds and buy more stocks in June 1931. Unfortunately then this happens:
From June 1931 to June 1932 stocks would fall a disastrous 64%!
That, my friends, is the problem with market timing. Can you imagine stocks falling a cumulative of 80% over 3 years? How would you react? What is worse than this scenario is if you had started investing in stocks near the peak in September 1929 and pulled out in the summer of 1932. Over that period you would have lost 90%!
Though I hope we never see anything like this again, imagine how hard it would be to keep the faith of “just keep buying” in this environment.
In closing, I don’t have any advice to help cope with the psychological pressure to sell during something like the Great Depression.
I have only ever invested in a bull market (2009–2017), so I don’t know if I will be able to practice what I preach (i.e. to just keep buying) during large downturns. I hope I can and I hope you can too, but only time will tell. Thank you for reading!
[Author update (04/12/2022): If you liked this post, then you will love my book, Just Keep Buying, based on it.]
If you liked this post, consider signing up for my newsletter.
This is post 17. Any code I have related to this post can be found here with the same numbering: https://github.com/nmaggiulli/of-dollars-and-data