In the 1987 film Wall Street, Bud Fox, a rising stock broker looking to win over the legendary financier Gordan Gekko, says:
“Life comes down to a few moments. This is one of them.”
Little did he know how right he would be about not only personal success, but also investing success. This week’s post uses U.S. stock market real prices and dividends from 1871–2016. The data come from Robert Shiller (you can read about his methodology and how the data was constructed here).
If you want to understand what I mean by a “few” moments consider this: From January 2000 to December 2016 there were 204 months, however, only 6 of them (less than 3%) are responsible for the entire real gain in the S&P 500 (with dividends reinvested). The remaining 97% of monthly returns net each other out. See here:
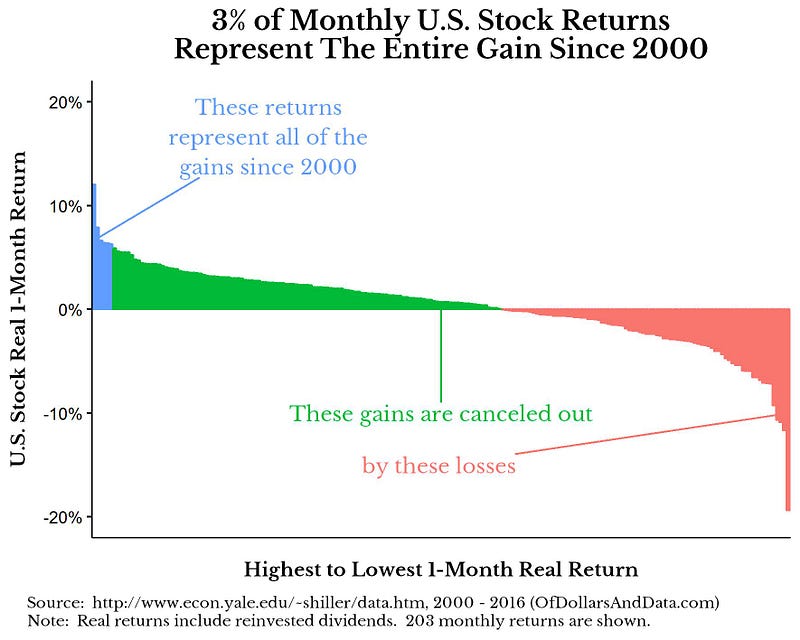
The positive green bars are canceled out by the negative red bars and the remaining blue bars taken together are the return that the investor would have gotten had they been fully invested over the entire time period. This might shock you, but if you know any market history, January 2000 was near the height of the tech bubble, so the above statistic is slightly biased.
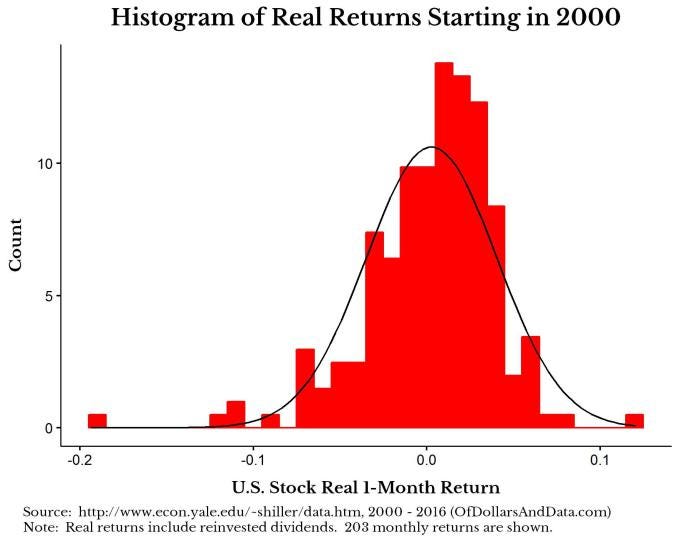
If we look at the distribution of these returns you can see that there are larger negative returns that tend to dominate the many smaller positive returns. You can see this visually as the red bars (real returns) do not match up with the black line (the approximation of a normal distribution):
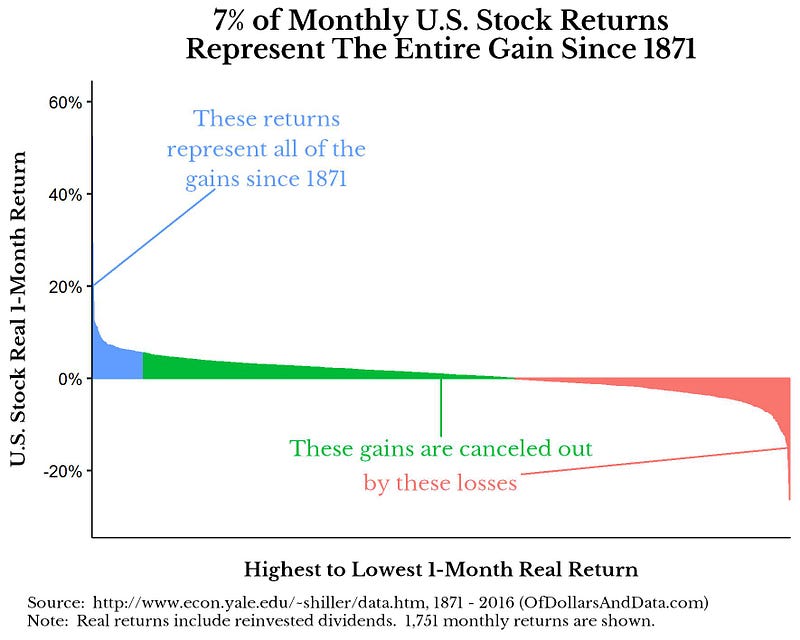
However, as I said before, this time period is slightly biased as I am starting near a market peak in 2000. For a more balanced time frame, consider the real returns over the period January 1871 to December 2016. Over this period, 7% of all monthly returns represent the entire real gain in U.S. stocks:
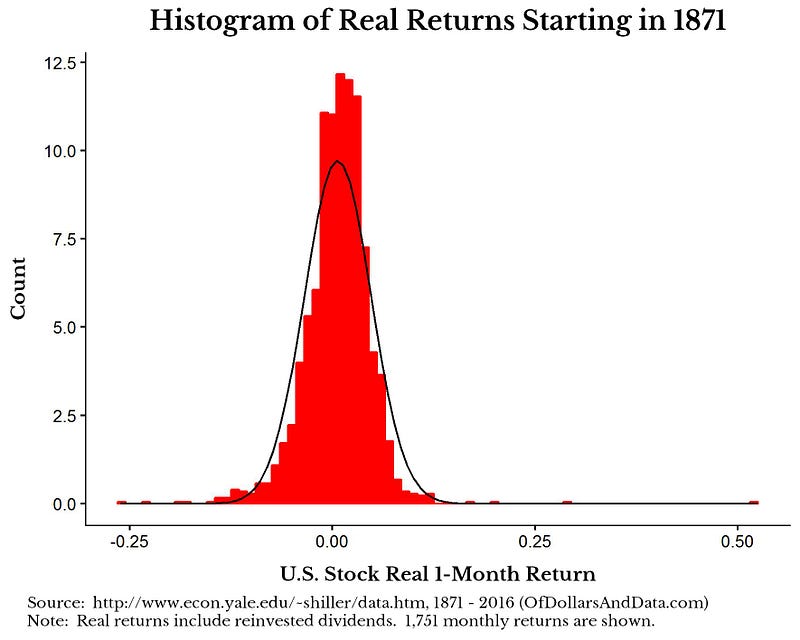
This is not as shocking, but it is harder to have any frame of reference for this period given it was so long ago. If we look at the distribution of returns these also do not exhibit normality either:
Now, this analysis is not necessarily a new idea. In 2014, JPMorgan Asset Management found that the 40 best days accounted for more than the entire S&P 500 return from 1993–2013. Additionally, in the last few weeks Hendrik Bessembinder published a paper showing how 4% of all stocks listed accounted for the entire excess return over Treasury Bills since 1926! I highly recommend you read this paper if you are interested in investing.
The main point is that investing success is dominated by a smaller number of events/stocks representing most of the gains in the market. This is why market timing and stock selection can both be losing propositions for most investors.
How to Not Miss Out on Those Few Moments
The best way to make sure you win big is to stay invested in the market as much as possible. “Don’t dance in and out” in an attempt to time the market, as Warren Buffett says. This is even more true when times look tough. In the data I presented above from 1871–2016, the 5 most positive monthly returns in S&P 500 history came in the 1930s as the U.S. came OUT of the Great Depression. As they say, “The night is darkest just before the dawn.”
Thank you for reading!
If you liked this post, consider signing up for my newsletter.
This is post 09. Any code I have related to this post can be found here with the same numbering: https://github.com/nmaggiulli/of-dollars-and-data

