In Howard Marks’ latest memo to investors, he argues that markets are in the midst of a sea change similar to the sea change that occurred in the early 1980s when interest rates began their 40 year decline. The image below illustrates the rise and decline in interest rates that Marks is referring to:
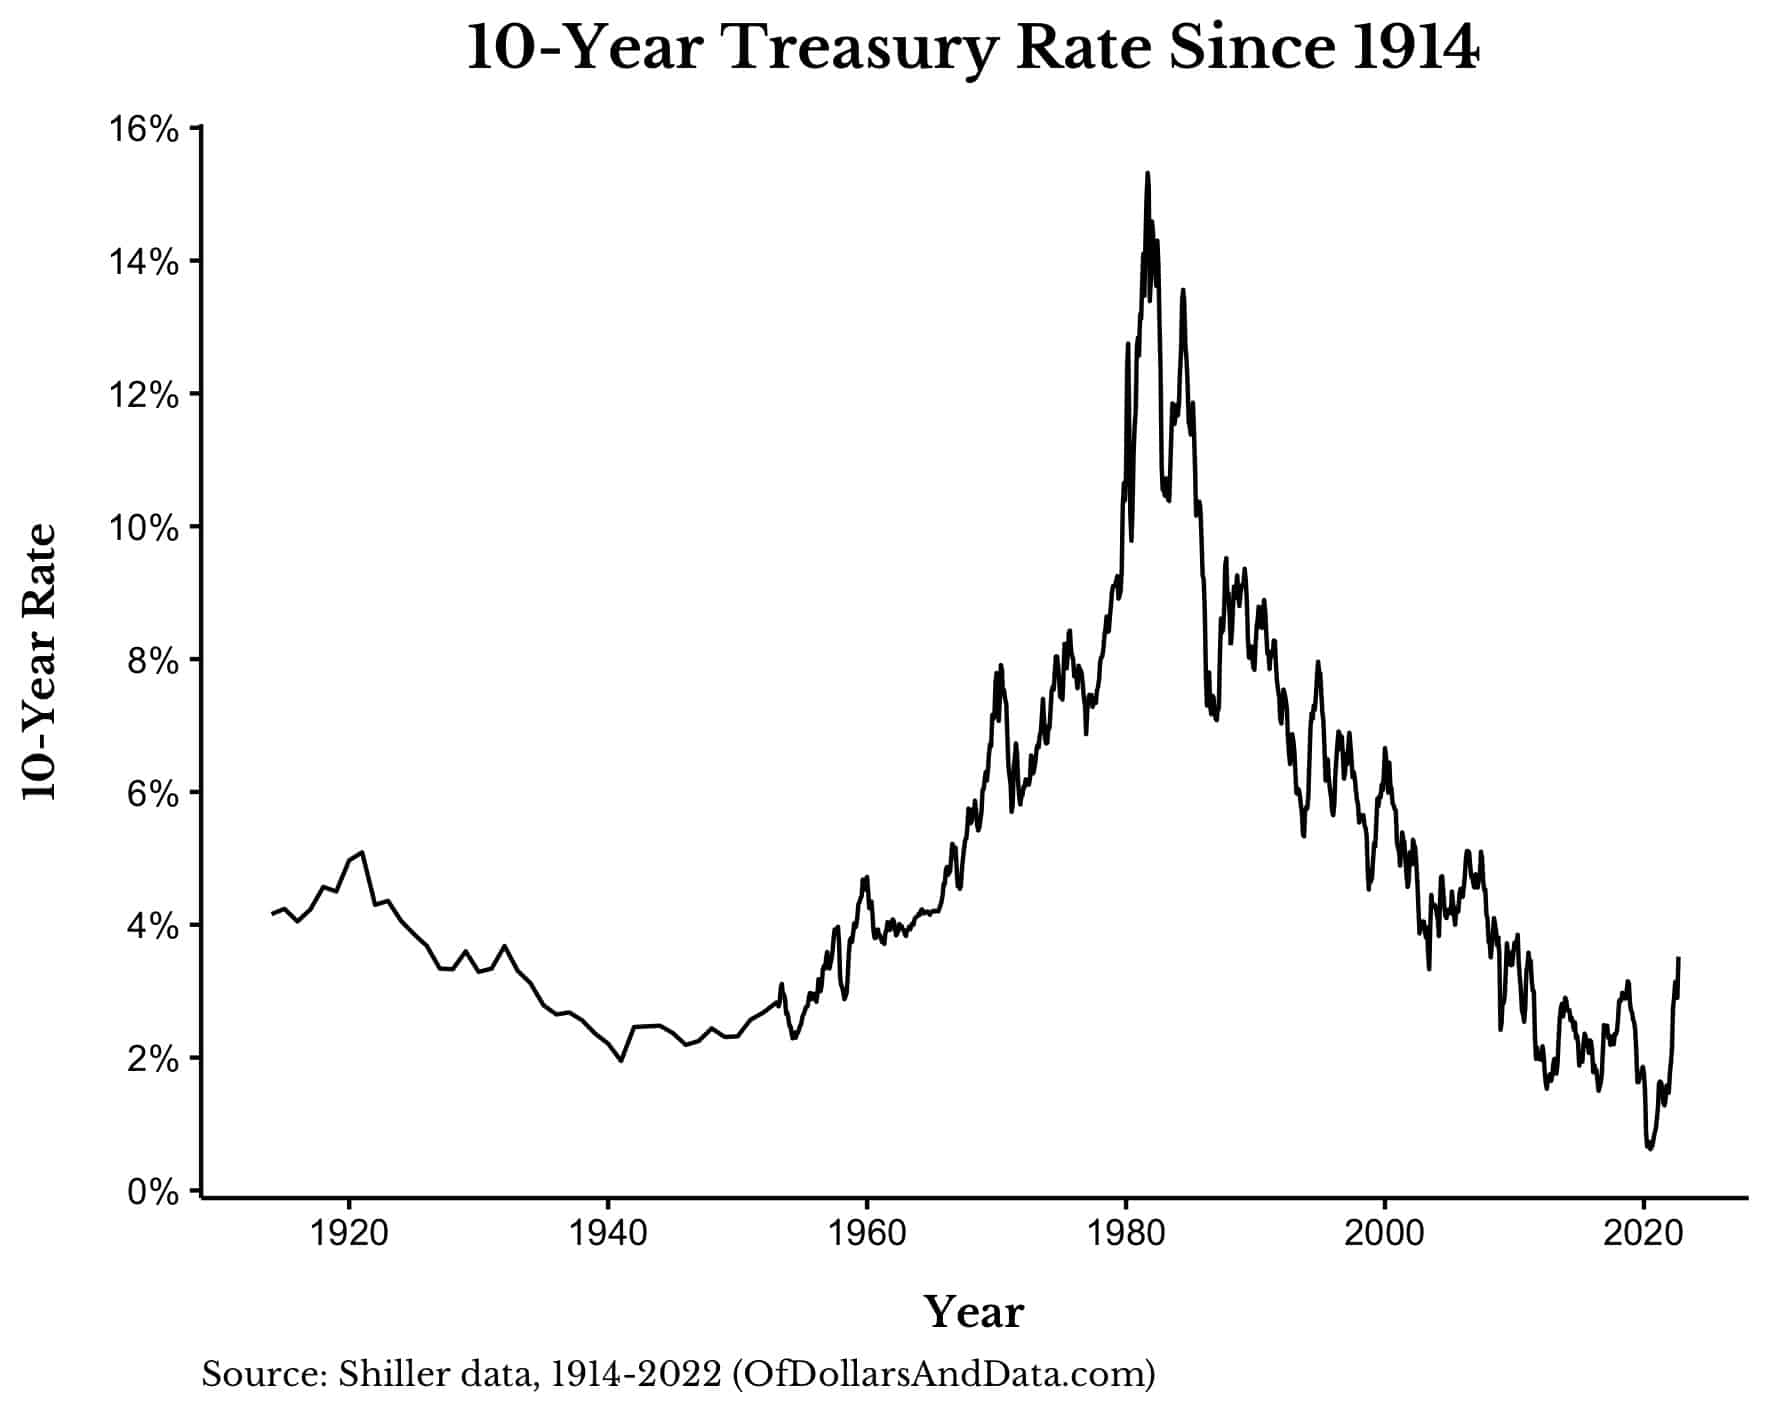
But Marks doesn’t stop there. He goes on to claim that the decline in interest rates over the last four decades has been the primary driver of asset growth:
It seems to me that a significant portion of all the money investors made over this period resulted from the tailwind generated by the massive drop in interest rates. I consider it nearly impossible to overstate the influence of declining interest rates over the last four decades.
I don’t think Marks is incorrect, however, after looking at the data, I’ve come to the conclusion that most of the impact that declining interest rates had on asset prices (particularly U.S. stocks) occurred during the 1980s (and somewhat into the mid-1990s). After that, the impact of declining interest rates may not be as significant as Marks claims. Let me explain.
How Do U.S. Stocks React to Interest Rate Changes?
To get started, let’s examine how changes in interest rates have impacted U.S. stock prices throughout history. To do this, I plotted the total real return in U.S. stocks (over the prior five years) against the absolute change in the 10-Year Treasury rate (over the prior five years) since 1914 (when the Federal Reserve was first established):
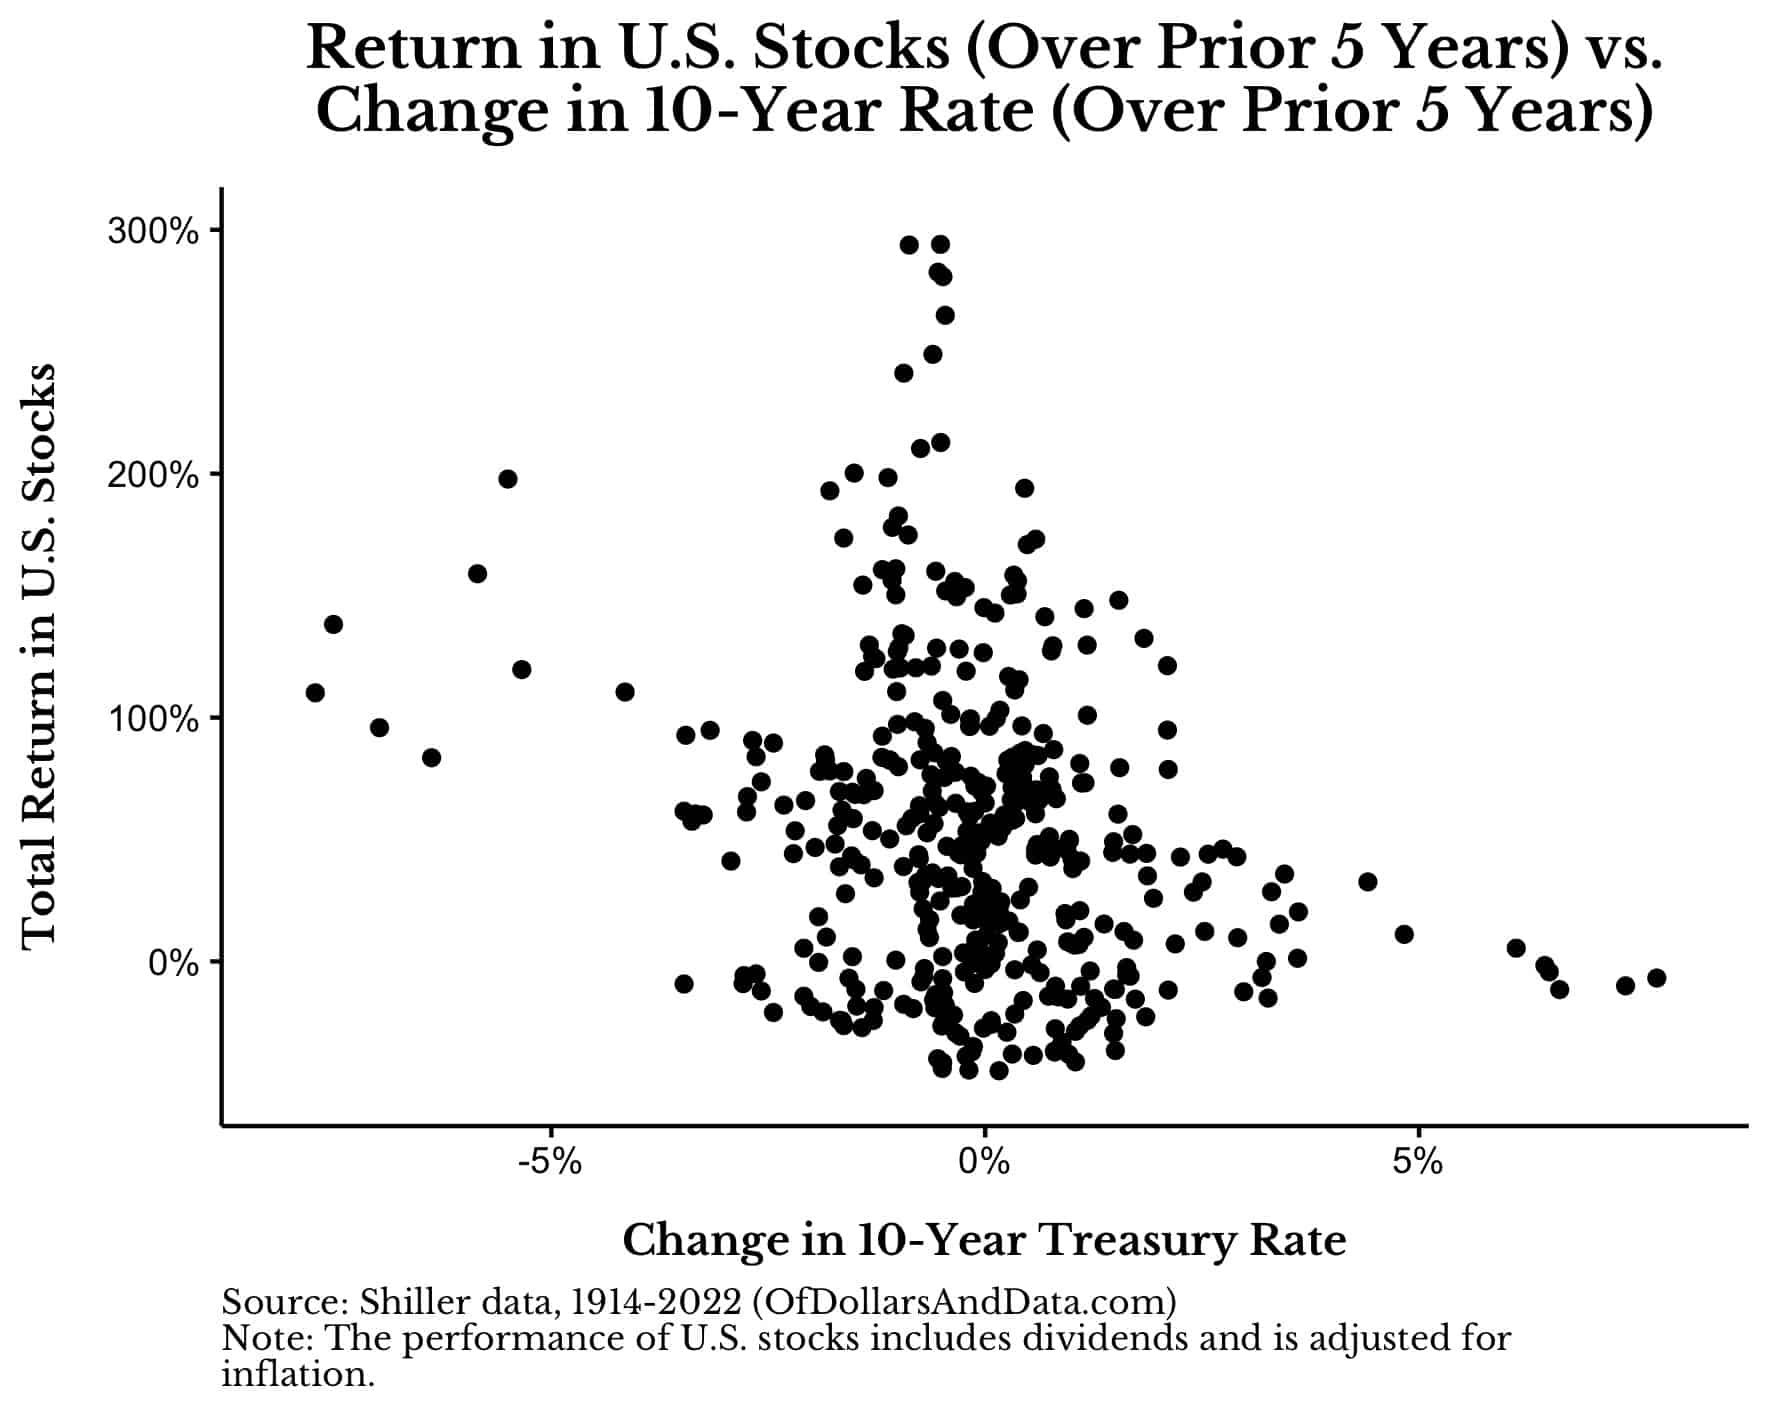
As you can see, there seems to be somewhat of an inverse relationship between the change in Treasury rates and stock performance (at least at the extremes). When rates decline by a lot, stocks tend to rise, and vice versa. This is exactly as Marks suggested.
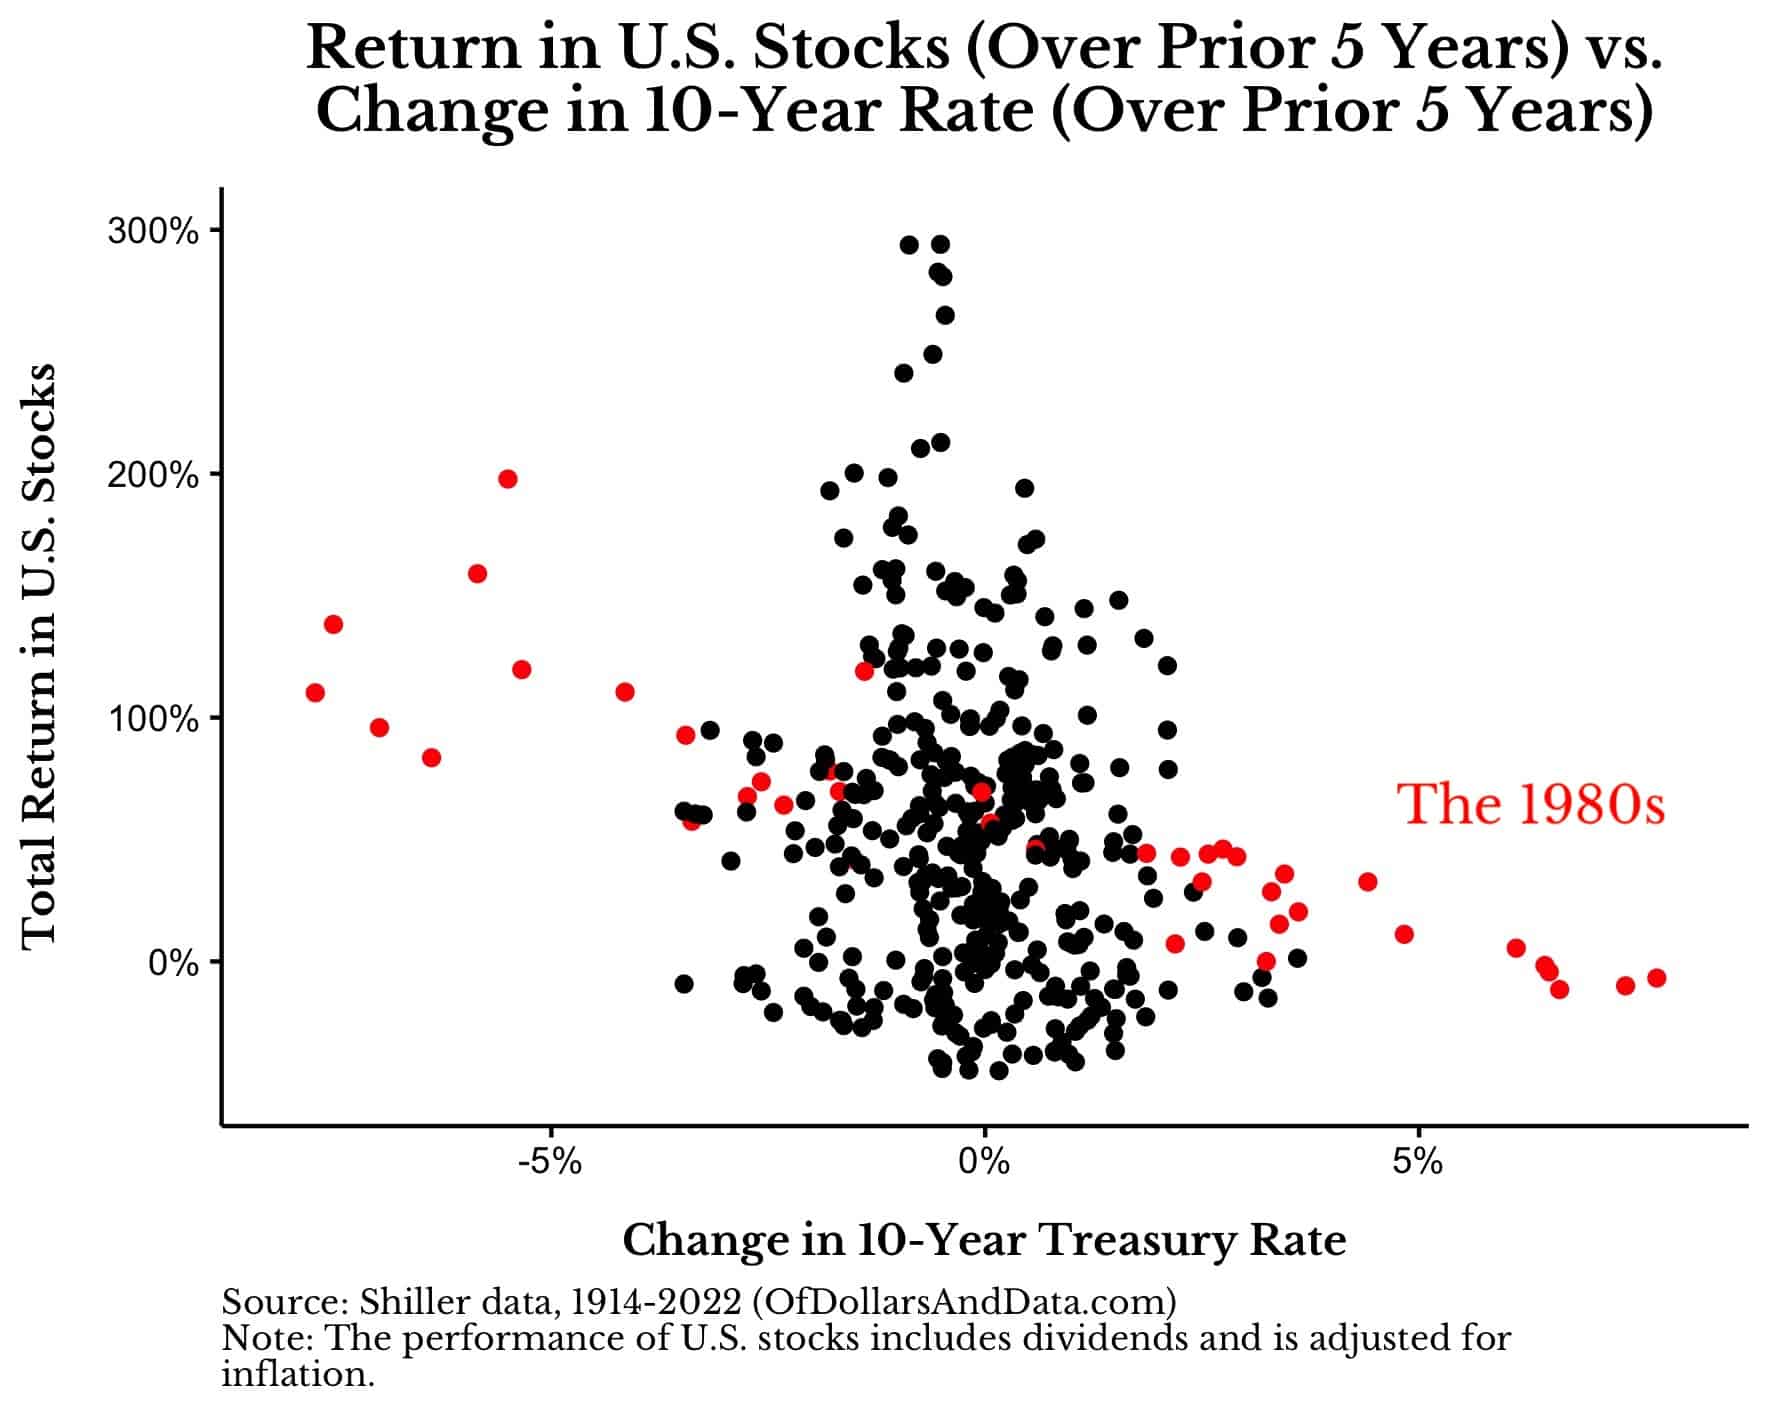
However, if you dig into the data a bit more, you’d realize that most of this relationship is derived from a single period—the 1980s. Below I have plot the same plot as above, but highlighted the 1980s in red:
If we were to remove this decade from the chart, we would see that the relationship between the change in interest rates and stock performance is much weaker afterwards:
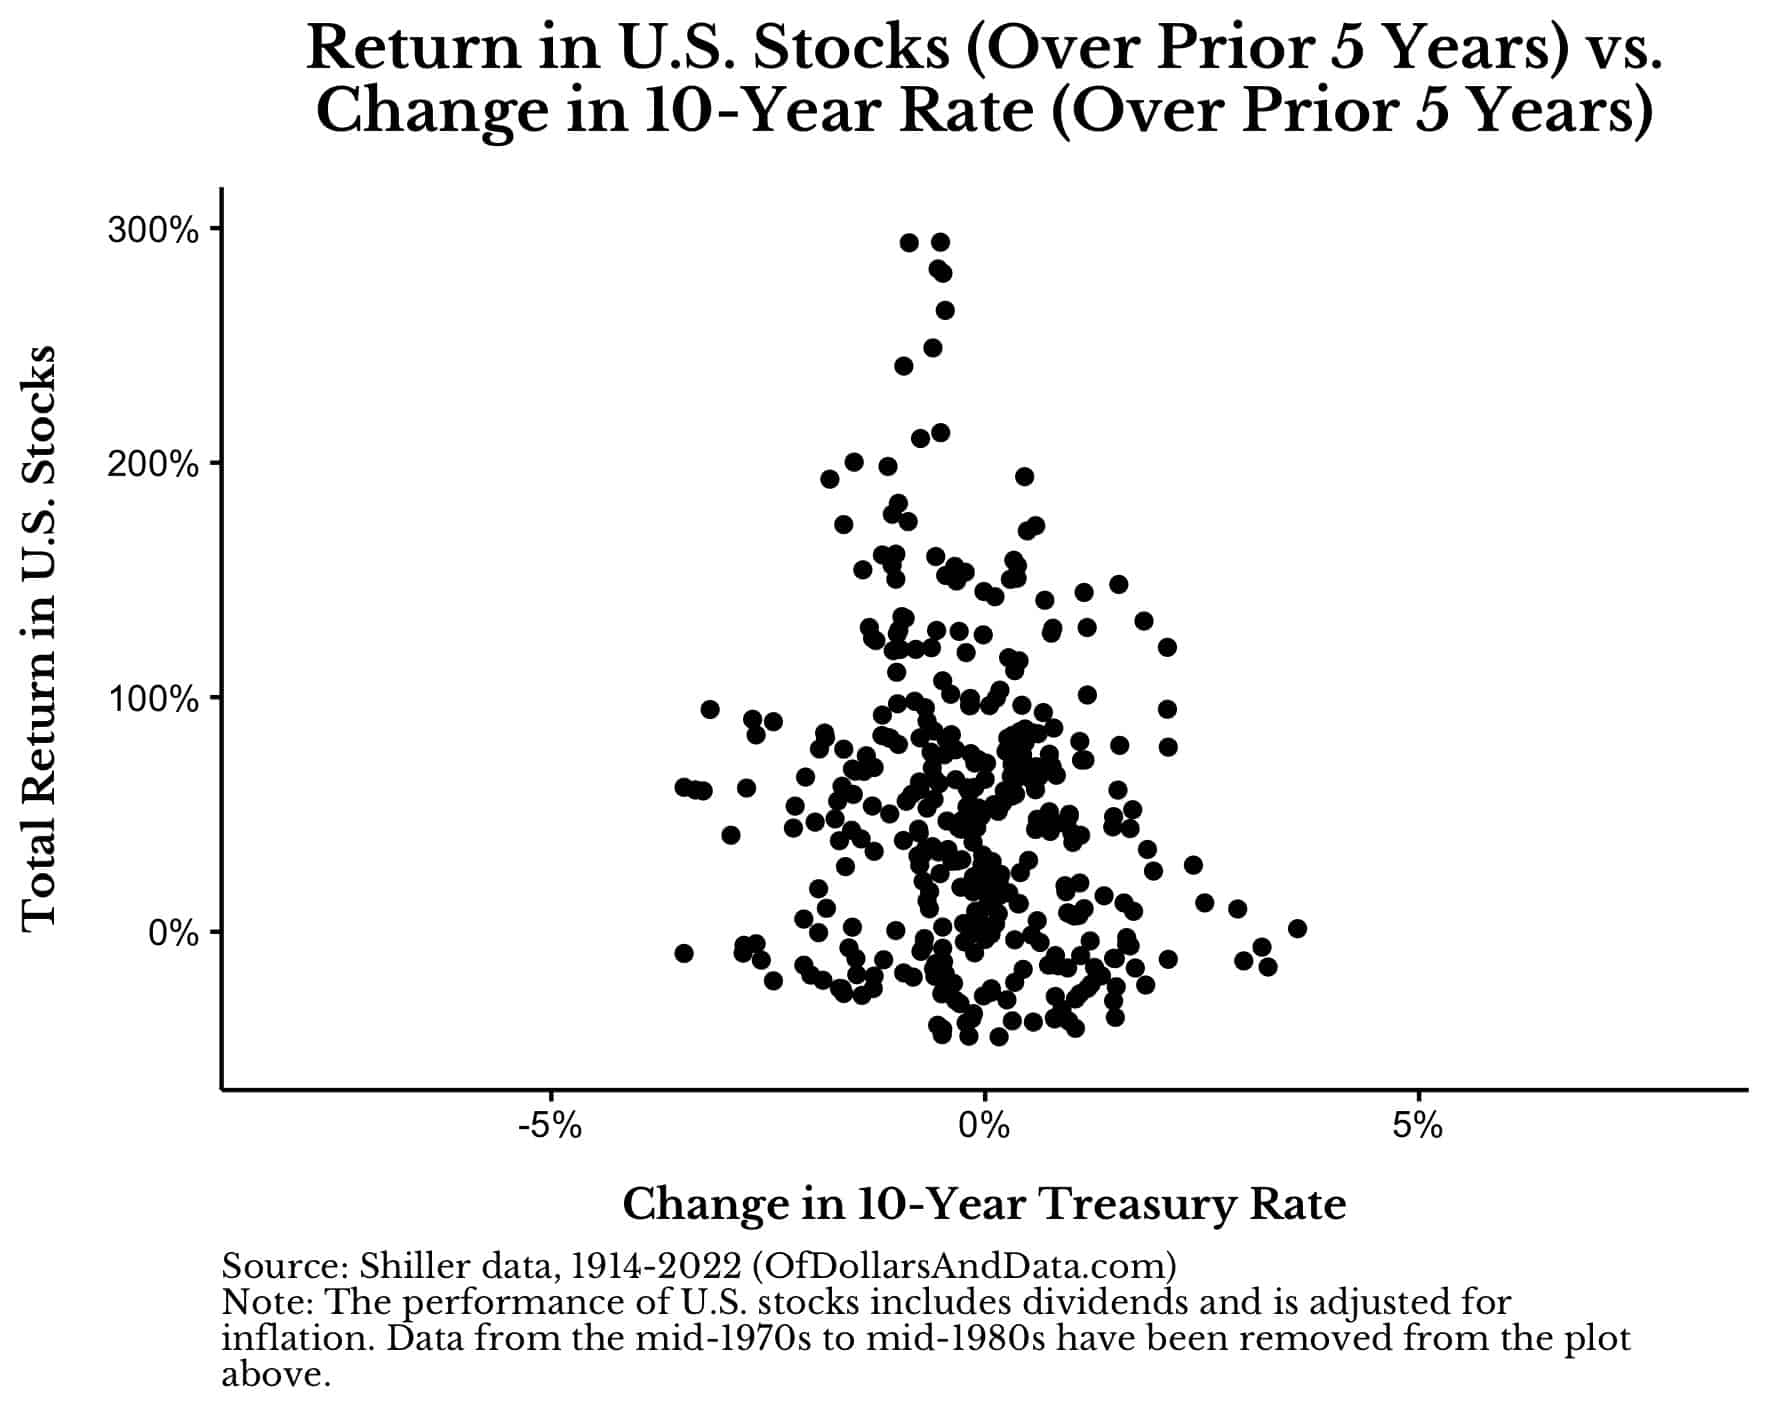
This suggests that most of the impact that declining interest rates had on stock prices occurred during this outlier period. Once you remove it, the connection between rates and stock performance isn’t as straight-forward.
We would come to a similar conclusion if we compared real U.S. stock returns with the change in the 10-Year Treasury rate by decade starting in the 1920s as well:

Though there are many decades where rates declined and stocks surged, this isn’t always the case. For example, in the 2000s the 10-Year Treasury rate decreased by 3% yet U.S. stocks fell by 3% annualized by the end of the decade. In addition, from January 1940 to December 1969, the 10-Year Treasury rate increased from 2.2% to 7.7%, yet U.S. stocks grew by 8.2% annualized (in real terms) over the same time period. The change in interest rates isn’t always the full story.
If Not Interest Rates, Then What?
If declining interest rates don’t reliably impact stock prices, then what else is driving returns? One word—earnings.
To demonstrate this, let’s look at the percentage change in real price and real earnings of the S&P 500 from May 1997 to September 2022 (the latest data available):
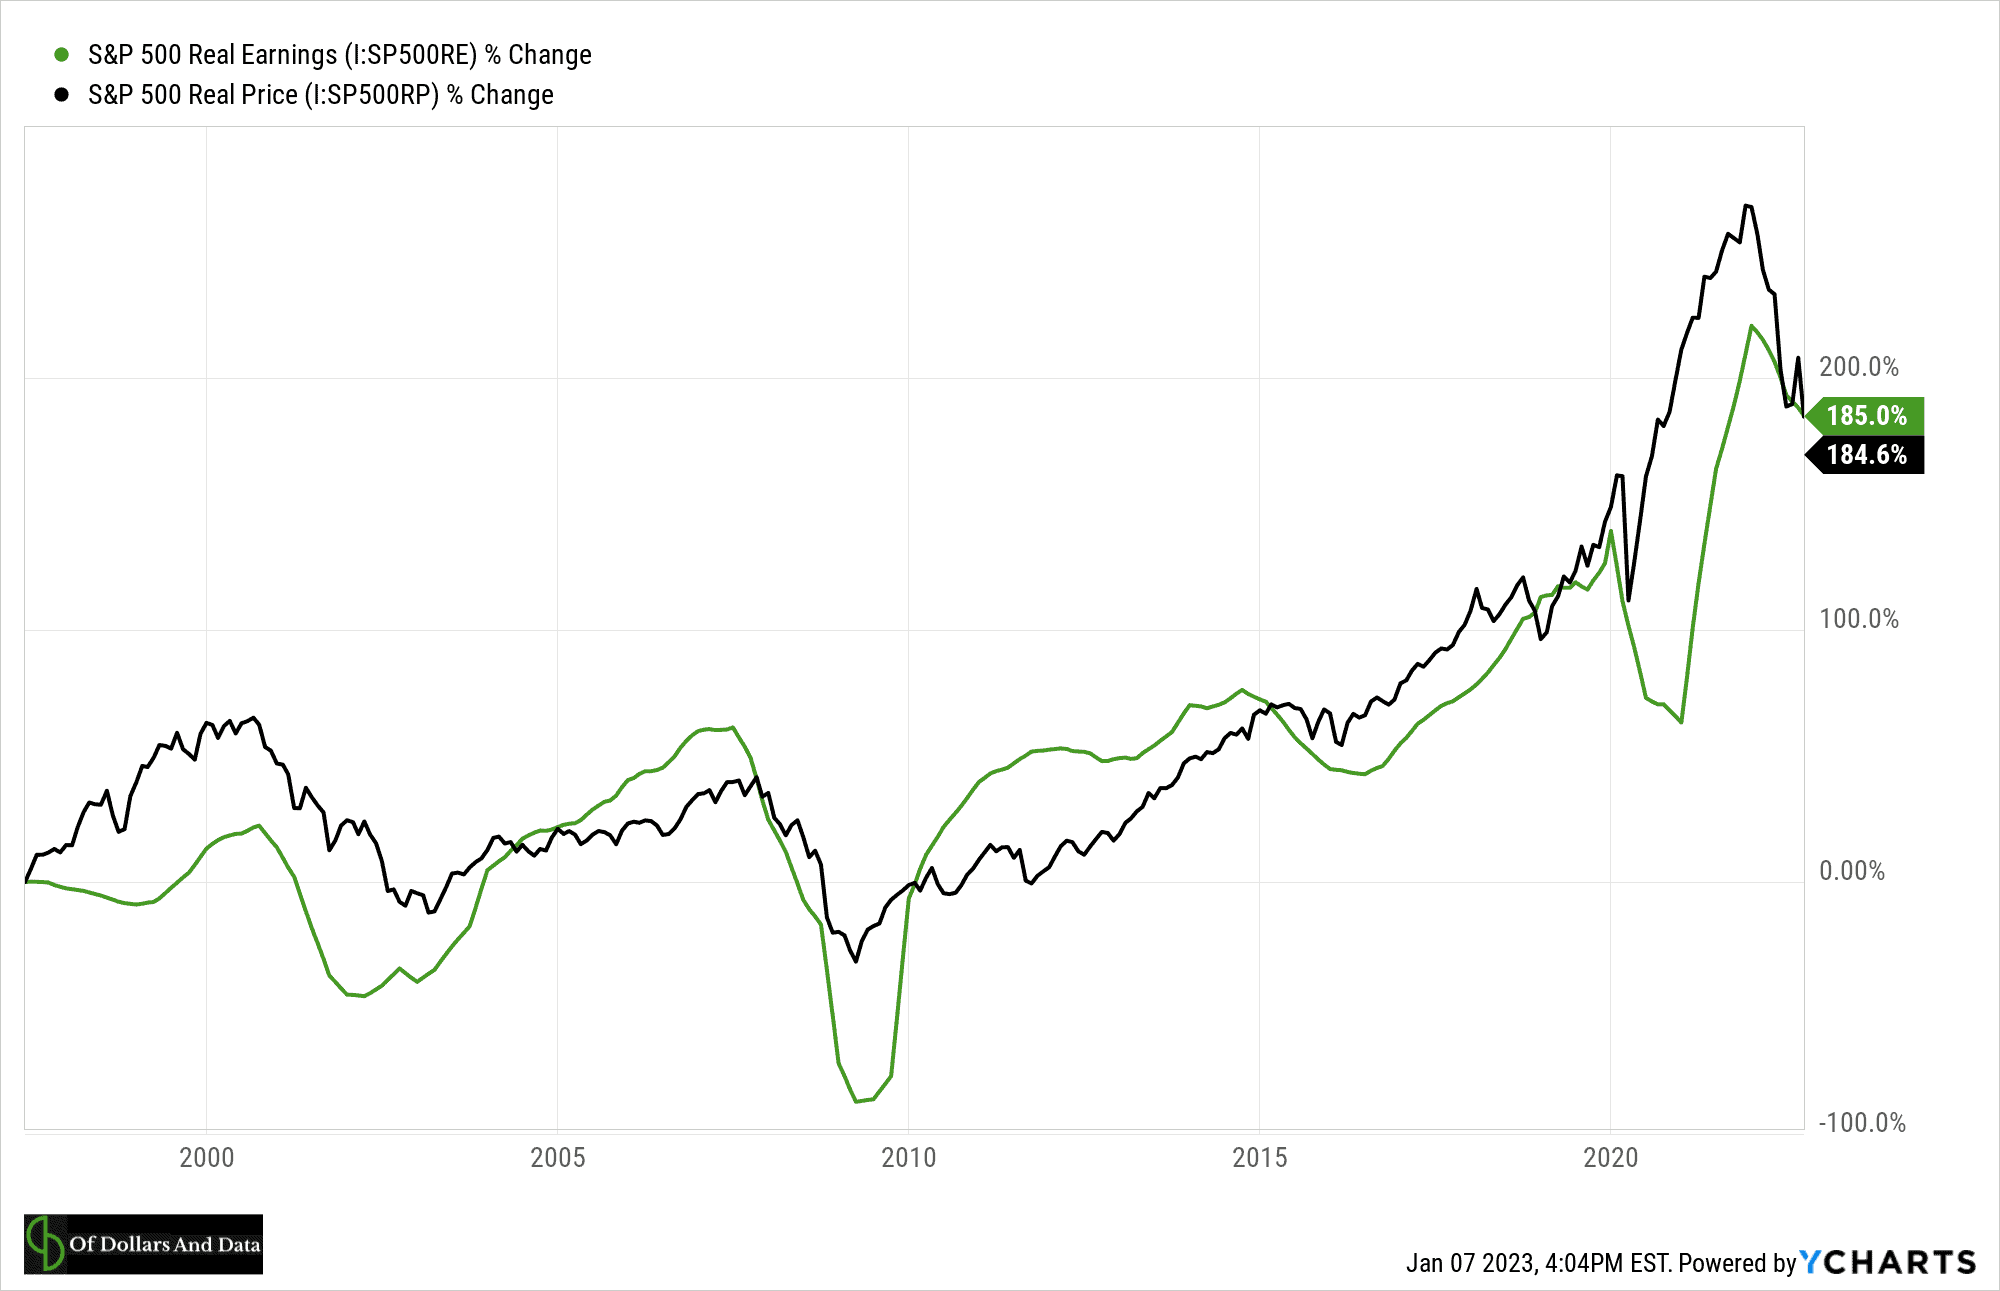
As you can see, the total changes in real prices and real earnings of the S&P 500 are basically identical over this time period. This is true despite the fact that the 10-Year Treasury rate decreased from 6.7% in May 1997 to 3.5% by September 2022. This suggests that the increase in stock prices during this time can be attributed almost entirely to earnings growth and not necessarily to the decline in interest rates.
Of course, declining interest rates could increase earnings growth by stimulating economic activity, but that’s much harder to prove. However, there are times when declining interest rates lead to increased stock prices that aren’t hard to prove.
For example, if we were to plot the percentage change in real price and earnings of the S&P 500 from September 1982 to May 1997 (the period before the period above), we would see that earnings growth was not responsible for most of the increase in stock prices:
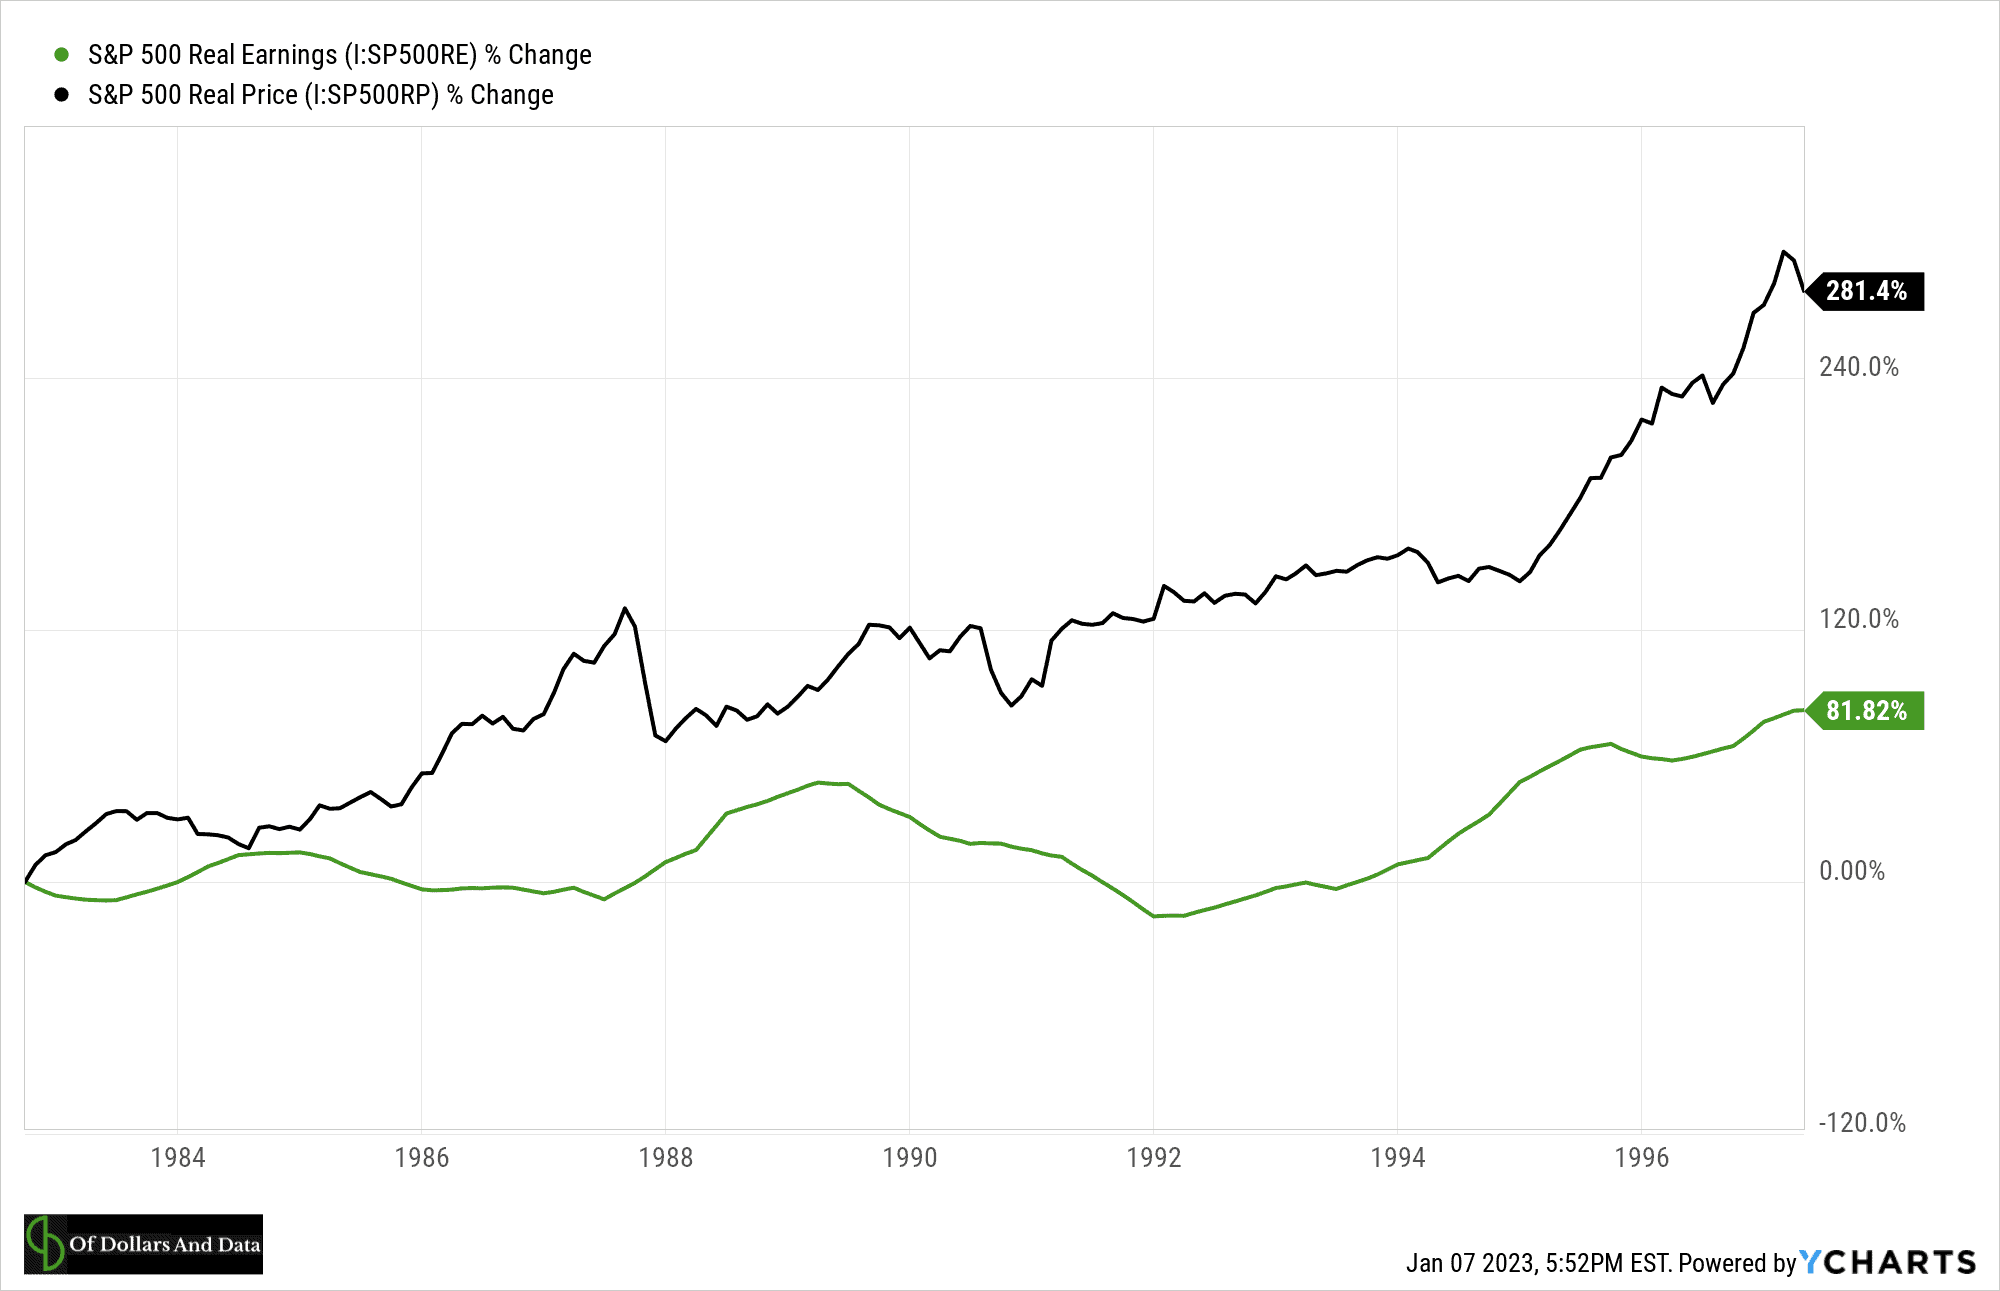
Over this time period, the 10-Year Treasury rate declined from 12.3% to 6.7% and stocks became more attractive as a result. And, as stocks became more attractive, investors started bidding up their prices more quickly than earnings were rising. This is known as multiple expansion or an increase in valuations. In other words, investors were willing to pay more for the same amount of earnings.
I can say the same thing about the early 1980s to the mid-1990s. This is the only period over the past four decades that I can say with certainty was influenced by a decline in interest rates. All of the growth in the stock market since this point (May 1997 onward) could, technically, be attributed to earnings growth (as demonstrated above).
While reality is far more complex than this, my analysis suggests that declining interest rates are far more important at the extremes. When the 10-Year Treasury declined from 15.3% in September 1981 to 6.7% by May 1997, that increased stock multiples much more than any rate decline that came after.
We can see this clearly if we look at the cyclically-adjusted price-to-earnings ratio (“CAPE”) from Robert Shiller over this time period. As a reminder, the CAPE is a measure of how much investors are willing to pay for a given amount of earnings. So a CAPE of 10 means that investors are willing to pay $10 for every $1 of earnings and a CAPE of 20 means investors are willing to pay $20 for every $1 of earnings, etc.
The CAPE hit a low of 6.64 in August 1982 and rose to nearly 30 by May 1997, making it one of the greatest multiple expansions in U.S. stock history. Today, the CAPE is around 28, meaning that valuations multiples haven’t changed much since May 1997 though the 10-Year Treasury rate has declined from 6.7% to 3.5% over the same time period.
The Bottom Line
While declining interest rates have been responsible for stock growth (at least at the extremes), interest rate changes don’t always determine our investment destiny. What does though? Fundamentals.
For 2023 and beyond, fundamentals (i.e. earnings growth) will be far more important for future stock prices than they were in the early 1980s. Since interest rates are much lower today than they were in the past, we are unlikely to see a rate-induced multiple expansion like we did four decades ago. As a result, our stock portfolios will need to grow based on one thing and one thing alone—increased earnings.
I understand why this doesn’t seem likely given our current business climate. However, the economic pain we are experiencing today (i.e. layoffs, etc.) may be necessary to get to a brighter future. Either way, I’m not changing my investment strategy whatsoever. The continual purchase of a diverse set of income-producing assets will proceed unabated.
Happy investing and thank you for reading!
If you liked this post, consider signing up for my newsletter.
This is post 330. Any code I have related to this post can be found here with the same numbering: https://github.com/nmaggiulli/of-dollars-and-data

