You likely do not remember it, but the year you were born had a larger impact on your future investment success than you can imagine. Why? Because the investment industry has a secret:
Luck matters a lot more than you think
And I am not just talking about people who pick stocks and get lucky. I am talking about the variation in asset returns that also affects passive investors. Luck is so important that two investors holding the same assets over different time periods can have wildly different investment outcomes. This implies that even if you followed all of the best investing advice by diversifying, rebalancing, having a high savings rate, etc., you could still end up with a less than stellar outcome. Alas, the investment disclaimer heard around the world:
Past performance is no guarantee of future results.
Before I address what you can do to take advantage of your luck, let’s consider the S&P 500 returns from 1901 to 2010. If we were to examine the 20 year returns starting in each decade from 1901 to 1981 (i.e. 1901–1920, 1911–1930, etc.), we could see how different starting periods affected your total returns. For this next plot I do this exact exercise by starting each decade at the same point (i.e. an index of 100) and seeing the returns unfold over time. Note that the year label you see on the far right side of the plot is the starting year for that 20 year period. More importantly, you will see quite a divergence in outcomes based on the starting year:
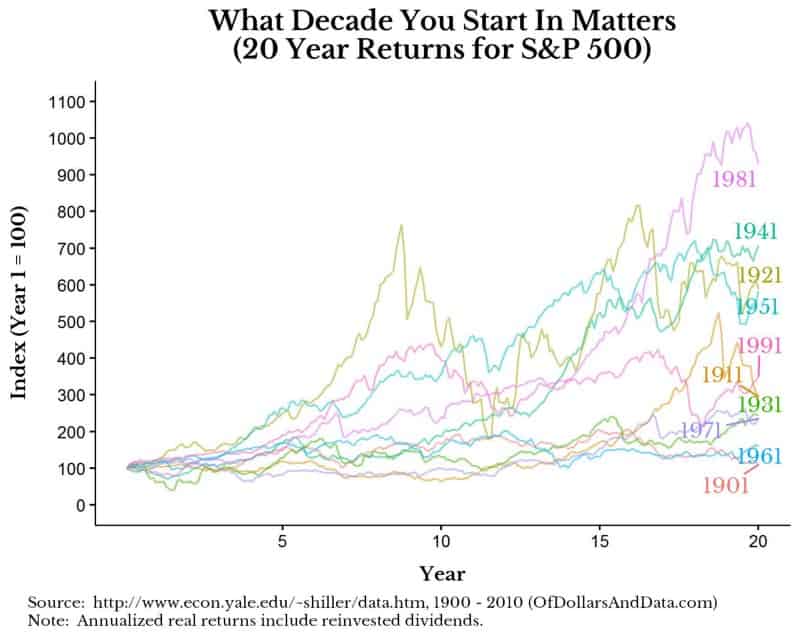
As you can see, the 20 year period with the best returns was 1981–2000 and the 20 year period with the worst returns was 1901–1920. The more important point is that there is no general pattern across the decades.
You might be thinking that over a 20 year time period there is random variation, but over longer time periods this should average out somewhat. Fair point. I have already shown how returns converge over longer periods of time, so maybe longer time periods exhibit less random variation. Let’s look at the same plot, but over a 40 year time period (i.e. a typical investment life):
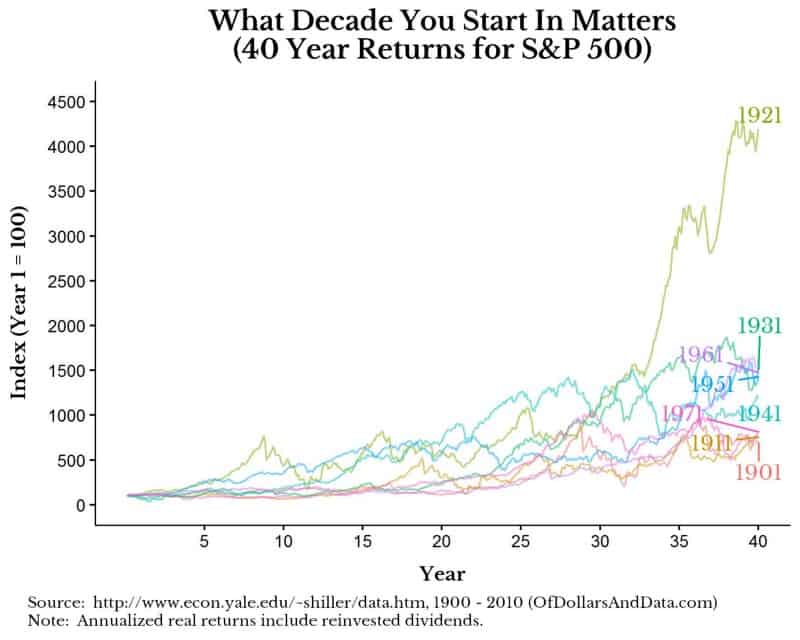
Nevertheless, the 40 year return periods still have quite a bit of variation. This means that someone born in 1880 who started investing at age 21 from 1901–1940 would have done far worse than someone born 20 years later who started invested from 1921–1960. This is true despite the fact that the 1921–1960 period contains the Great Depression and WWII. This illustrates how returns are proportional to the risk borne by investors. When everyone thinks the world will end, you will be rewarded if it doesn’t.
Despite the results above, my analysis is still problematic as it is only showing the variation of one risky asset class. But, guess what? Even if we include bonds, the divergence in outcomes by decade is still present, though to a lesser extent. I did the same exercise as the one above using a 50% stock, 50% bond portfolio. I use Aswath Damodaran’s S&P 500 and 10 year Treasury bond return data which covers the 1928–2016 time period. After adjusting the data for inflation, the 20 year returns separated by decade from 1931–1991 are shown below:
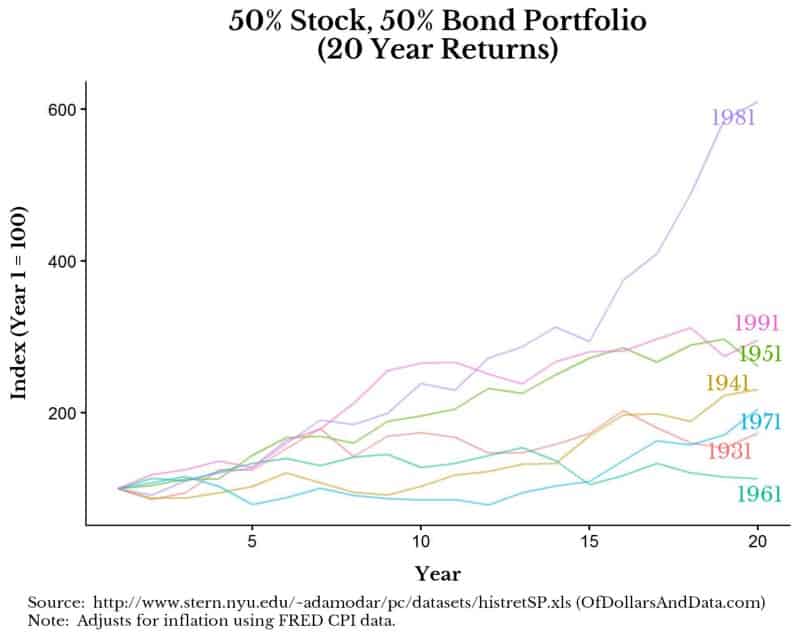
While it is true there is less variation by adding in bonds compared to an all stock portfolio, the amount of variation still surprised me (i.e. between no real return and a 6x real return over all 20 year periods).
Plotting the 50–50 portfolio over 40 year periods also shows variation, but to a lesser degree:
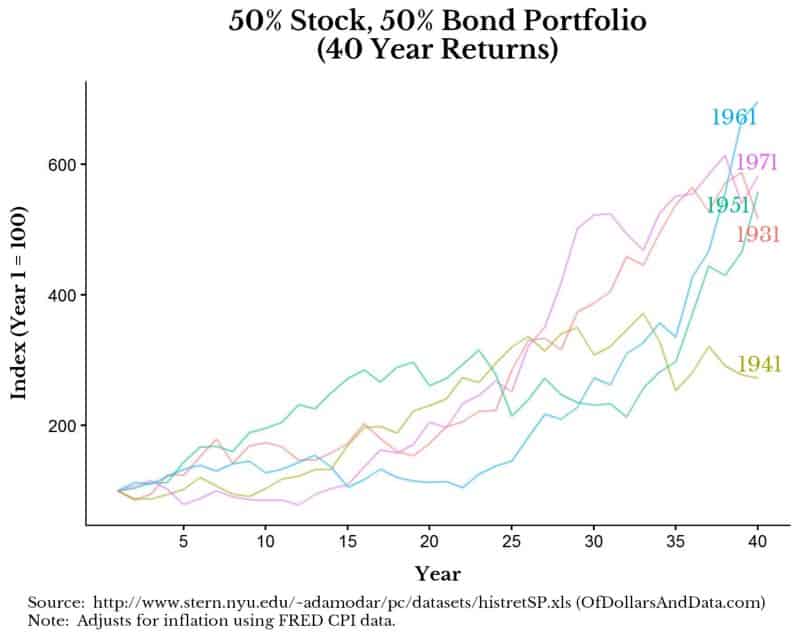
When I first saw this plot I thought the data were incorrect. The 40 year returns of the 50–50 portfolio seemed shockingly low (i.e. 3x-7x times your initial investment over 40 years) compared to the 100% stock portfolio(i.e. 4x-45x your initial investment over 40 years), but the data checks out. This illustrates how superior U.S. stock returns were compared to U.S. bond returns in the 20th century. There is no law stating that this relationship has to hold going forward, but I hope you can see how much random luck (i.e. your birth year) has an impact on your investment outcomes.
How to Take Advantage of Your Luck
This post may seem to suggest that your investment success is completely out of your control, but this could not be further from the truth. Yes, there is some luck in your outcomes, but your investments are more in your control than you can imagine. As an investor you get to decide:
- Which assets you invest in
- Which proportions to invest in each asset
- When/how often to buy
- How much to save
All of these things will likely influence your investment success more than your birth year. However, luck still plays a role.
If you want to learn more about how much of your life is determined by chance, I highly recommend: The Drunkard’s Walk: How Randomness Rules Our Lives. For a crash course on where to invest when your investing, please read my post covering this topic in great detail. I wish you all the best in your investment journey. Thank you for reading!
If you liked this post, consider signing up for my newsletter.
This is post 21. Any code I have related to this post can be found here with the same numbering: https://github.com/nmaggiulli/of-dollars-and-data

