How many times have you heard something like this:
If you start saving $300 a month at age 25, by the time you’re 60 you’ll be a millionaire.
While not technically false (assuming you could earn a 9.5% return each and every year), such statements make it seem as if it’s easy to become a millionaire. They imply that anyone can do it.
Unfortunately, these thought experiments rely on two big assumptions: (1) what you save over time doesn’t change, and (2) your rate of return is high and consistent every year. However, we know that both of these are empirically false. Incomes (on average) tend to rise as people get older (which means savings rates tend to be variable over time) and market returns are rarely average.
So, what if we fixed these assumptions and provided a more realistic view of how people save over time? Rather than theorize about whether the typical person could become a millionaire with a fixed saving amount and constant investment returns, why don’t we use historical data to see what could’ve actually happened instead?
Thankfully, we can. By using the Federal Reserve’s Survey of Consumer Finances, which provides a financial snapshot of U.S. households every three years, we can test these thought experiments. If we examined households when their first snapshot was taken (in 1989) up through their latest snapshot (in 2022), we would have 33 years of data to rely upon. That’s almost a household’s entire investment time horizon!
While this data won’t follow the same set of households over time, it will allow us to follow households in the same age cohort over time to see how they are doing (as a group). From here, we can then simulate what that typical household would’ve needed to do to become a millionaire.
But before we can do that, we must first understand what a typical household’s income has been over the past few decades.
What is the Typical Household’s Income?
Imagine the year is 1989, you’re 20-24 years old, and you earn an average salary (i.e. the median of all households in your age group). Assuming you continue to earn the median household income going forward, what would your income have been through 2022?
Using the SCF data, your inflation-adjusted household income would’ve been about $23,000 in 1989 and would have risen to about $90,000 by 2022. You can see the real (inflation-adjusted) median household income for all the households in this age cohort (born 1965-1969, aka aged 20-24 in 1989) in the chart below:
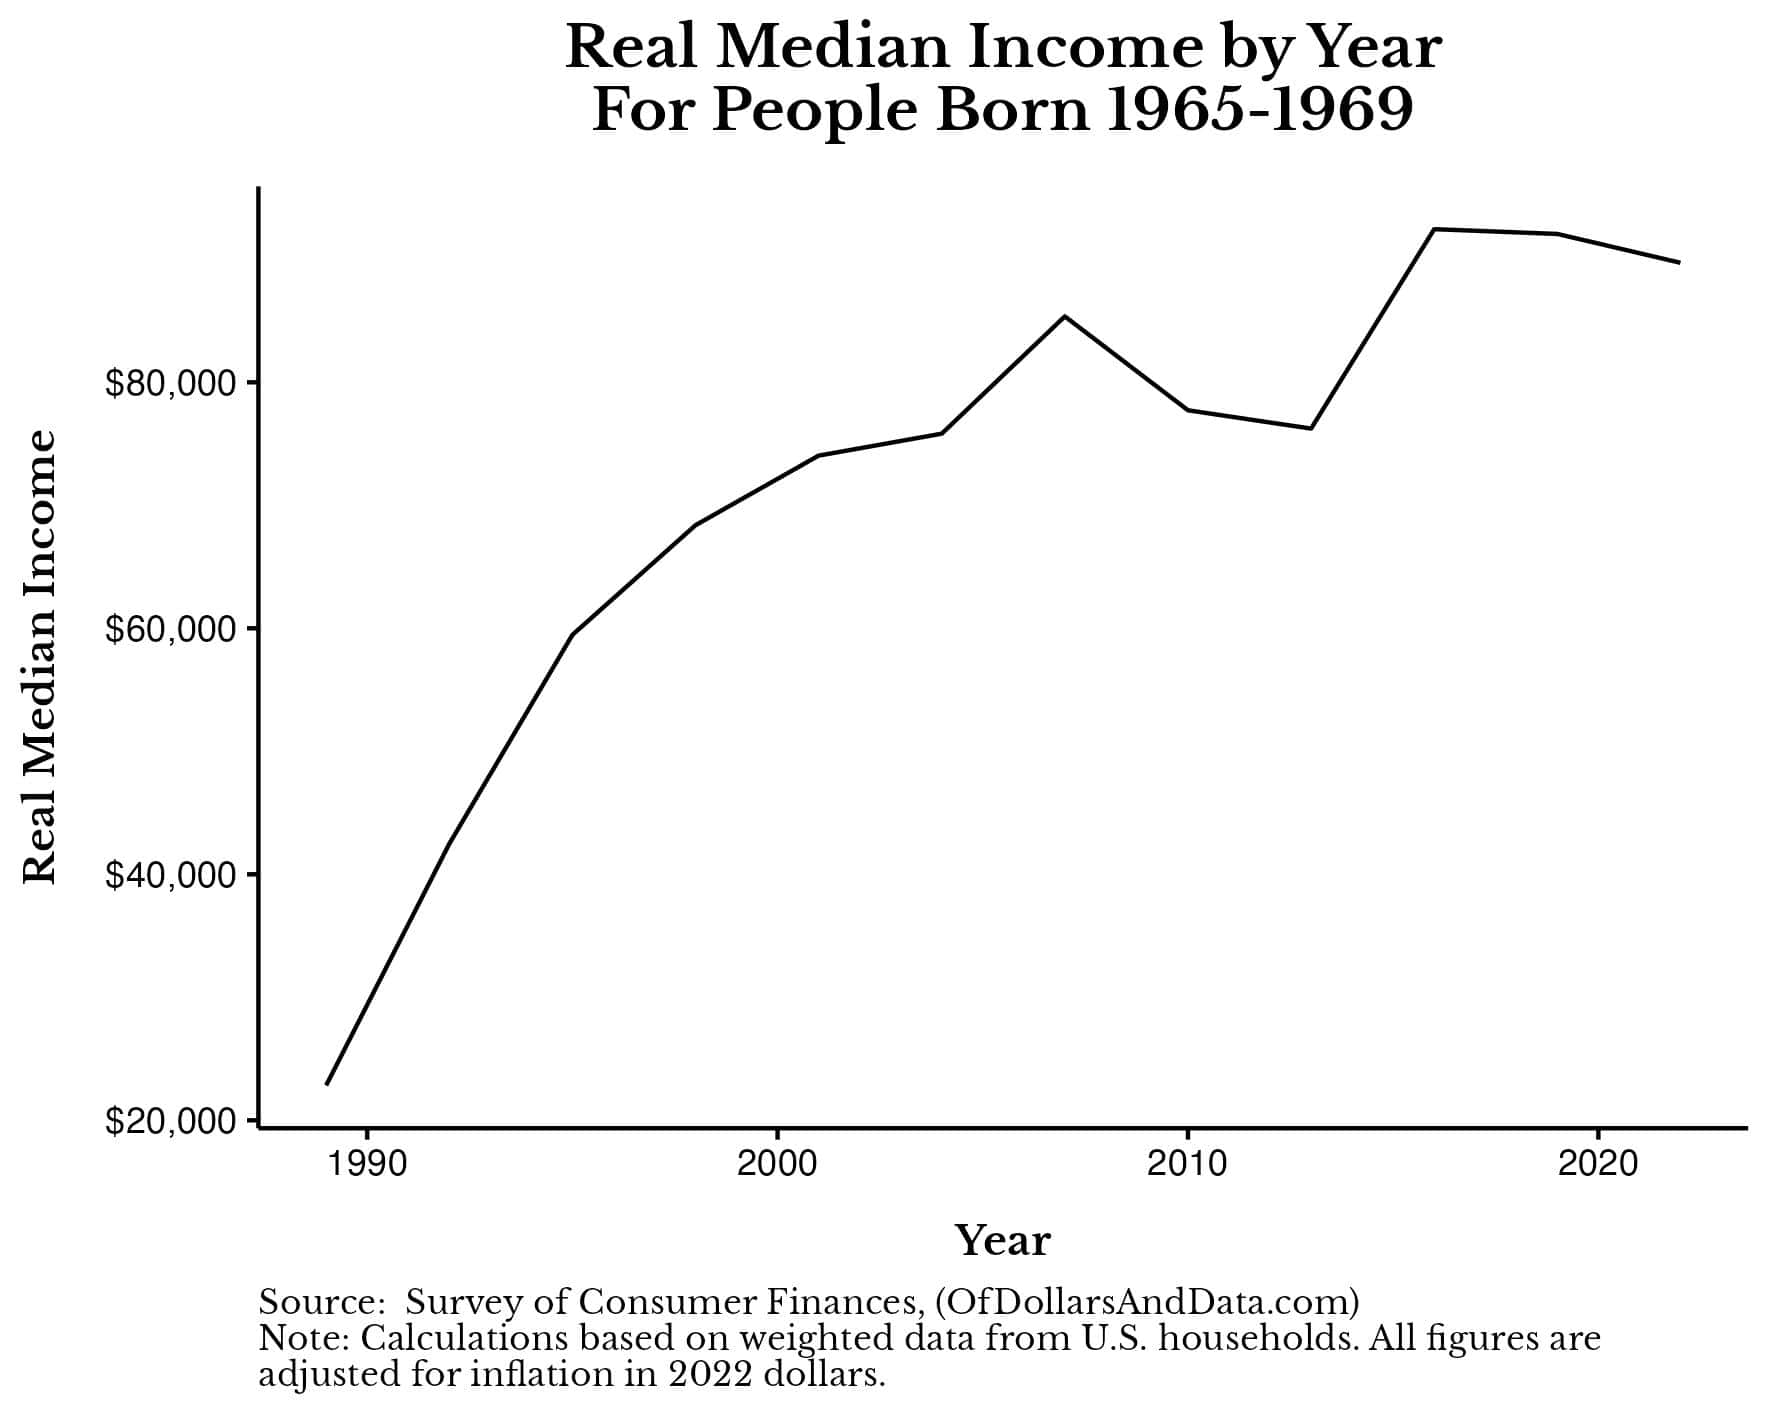
As you can see, the real median household income for this cohort rose the quickest in the 1990s to mid-2000s and has leveled off since.
Given this change in income over time, you can see why saving $300 a month in 1989 would have been much harder than saving $300 a month in 2022. If we want to realistically model how the typical person builds wealth over time, we should be adjusting for these changes in income. For this, we turn to our next section.
How Much Wealth Might the Typical Household Build?
Now that we have an idea of how much income the typical person had going back in time, the question becomes: how much wealth could they have built with this income stream?
While the answer depends mostly on their savings rate, let’s put that aside for a moment and make the following assumptions about our typical household:
- They invest all of their savings in a U.S. stock/U.S. bond portfolio and rebalance it annually.
- Their portfolio starts at 95% U.S. stocks/5% U.S. bonds in 1989 (when they were age 20-24).
- Each year they reduce the stock weighting in their portfolio by 1% when they rebalance. For context, by 2022 (when they are age 53-57) their portfolio would be 62% U.S. stocks/38% U.S. bonds.
- They pay no taxes on their investments and also pay no transaction fees. I will address these before we are done.
With this set of assumptions, the only thing we have left to solve for is our typical household’s savings rate. Rather than just provide one savings rate, I came up with a few different savings strategies that our typical household could employ over their financial life:
- Save a Fixed Percentage Each Year. While this is the simplest method for saving money, it can be difficult to implement, especially for those with lower income. Since incomes tend to rise over time (as illustrated in the prior section), this means that higher income households should be able to save a larger percentage of their income than lower income households. We see this trend in the data as well.
- Save 1% to Start and Go Up 1% Each Year Until at 20%. This method allows for a ramp up in savings over time, but 20% may be too high of a savings rate for some households.
- Wait Until Income is Above A Threshold, Then Start Saving a Fixed Percentage. This method allows for a sufficient income to be reached before needing to save. However, because it doesn’t alter the savings rate over time this could lead to under-saving.
When I tried a few of these savings strategies using the actual median income for our typical household over time (see above), here’s what the final portfolio value was in 2022 (adjusting for inflation):
- Save 5% of Income Each Year: $303,373
- Save 10% of Income Each Year: $606,747
- Save 15% of Income Each Year: $910,121
- Save 1% to Start and Go Up 1% Each Year Until at 20%: $770,330
- Save 5% Once Income is Above $50K: $241,667
Note that all of these savings rates are based on pre-tax income and that any money saved experienced the actual inflation-adjusted returns for U.S. stocks and U.S. bonds over this time period. For context, from 1989-2022, U.S. stocks returned about 7.4% per year while U.S. bonds returned about 2.9% per year after inflation.
The figures above represent how much wealth a U.S. household with a typical income would’ve built if that had saved in a particular way from 1989-2022 while investing their savings in portfolio of U.S. stocks and U.S. bonds.
The big thing to notice about these final portfolio amounts is that none of them are above $1,000,000. This is true even after 33 years of saving and investing in a portfolio of U.S. stocks and U.S. bonds. For some context, the strategy that gets closest to a $1 million portfolio (Save 15% of Income Each Year), would’ve require saving about $1,125 a month in 2022 (the final year of the simulation). This is nearly 4x more than the “$300 a month” cited at the start of this article.
More importantly, in all of our simulations we assumed that our typical household didn’t pay any tax or transaction costs along the way. Once we include these costs, the final portfolio amounts above would have been even lower, probably by 15%-20%.
But let’s move past what could have happened with our typical U.S. household over this time period and see what actually happened with their wealth instead.
How Much Wealth Did the Typical Household Actually Build?
While my thought experiment about building wealth is fun and all, thankfully we can compare it to what actually happened to see how off my figures were. So, how much wealth did the typical household (age 20-24) actually build from 1989-2022?
About $275,000.
From 1989-2022, the real (inflation-adjusted) median net worth of these households increased from about $4,000 to $279,000:
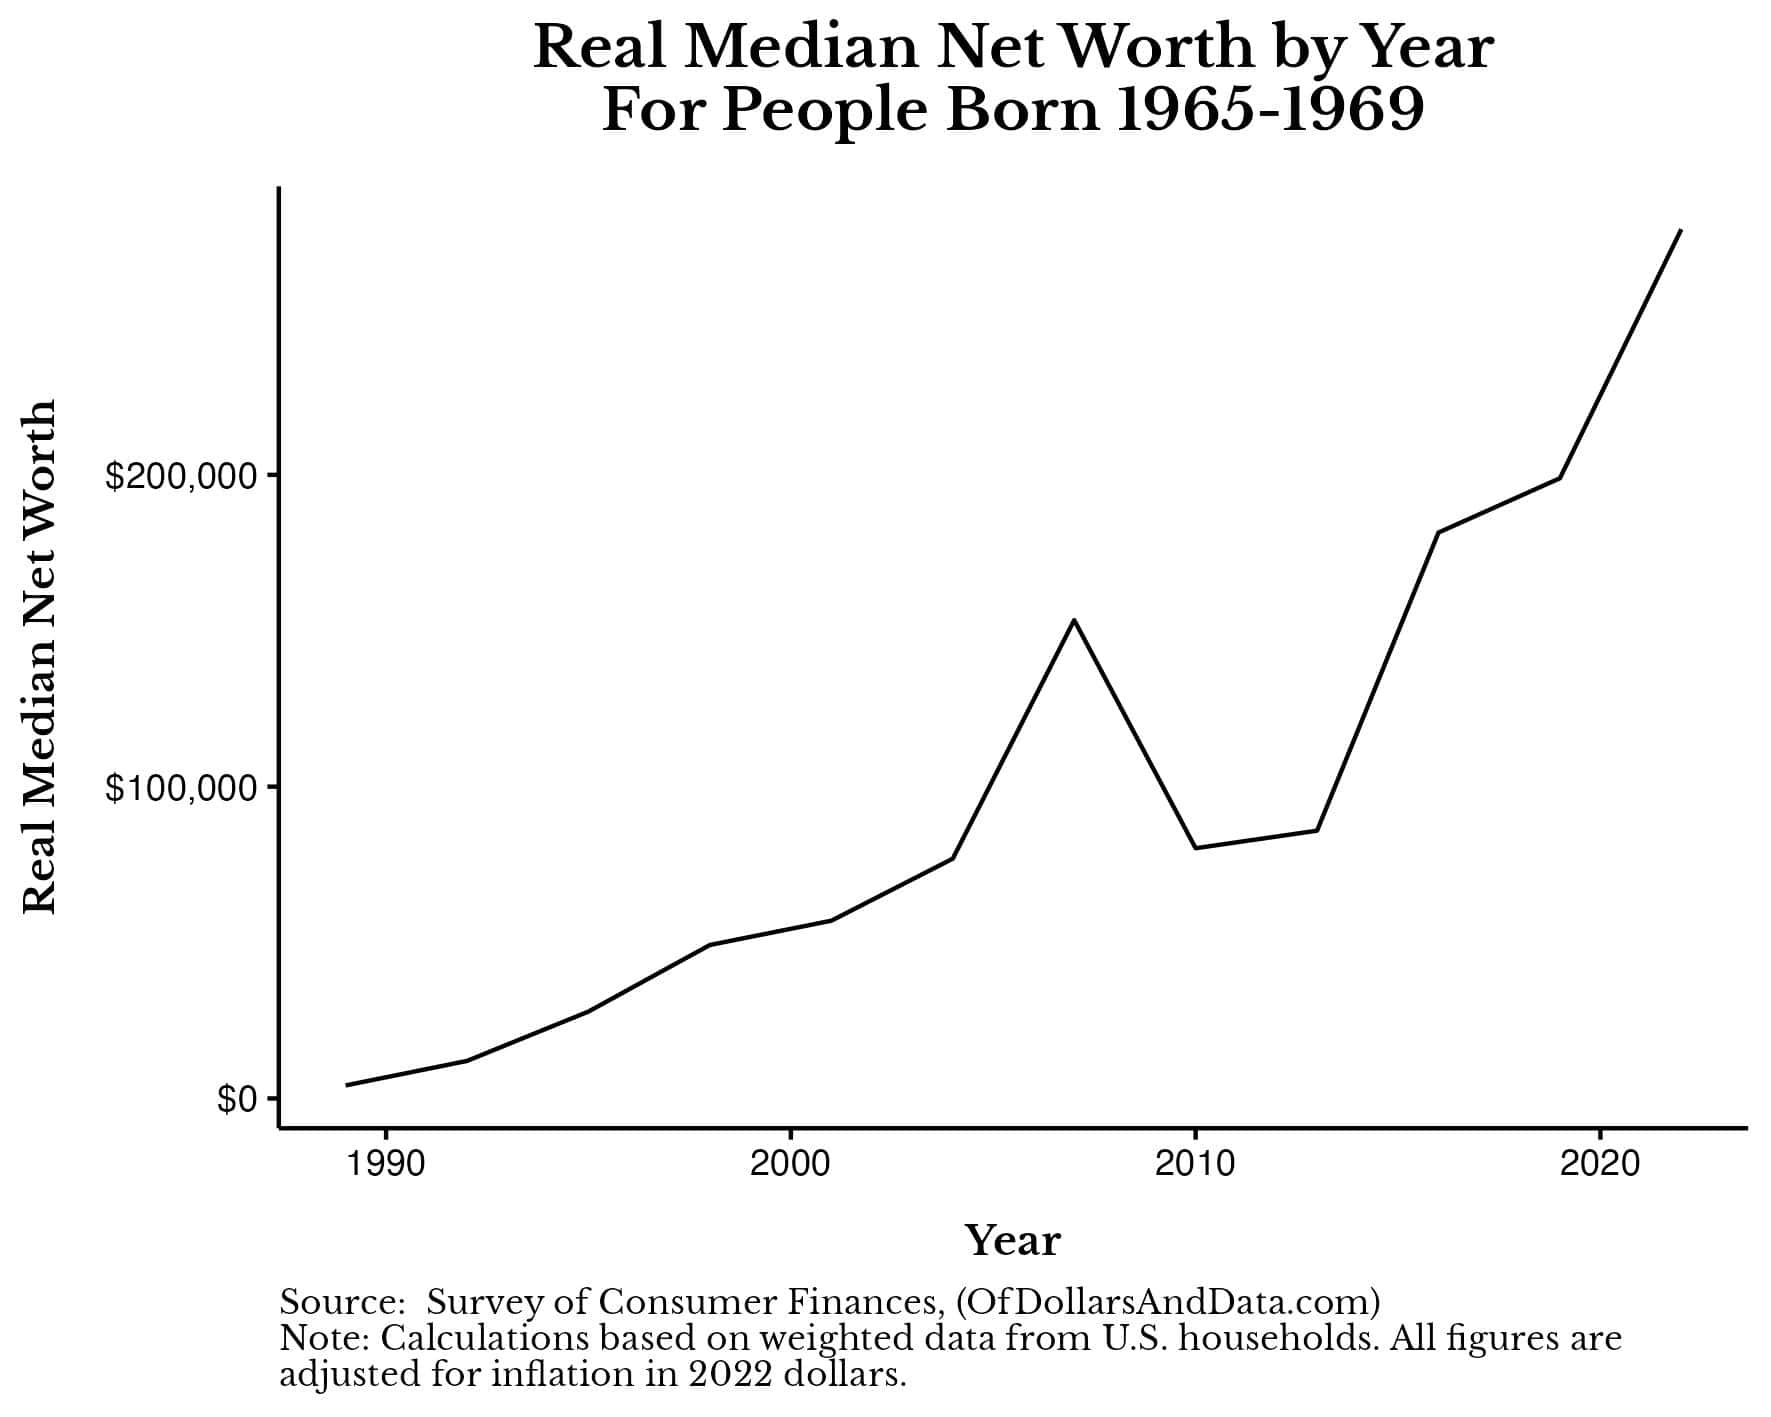
Note that the net worth in 2022 ($279,000) is close to the amount in our thought experiment where the median household saved 5% of their pre-tax income each year and invested it in a portfolio of U.S. stocks and U.S. bonds ($303,373).
Because of this similarity, we can infer that the typical household in our cohort (born 1965-1969) saved (on average) 5% of their pre-tax income from 1989-2022. This isn’t exactly true since the typical household didn’t invest solely in U.S. stocks/bonds over this time period, but it’s a rough approximation.
Technically, the typical U.S. household in this cohort bought a home sometime in their mid 30s/early 40s and saw their home equity values go up with it:
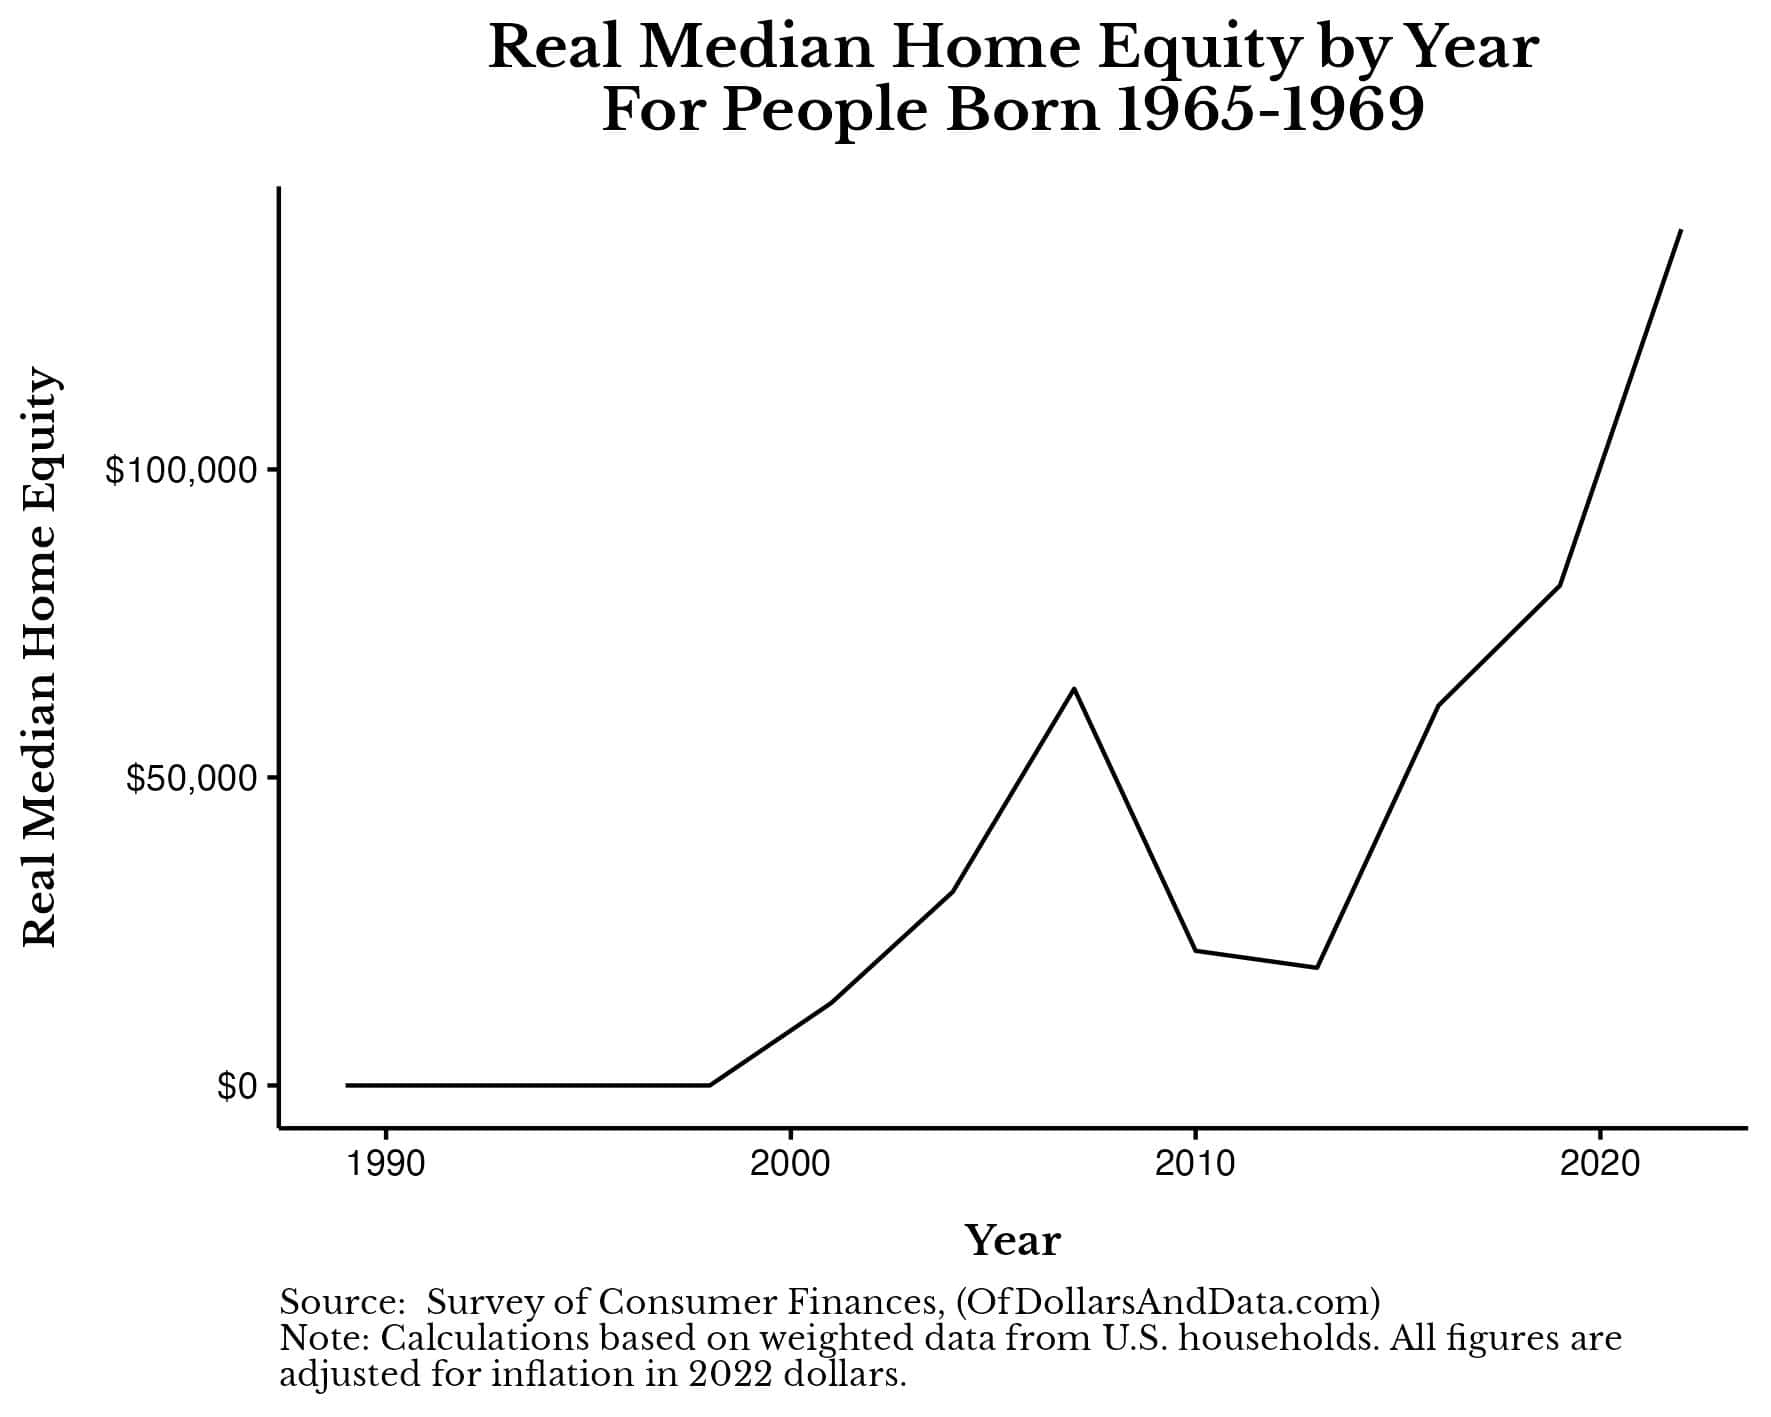
This cohort of households tends to have a bit more home equity than they have in financial assets, based on the median amount this group owned over time:
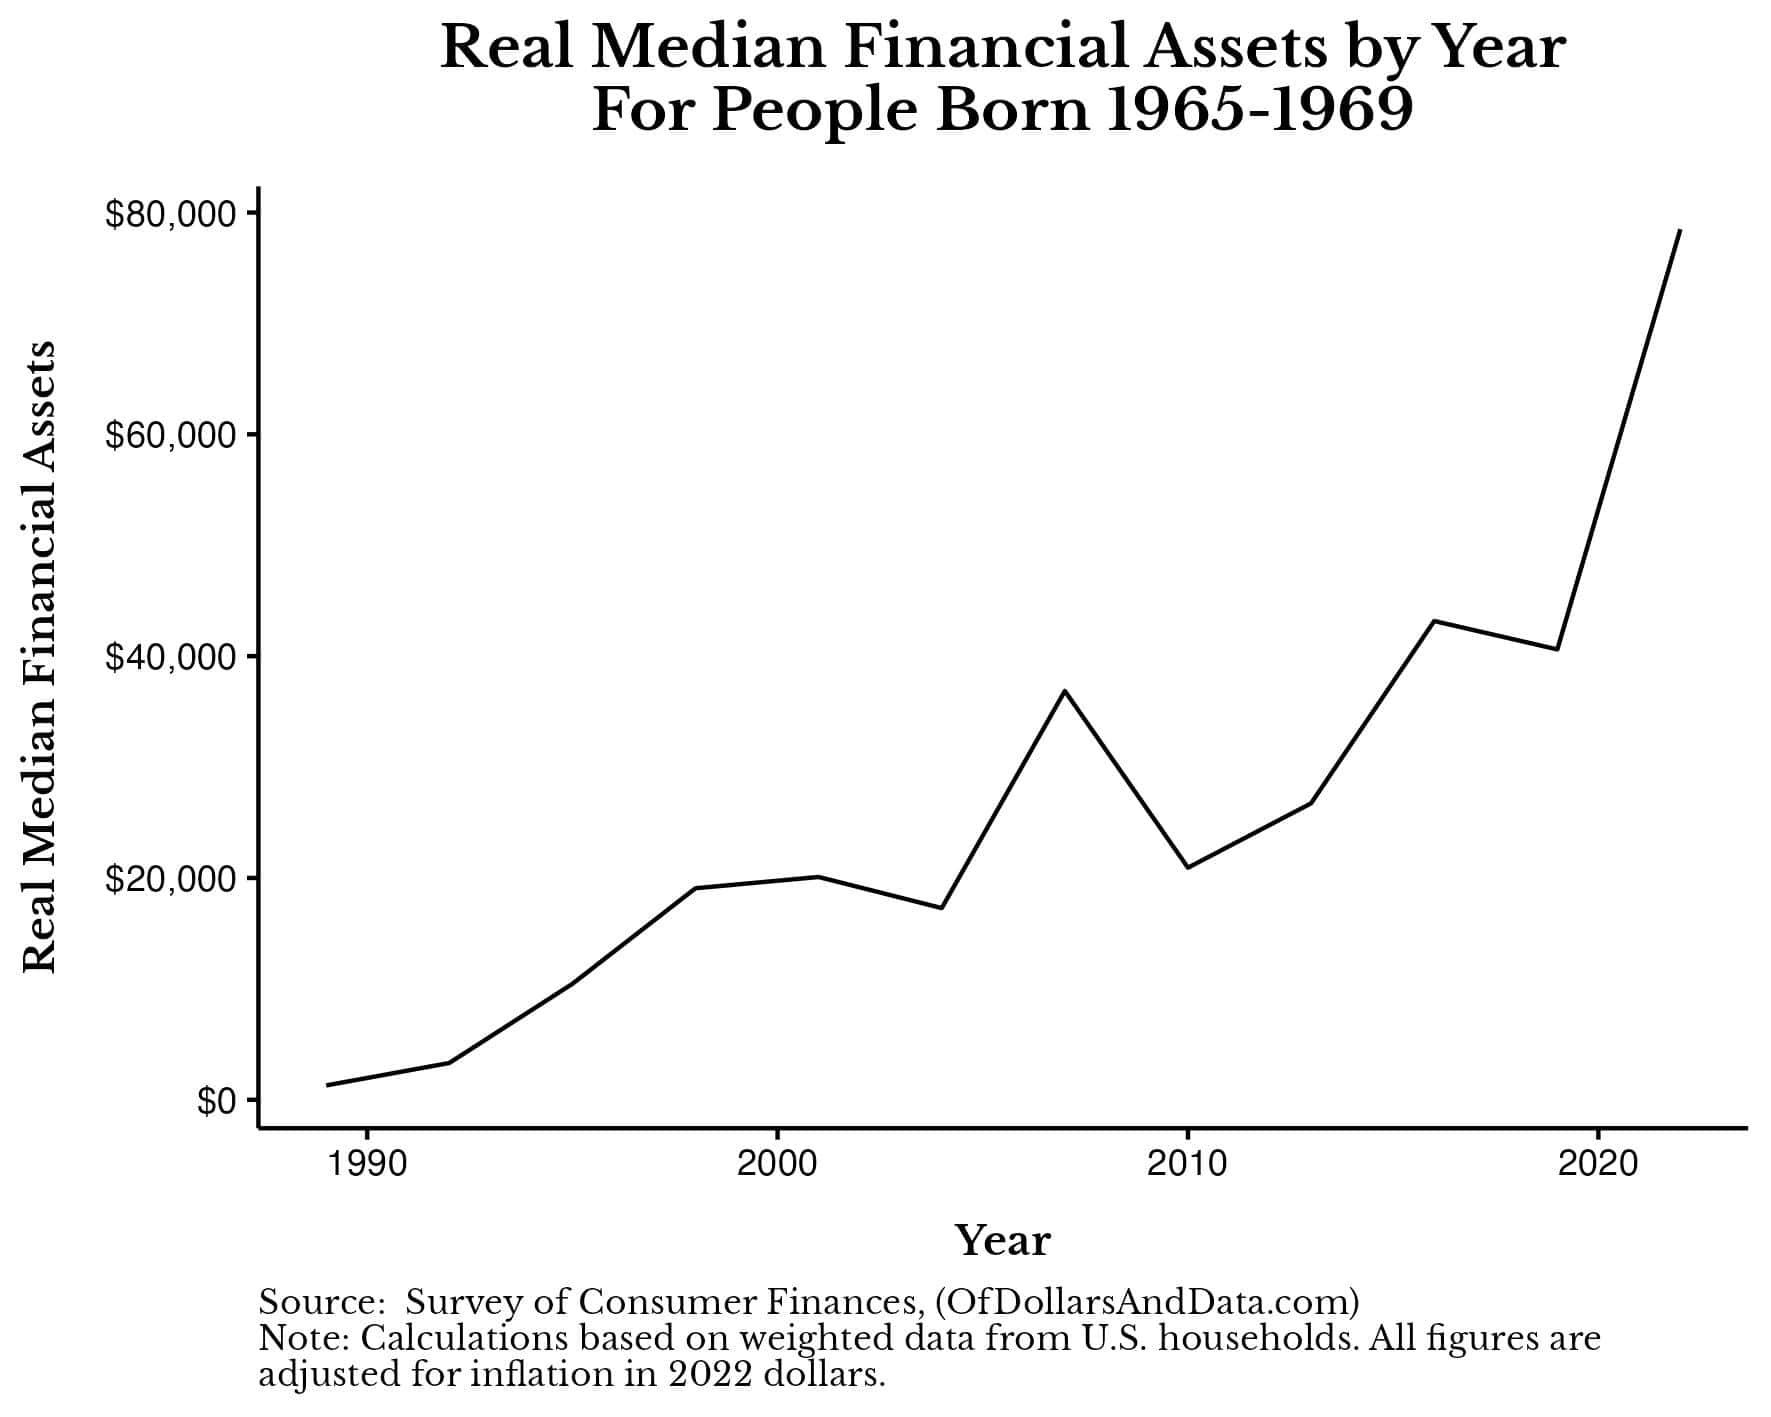
To provide some context, for a typical household in this cohort to have $79,000 in financial assets in 2022, they would’ve needed to save about 1.3% of their pre-tax income each year (while investing a portfolio of U.S. stocks/U.S. bonds).
This demonstrates that the typical U.S. household tends to put more of their savings into non-financial assets than financial assets. While this isn’t a problem in itself, it may partially explain why the typical U.S. household hasn’t built as much wealth as we might have imagined.
Atypical Results Require Atypical Actions
Whether we look at the simulated results or the actual wealth for our given cohort of U.S. households, you can see that they weren’t close to becoming millionaires. This bitter truth suggests that the typical American household has to do a bit more if they want to reach such a large wealth milestone. In other words, atypical results require atypical actions.
These actions could include: raising your income, cutting your spending, or increasing your annual returns—options that are anything but easy.
Unfortunately, this isn’t the message that is broadcast by some in the financial industry. Instead, they will claim that a small monthly payment or a simple allocation change are all you need to get wealthy. As I’ve shown above, this couldn’t be further from the truth. The numbers don’t lie. The math isn’t mathing.
So, can the typical person become a millionaire? Not if they take typical actions. But, if they’re willing to go above and beyond, then I have no doubt.
Happy investing and thank you for reading!
If you liked this post, consider signing up for my newsletter.
This is post 388. Any code I have related to this post can be found here with the same numbering: https://github.com/nmaggiulli/of-dollars-and-data

