Don’t follow your passion. Actually…it depends. If your passion is in an industry with a wide distribution of economic outcomes, then you might want to consider a different line of work. Let me explain.
It seems obvious that certain occupations are less equally distributed in terms of financial outcomes than others. This is not a novel idea. Many people know anecdotally that certain occupations exhibit more of a “winner take all” market, while others are more equitable. However, I wanted to see which occupations exhibit this behavior and to what extent.
To understand this relationship, I downloaded the occupational employment data from the Bureau of Labor Statistics, which has hourly wage information across many different occupations and industries. I subset the data to show only national statistics across all industries that are privately owned. Using this subset I created a measure of inequality in outcomes using the percentage difference between the hourly wage at the 10th percentile and the hourly wage at the 75th percentile. This measure boils down to: how much more (on a percentage basis) do those in the 75th percentile make than those in the 10th percentile make for a given occupation? If we plot this against the hourly median wage of all occupations we see that a particular subset of occupations are more unequal than others:
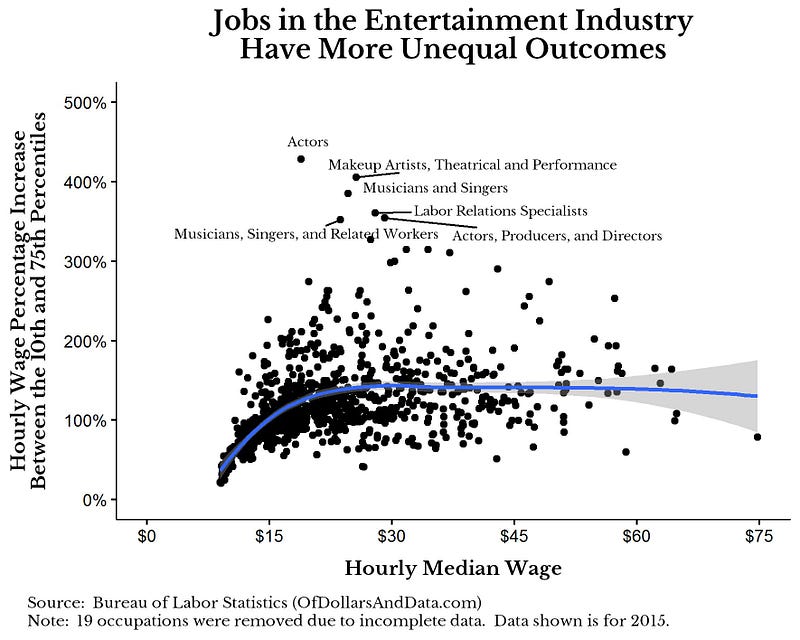
As you can see, all of the occupations highest on the y-axis (the inequality measure) tend to be in the entertainment industry. This means that the difference between those who “make it” and those who don’t is larger in these occupations. For example, “Actors” in the 75th percentile make over 5 times as much as those in the 10th percentile on an hourly basis. But, another thing you may notice about the plot is that higher incomes do not lead to higher inequality. This is why the trend line seems mostly flat once you get to a median wage of about $25 an hour. Outside of the entertainment industry other less equitable occupations (not labeled on the plot above) include:
- Real estate brokers
- Personal financial advisers
- Securities, Commodities, and Financial Sales Agents
- Top Executives
For an interactive graphic where you can look at all the occupations underlying individual points in the plot above see here.
Another thing I noted in this data is that the occupations with the least inequality are also those that are the lowest paying (i.e. food preparation/food industry). You can see these in the lower left corner of the plot. This does not surprise me as there is lots of competition for these jobs and the skill requirements are lower, so the market should be relatively efficient at setting wages.
Despite all of my explanations so far, the idea that I find most intriguing is the fact that the inequality of outcomes shows up at the 75th percentile, and not just for the top few percent. This means that the difference between the people that “kind of make it” (75th percentile) and those who don’t (10th percentile) is quite large. Once we include the top few percent (i.e. celebrities in the entertainment industry) the difference is even more striking.
Now, I am not claiming I know why some of these occupations show unequal outcomes, just that they do. I can theorize that with jobs in the entertainment industry supply is much greater than demand (i.e. only so many movies are made a year, but a lot of people want to be in them), but I am not 100% sure of this. There is also the possibility that the differences in skill level between individuals in these occupations is legitimately large. This would make logical sense as the compensation structures we see in these occupations (i.e. more commission) reflect and reward this underlying difference in skill.
Before I go to a final conclusion, I do have a few caveats with this analysis given it does not address a few issues that I think are important.
- It does not control for experience. The differences in outcomes could be related to experience in the industry and not necessarily inequality. For example, legal occupations (i.e. lawyers) would show a large discrepancy based on experience since partners tend to make more than their younger associate counterparts.
- The grouping of occupations shown here may be too broad. Using legal occupations as an example again, this group includes lawyers, court reports, and paralegals among other occupations who we would expect to have different economic outcomes.
- It does not control for location. I used the national statistics here, but in certain geographic markets this may disappear. I would have gone through these to find out, but the BLS has a lot of geographic areas in its data.
- My measure of inequality does not includes benefits, though I am pretty sure it includes bonuses and other compensation. For example, some of the freelance jobs in the entertainment industry do not have benefits and this imposes large costs on the individuals in those industries.
- Of the 19 occupations that were dropped due to incomplete data, many of them were high earning occupations. However, given there seems to be little to no correlation between higher median wages and inequality I am not too worried about this.
How to Prevent Your Career From Being A Gamble
The best way to choose a career that isn’t a gamble is to pick something that:
- You enjoy doing
- You are good at
- Has a decent distribution of economic outcomes
My proposed thought experiment is this: If you were to end up as a less fortunate member of a particular occupation, which occupation would you choose? Would you choose the occupation where if you fail you are financially ruined? Or one where even if you are in the bottom 10% you will do okay? I know everyone tends to believe that they will be the one to make it, or they will be above average, but it is impossible for everyone to be above average.
Lastly, I am not trying to be anti-”follow your passion”. I am just saying that if you get unlucky in particular occupations, you will be worse off financially. Obviously there are far more factors involved in picking a career (i.e. happiness, work-life balance, etc.) than financial outcomes. However, if you think following your passion will make you rich, it really depends on the industry and how hard you want to work. Remember that the distribution of outcomes for your career matters. Choosing occupations in particular industries can be very lucrative when you are on the right side of things, and not so lucrative when you are not. Choose wisely. Thank you for reading!
If you liked this post, consider signing up for my newsletter.
This is post 05. Any code I have related to this post can be found here with the same numbering: https://github.com/nmaggiulli/of-dollars-and-data

