Given it is July 4th, I thought it would only be fitting to talk about the one and only United States of America. In particular, I want to talk about how the U.S. became the dominant stock market of the 20th century and why the 21st century still looks promising for American businesses.
To start, let’s look at some data on the share of world stock market capitalization represented by various regions of the world in the year 1900 (data was taken from this Investopedia article):
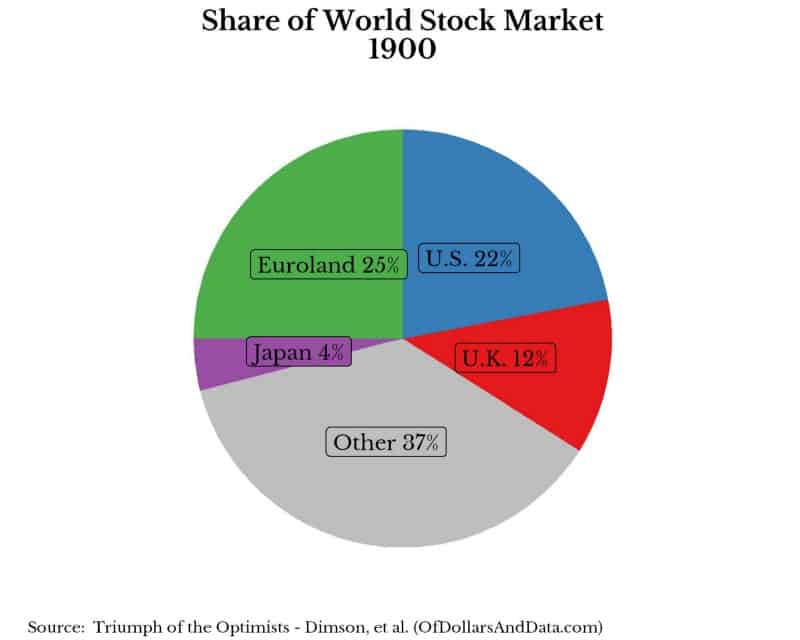
As you can see, the U.S. represented 22% of the global equity market at the beginning of the 20th century. During this time European countries acted as large competitors to the U.S., however, over the course of the 1900s this changed drastically. By the year 2000, the U.S. had a 47% share of global equity markets:
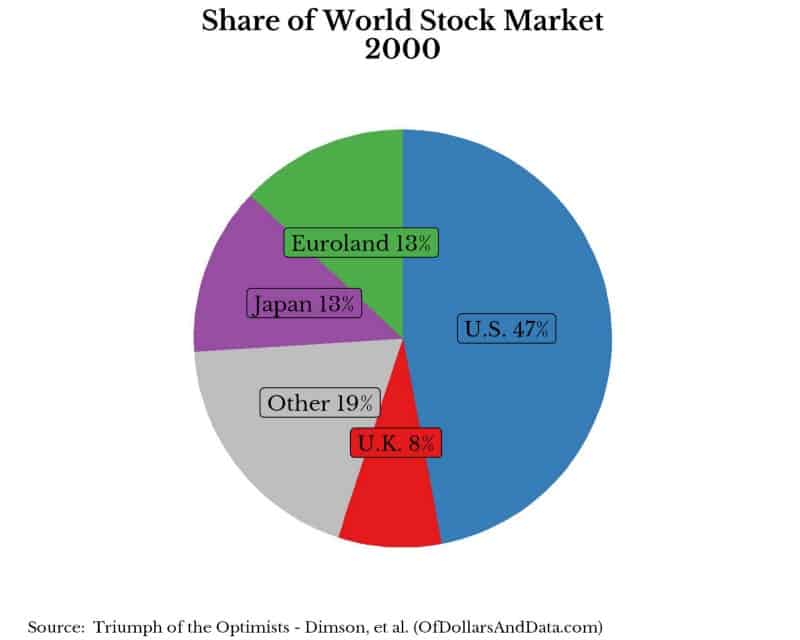
What you will notice, besides the increase in the equity market share of the U.S. and Japan, is the much smaller role that Europe plays in global stock markets by the year 2000. This result does not necessarily surprise me though. Considering the fact that Europe was ravaged by 2 wars in the first half of the 20th century, it doesn’t seem remarkable to me that the U.S. would expand its market presence. For example, it was estimated that one quarter of all Russian capital resources were destroyed in WWII. Do you know how insane that sounds? I can’t even imagine a similar scale event happening in the U.S.
Despite the increased market share that the U.S. commanded at the beginning of the 21st century, let’s consider the U.S. stock market performance from 1900–1999. If you had invested $1 in the U.S. stock market in January 1900 and reinvested your dividends, by January 2000 you would have had $1,000 (after inflation, but before transaction costs). Looking at the plot below you can see the U.S. real stock market return with dividends for the 20th century (January 1900 — December 1999) and the 21st century (January 2000 — December 2016) overlaid on the same plot (Note: the log scale on the y-axis):
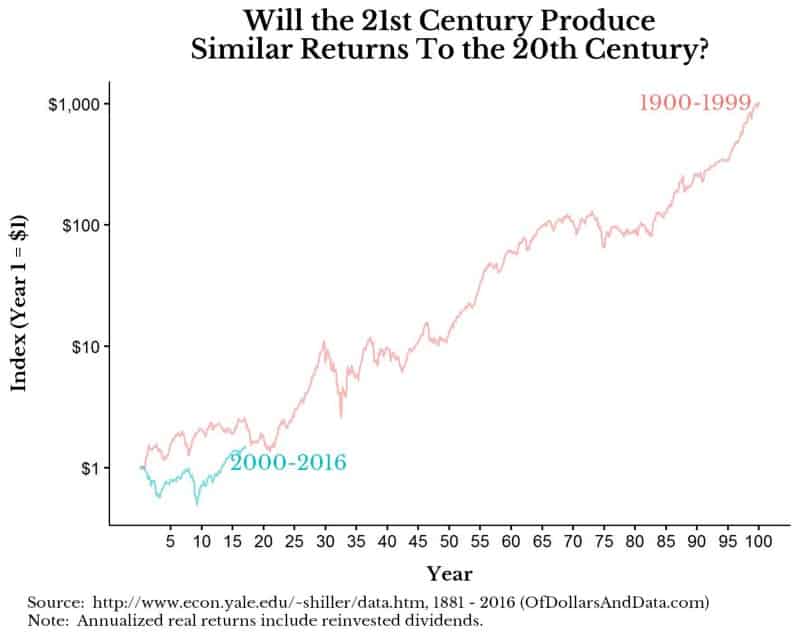
As you can see, the differences between the centuries are close to converging at this point (i.e. 16 years in). This does not imply that the U.S. stock market will have the same magnificent performance in the 21st century as it did in the 20th century, however, consider the following thought experiment:
From 1900–1999 the U.S. stock market produced a real return of ~ 7.15% a year. This is the 1000x total increase pictured above. If we assume 1% annual transaction costs (i.e. a 6.15% real return), you would have gotten a 390x cumulative increase over this period. Now, consider the 21st century. As of the end of 2016, we had only experienced a 1.5x cumulative increase(i.e. $1 has turned into $1.50 in real terms). Even if the 21st century only produces a 4% average real return, this means that we should expect a 50x cumulative increase (i.e. $1 becomes $50) by the year 2100.
Consider that idea for a moment. Even if the 21st century is only 2/3rds as fruitful as the 20th century, the U.S. stock market will still do quite well and you can be quite wealthy. While I (nor anyone else) can guarantee the future success of the U.S. stock market, I think there are still some major advantages that make the 21st century seem promising.
Risk Taking and the Future of U.S. Stock Returns
While the U.S. has outperformed global stock markets in the last few months, over longer time horizons global stock markets have been remarkably similar in performance terms (chart from this Bogleheads page):
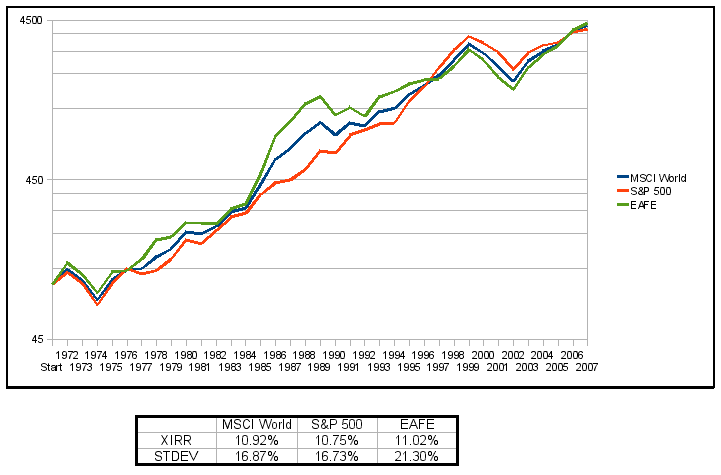
There is nothing that states this has to be true going forward. However, if we assume some level of stability in the future (i.e. no world wars), I would expect most equity returns to be similar across most developed regions over time. This is becoming even more true in today’s world with an increasing focus on global markets.
Despite my belief in the converge of equity returns, I still think the U.S. has the best game in town because of its culture of risk taking (especially in Silicon Valley) that allows for massive value creation. Experimentation in business and technical pursuits seems to be America’s edge in the global economy. If you combine this with America’s ability to attract top talent from across the globe, the edge gets even stronger.
So, where will the U.S. stock market end up in 2100? No one knows, but as Warren Buffet has stated:
It has never paid to bet against America. We come through things, but it is not always a smooth ride.
Happy 4th of July. Thank you for reading and God Bless the United States of America!
If you liked this post, consider signing up for my newsletter.
This is post 29. Any code I have related to this post can be found here with the same numbering: https://github.com/nmaggiulli/of-dollars-and-data

