I was recently speaking with Tony Isola, an advisor at my firm who’s clients are primarily teachers with 403(b) accounts. Tony was telling me that many of the teachers he meets initially have their 403(b)s invested in annuity products that typically charge fees around 2.25%. But what makes these products even worse is that they usually charge a surrender fee of 5-10% if you want to take your money out early.
Tony had a feeling that despite this steep surrender fee, paying it would be worth it for his prospective clients because they would reduce their ongoing fees from 2.25% to something much lower. For practical purposes, Tony asked me to calculate the largest surrender fee that someone could pay, while moving to a portfolio that charges 0.5% (50 basis points), that would make them the same off financially as staying in the annuity.
More simply, how much should someone be willing to give up now in order to save on future fees later?
When I first thought about this problem my immediate answer was…it depends. It depends on your future expected return, how many years you are investing for, and the fees charged by the annuity and non-annuity product. Thankfully, Tony had given me two of these variables already (the annuity fee of 2.25% and the non-annuity fee of 0.5%).
For the future expected return, I decided to assume that both portfolios would return the same 5% annually. [Author’s note: I did run sensitivities where the future expected annual is higher, but it doesn’t alter my conclusions in any material way]. This only leaves one variable left to vary: how long do you plan on investing for? Tony told me that many of the teachers he meets are younger and have at least a 30-year investment life ahead of them, so I decided to use a 30-year period for comparison.
What I found after running the numbers shocked me. If you were to invest over 30 years with a 5% annual return, you would be the same off staying in an annuity charging 2.25% as you would in a portfolio charging 0.5% after paying a 40% surrender fee! That’s right. You can start off with 60% of the money of someone else, but end up the same off simply because you paid so much less in annual fees.
You might be wondering, “Well what about additional annual contributions or the account value? Those have to matter, right?” Actually, no. If we assume additional contributions would earn the same return and pay the same fees as the initial account value, this will make no difference by the end of our investment time frame. We only need to compare the after-fee performance for both accounts to see how much of a surrender fee we could bear.
To provide a visual example of this, consider the case where you have $10,000 in an “Annuity” portfolio earning 5% and charging 2.25% annually compared to $10,000 in a “Non-Annuity” portfolio earning 5% and charging 0.5% annually. This first simulation assumes no surrender fee for the Non-Annuity portfolio. After 30 years, the growth in each portfolio would look like this:
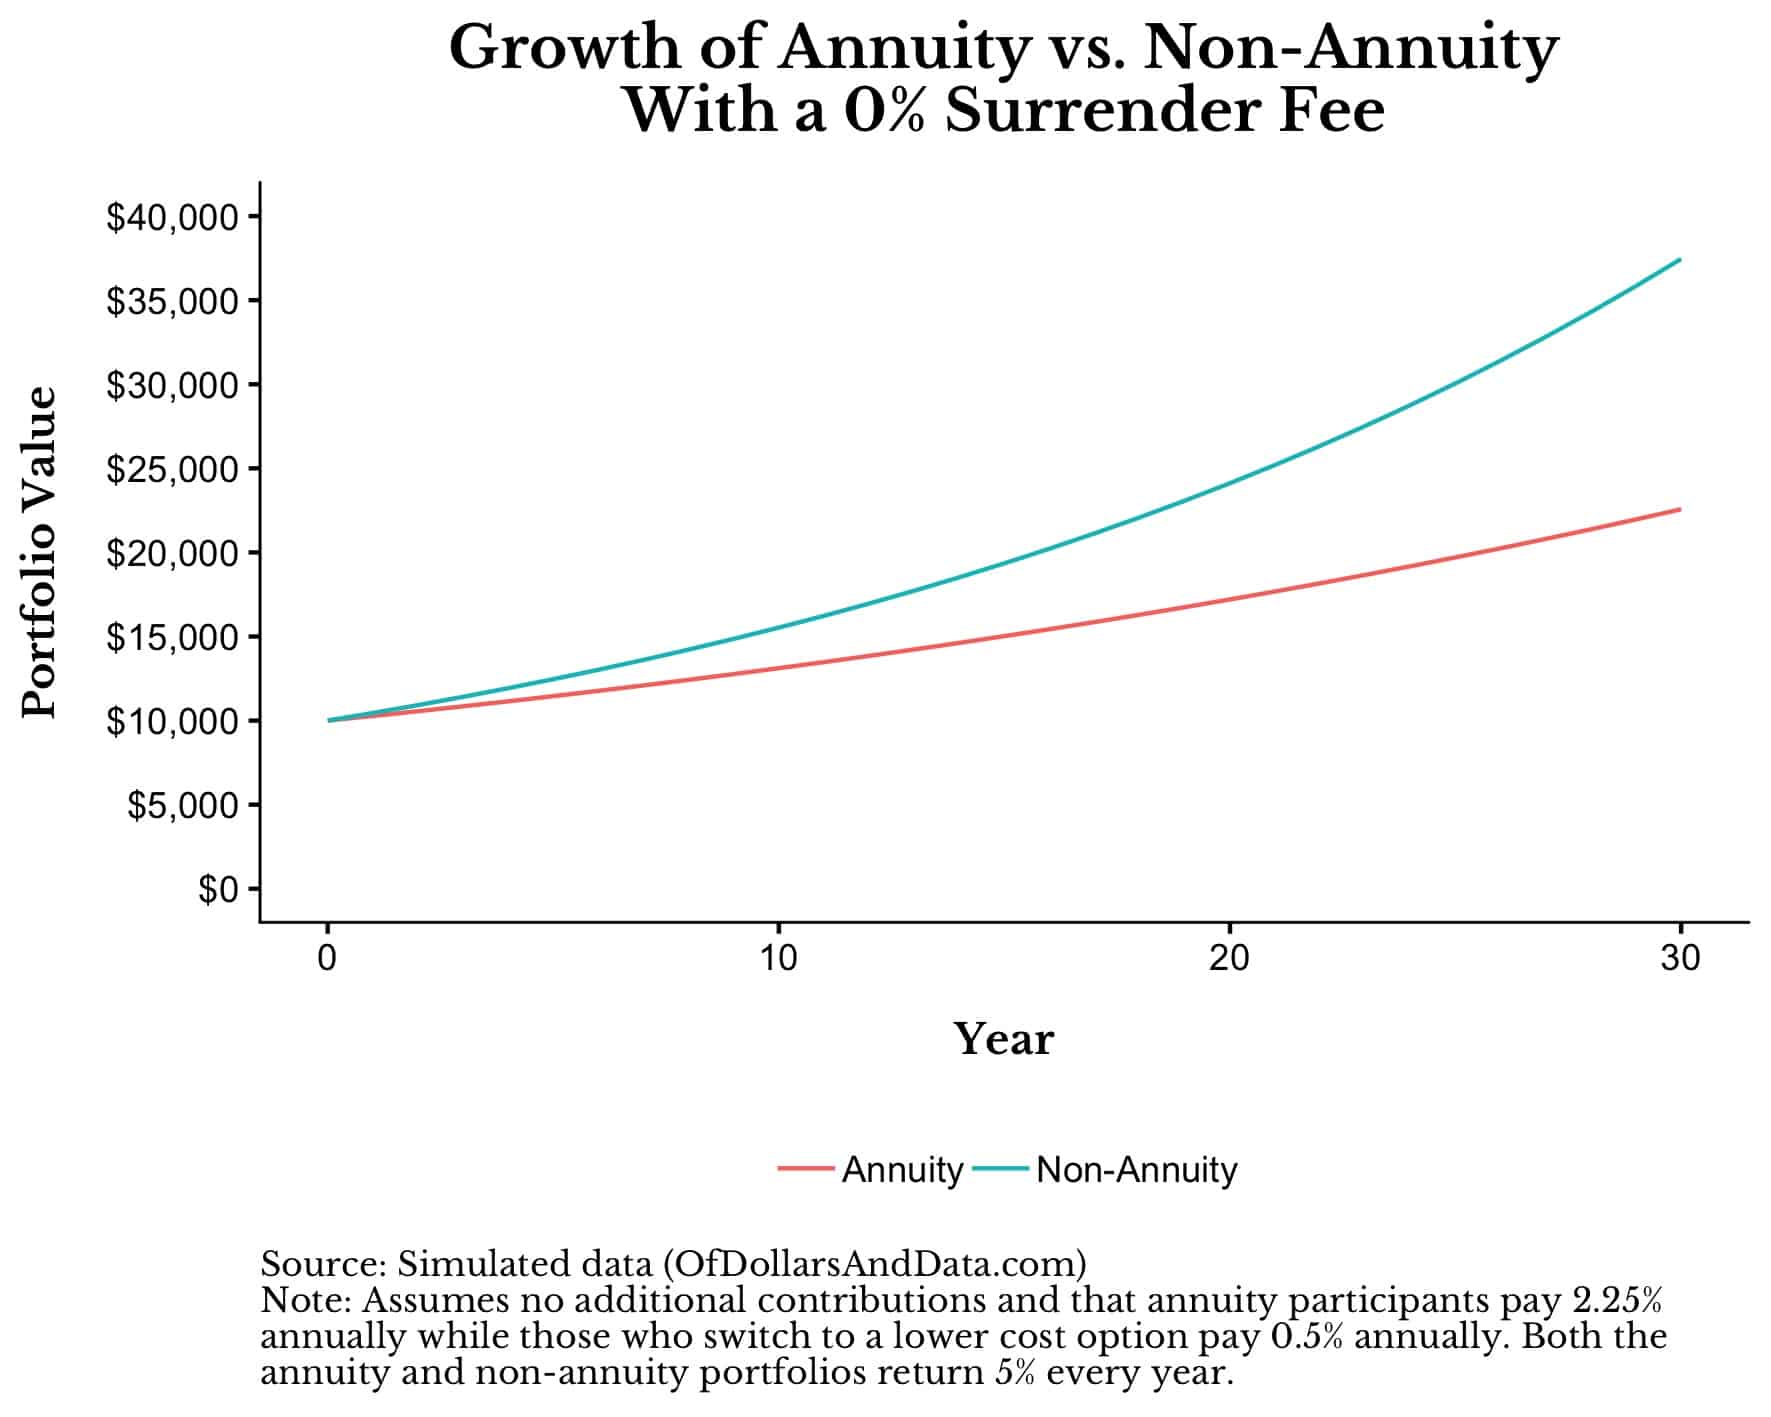
With no surrender charge, it is easy to imagine how the Non-Annuity portfolio outperforms the Annuity portfolio simply because the Non-Annuity pays lower annual fees. But, now let’s add a 10% surrender charge such that the Non-Annuity portfolio starts with $9,000, or 10% less than the Annuity portfolio:
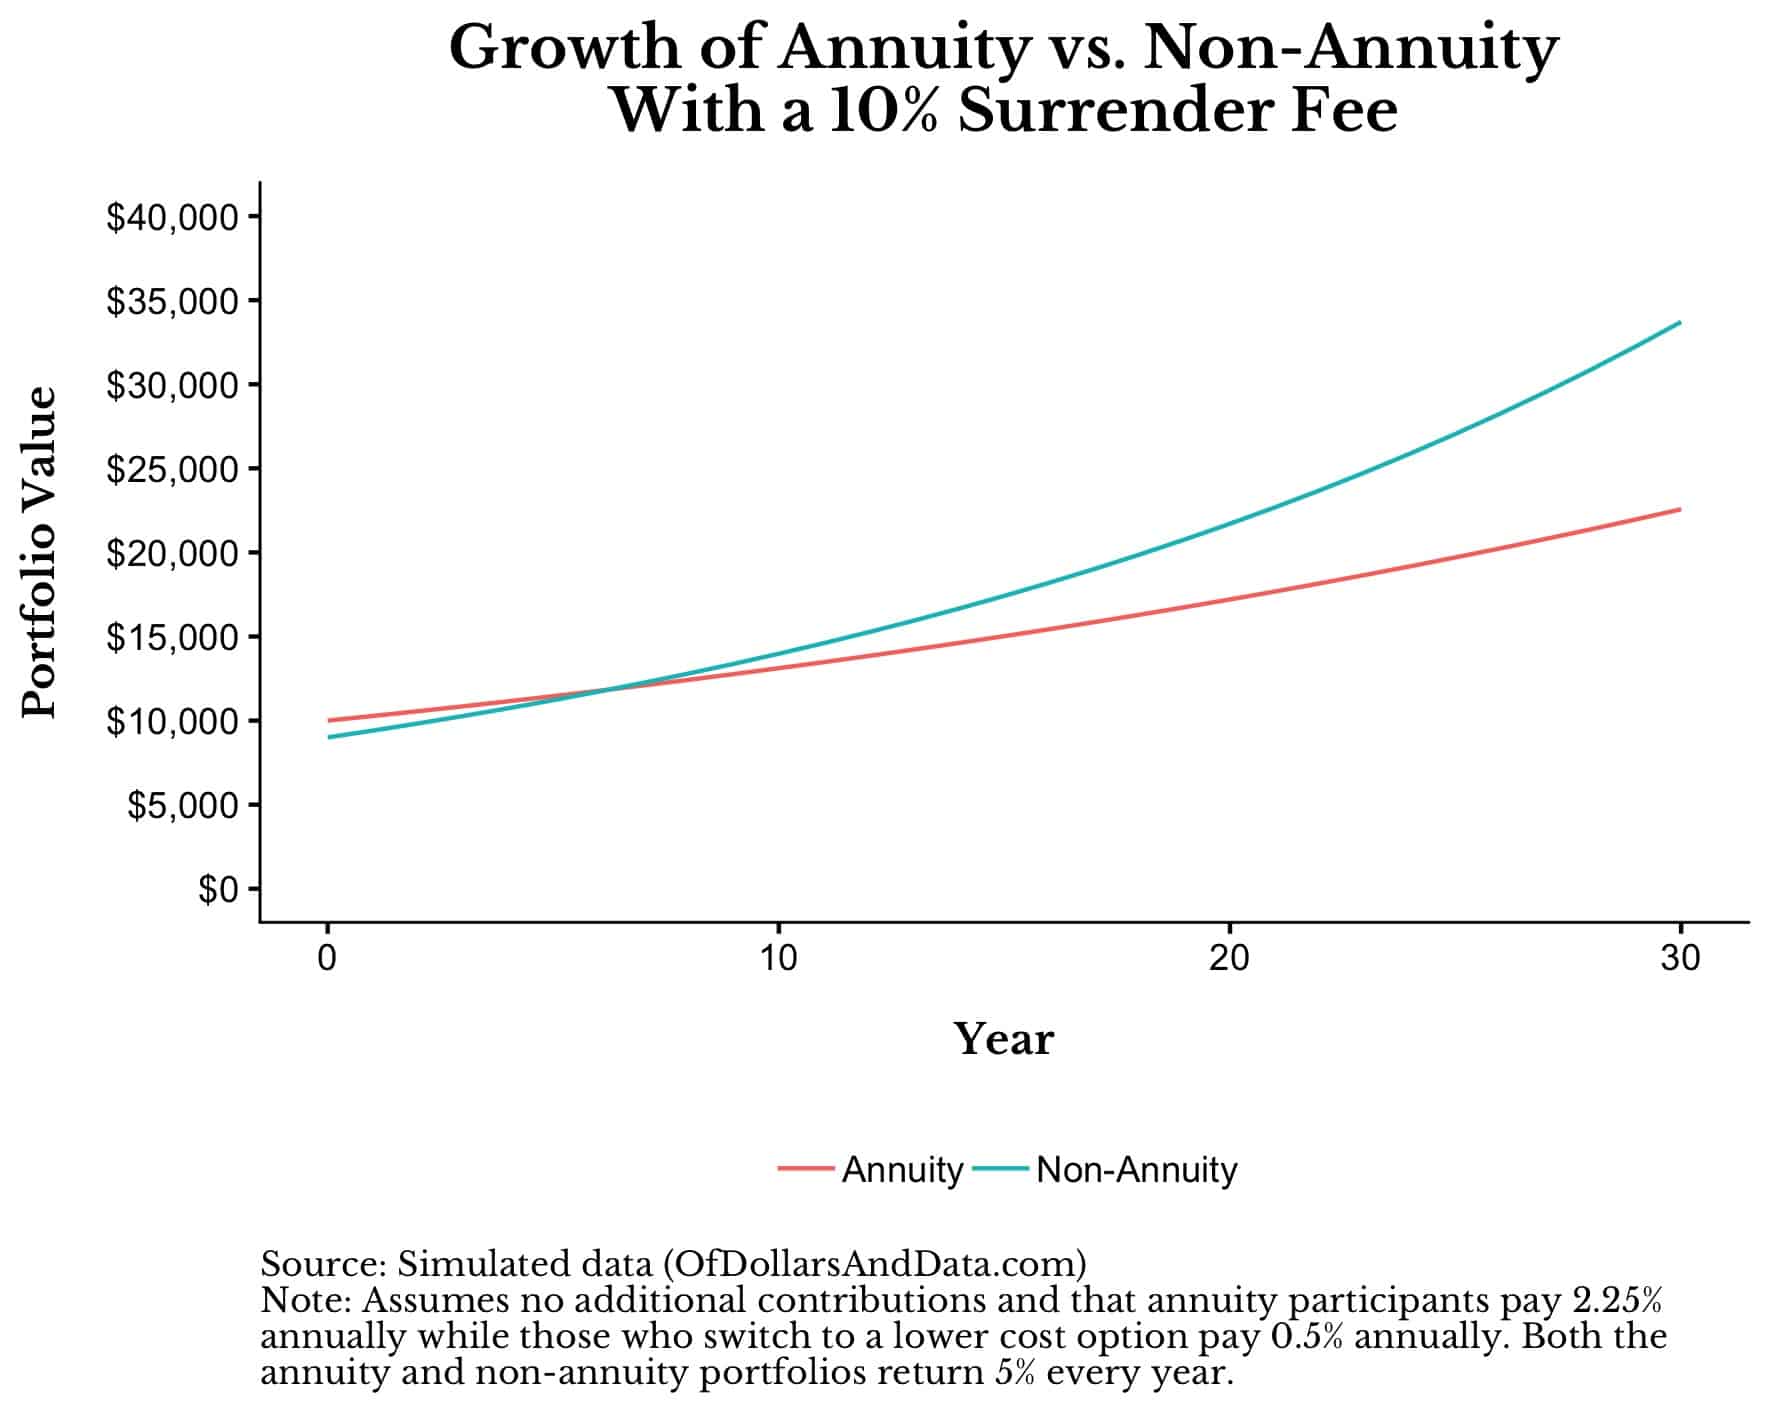
Even in this case, the Non-Annuity portfolio outperforms over 30 years. As you can see, around year 7 both of these products become financially equivalent. The early surrender fee paid in the Non-Annuity portfolio was made up for through lower annual fees in that portfolio in less than a decade. We can extend this simulation further by comparing the Annuity and Non-Annuity portfolios with increasing initial surrender fees:
As you can see, the Annuity and Non-Annuity portfolios become equivalent over 30 years only with an initial surrender fee of 40% (as I mentioned earlier).
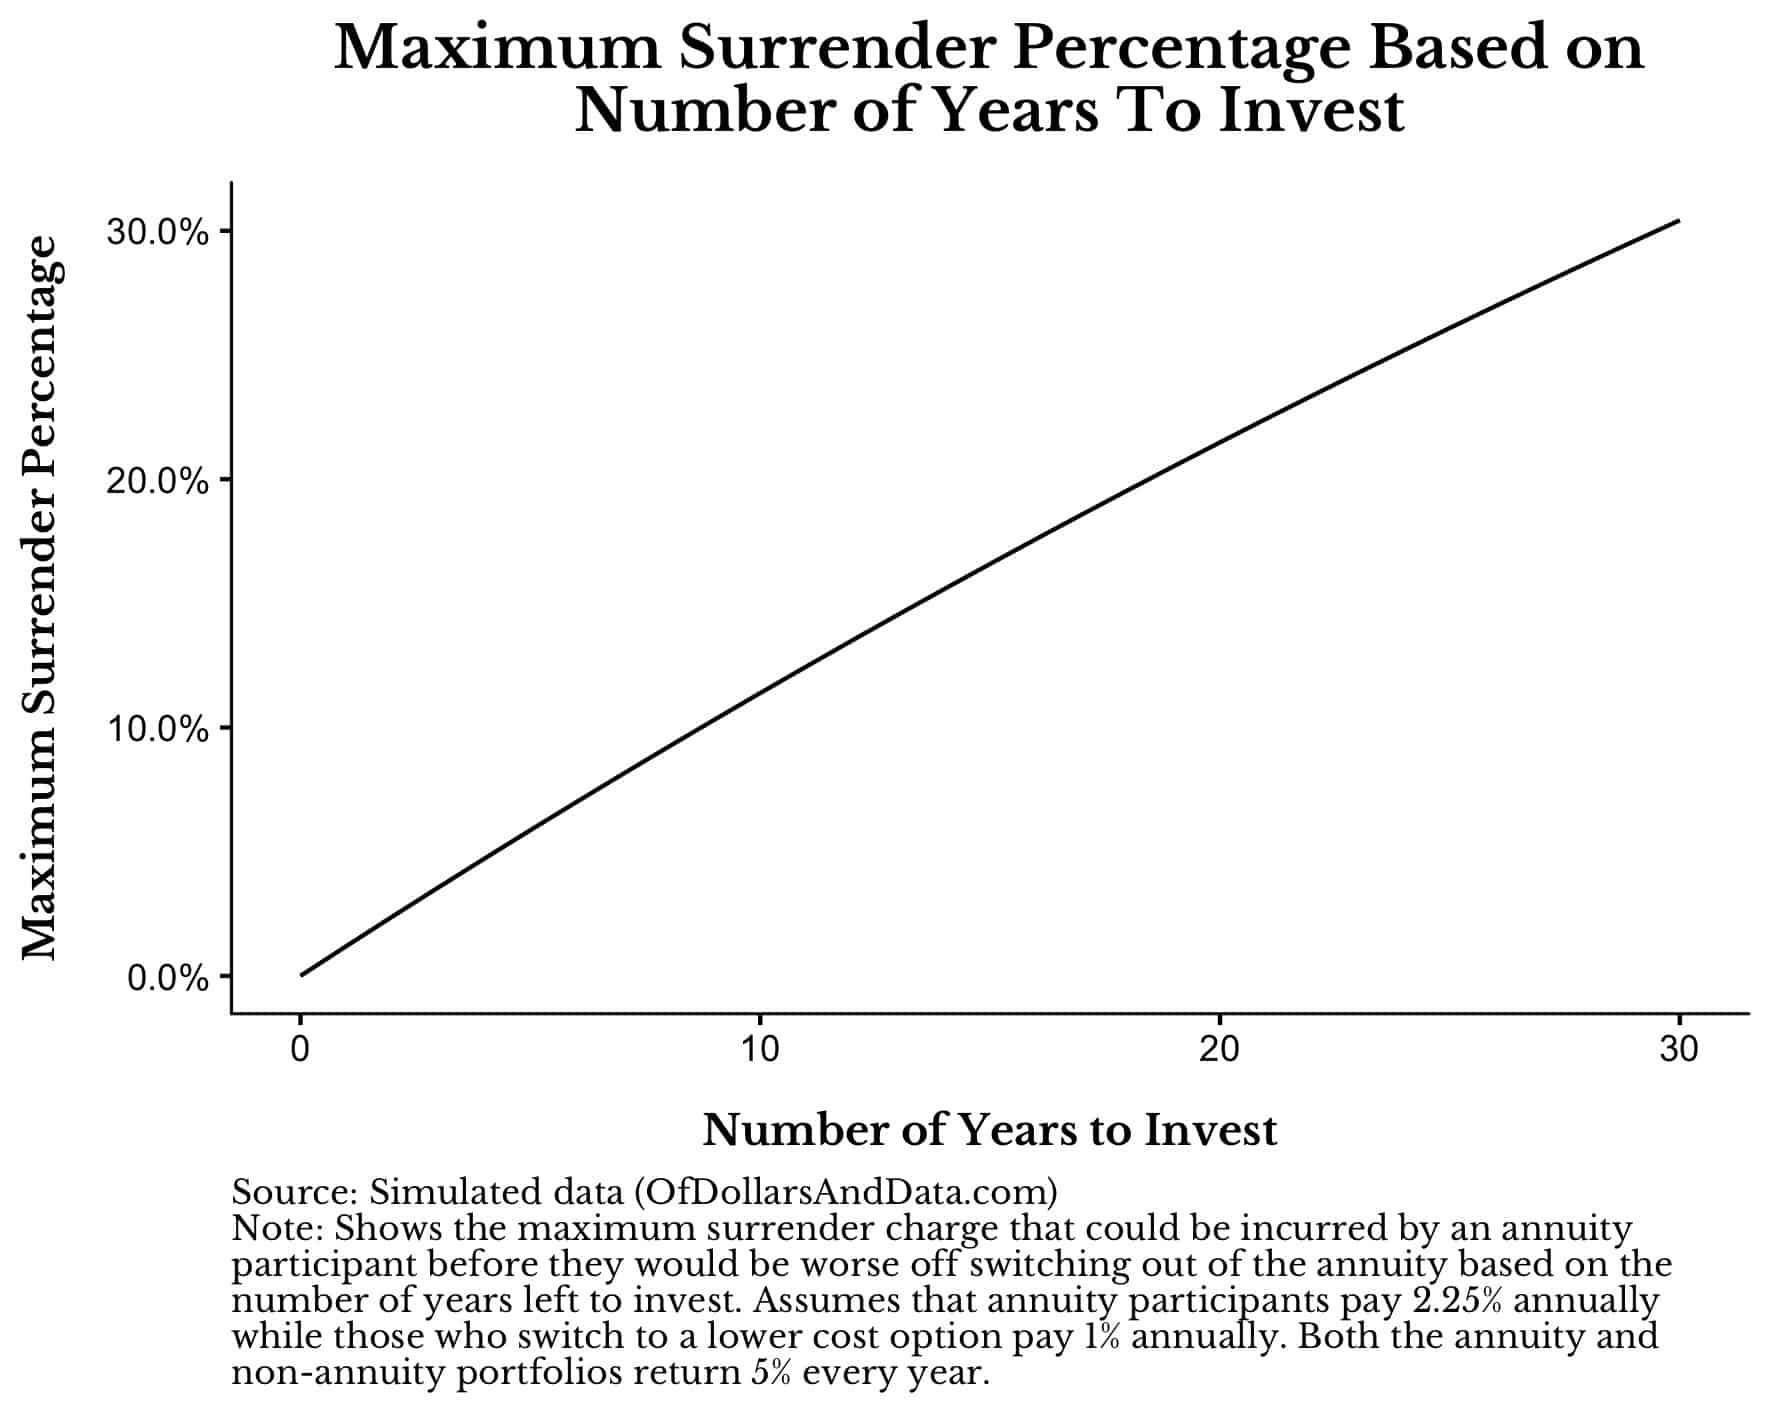
More importantly though, we can general this solution to work for any amount of time. The chart below shows the maximum surrender fee you could pay and be the same off between the Annuity and Non-Annuity portfolio based on the number of years you have to invest:
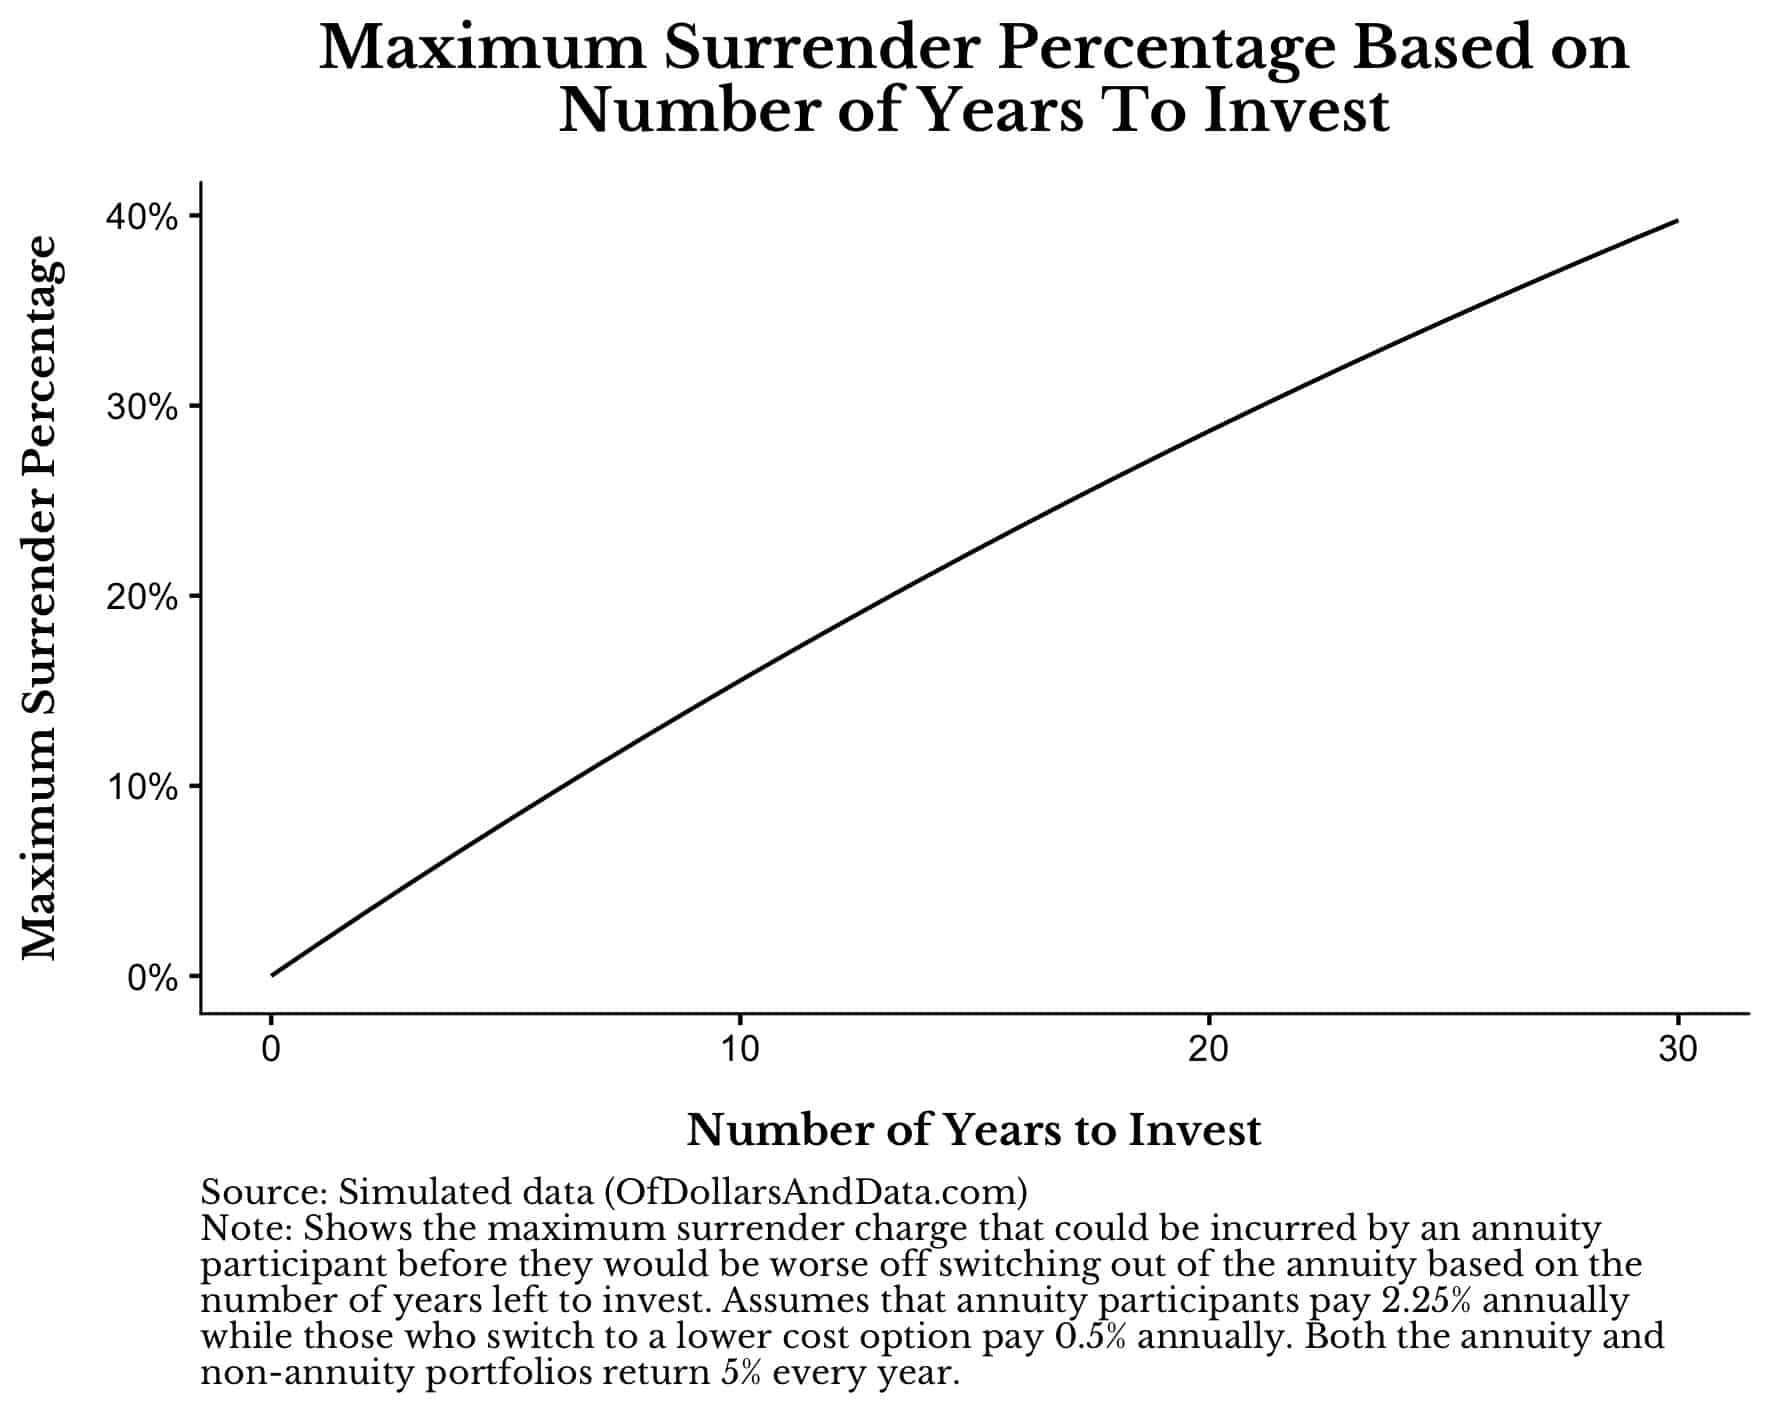
If you are only investing for a short amount of time, it doesn’t make sense to pay larger surrender fees as you won’t have time to make them up with lower annual fees. However, if you are investing for a longer time period, the surrender fees barely move the needle compared to staying in a strategy charging 2.25% annually.
This is why it pays to escape the fee prison now. Because although losing 10% of your money to a surrender fee might seem harsh, it’s far better than paying 2.25% a year for multiple decades.
Lastly, you might be wondering, “What happens if I go from an annuity charging 2.25% to a portfolio charging more than 0.5% How will the results change?” Well, I ran the same simulation using a 1% annual fee for the Non-Annuity portfolio and my conclusions are materially unchanged.
For example, if you had to invest for 30 years, you could take up to a 30% surrender fee and move to a Non-Annuity portfolio charging 1% annually and be better off than the 2.25% Annuity portfolio. This result is not as extreme as the 40% surrender fee you could take when paying only 0.5% annually, but it’s economically similar.
To illustrate this, I re-ran the chart above showing the maximum surrender fee based on number of years to invest using a 1% fee for the Non-Annuity Portfolio:
As you can see, as long as you are investing for over a decade, you should be willing to pay a surrender fee of up to 10% to move to a lower cost portfolio.
After speaking with Tony about these results, he told me that he rarely sees surrender fees greater than 10%. I was shocked by this. Why? Because these annuity products asking for a 10% surrender fee are giving you a bargain. They are offering your money a way out of their maximum financial-security prison, so take it. Pay the surrender fee and leave with a smile. Your future self will thank you for doing so.
It’s Just Like Cars On The Freeway
If you are having some trouble wrapping your head around all these growth rates and fees, let me provide an analogy for you.
Think about fee mathematics like cars driving on a freeway. Imagine your portfolio as your car and your portfolio’s balance as your position on the freeway. Some cars are ahead of you (i.e. they have a larger balance than you) and some are behind you (i.e. they have less). Every car is traveling at a different speed (i.e. your portfolio’s growth rate) and is being slowed down by drag (i.e. the fees you pay).
As you can conclude, the cars with more drag (higher fees) will go slower than the cars with less drag (lower fees), all else equal. But, what you may not realize is that no matter where any two cars start, the car driving faster will eventually pass the one driving slower. In other words, a $10 portfolio earning 10% annually will surpass a $1 million portfolio earning 1% annually, it just takes 136 years!
This is why paying a 10% surrender fee is no big deal when you reduce your annual fees from 2.25% to 0.5%. Because though your car is further back on the freeway, you also no longer have a restrictor plate reducing your speed. What you lose in pole position you make up with by having a much faster car. This is why paying attention to your fees is so important. The difference between 2.25% and 0.5% seems small, but, when compounded, it’s enormous.
This is why it pays to remove the restrictor plate on your portfolio.
Lastly, a huge thank you to Tony Isola for providing the inspiration for this post. Thank you for reading!
If you liked this post, consider signing up for my newsletter.
This is post 147. Any code I have related to this post can be found here with the same numbering: https://github.com/nmaggiulli/of-dollars-and-data

