Ladies and Gentlemen, fear is back. With U.S. stocks down over 10% and international stocks down even more, investors are worrying about their portfolios yet again. But this isn’t the first time I’ve seen something like this happen. In fact, it isn’t the second time either. Since I started blogging at the beginning 2017, there have been three separate corrections of 10% or more—December 2018, February/March 2020, and today.
In times like these it can be tempting to say “stay the course” or “Just Keep Buying“, but I know that this is easier said than done. As my colleague Michael Batnick once stated:
Every time the market falls a little, we worry it’s going to fall a lot.
And he’s right. Every big market decline by definition had to start as a smaller market decline. However, I believe that most investors think about these declines in the wrong way. How so?
First, they tend to assume that every market correction is “the big one” though it probably won’t be. And, second, even when “the big one” comes, what’s happening in their portfolio will probably be the least of their worries. Let me explain.
How Do Future Returns Change as the Market Declines?
To start let’s look at the 1-year future returns from every all-time high in the Dow Jones Industrial Average since 1915. The plot below shows the distribution of these 1-year returns (along with the 0% line vertically for reference):
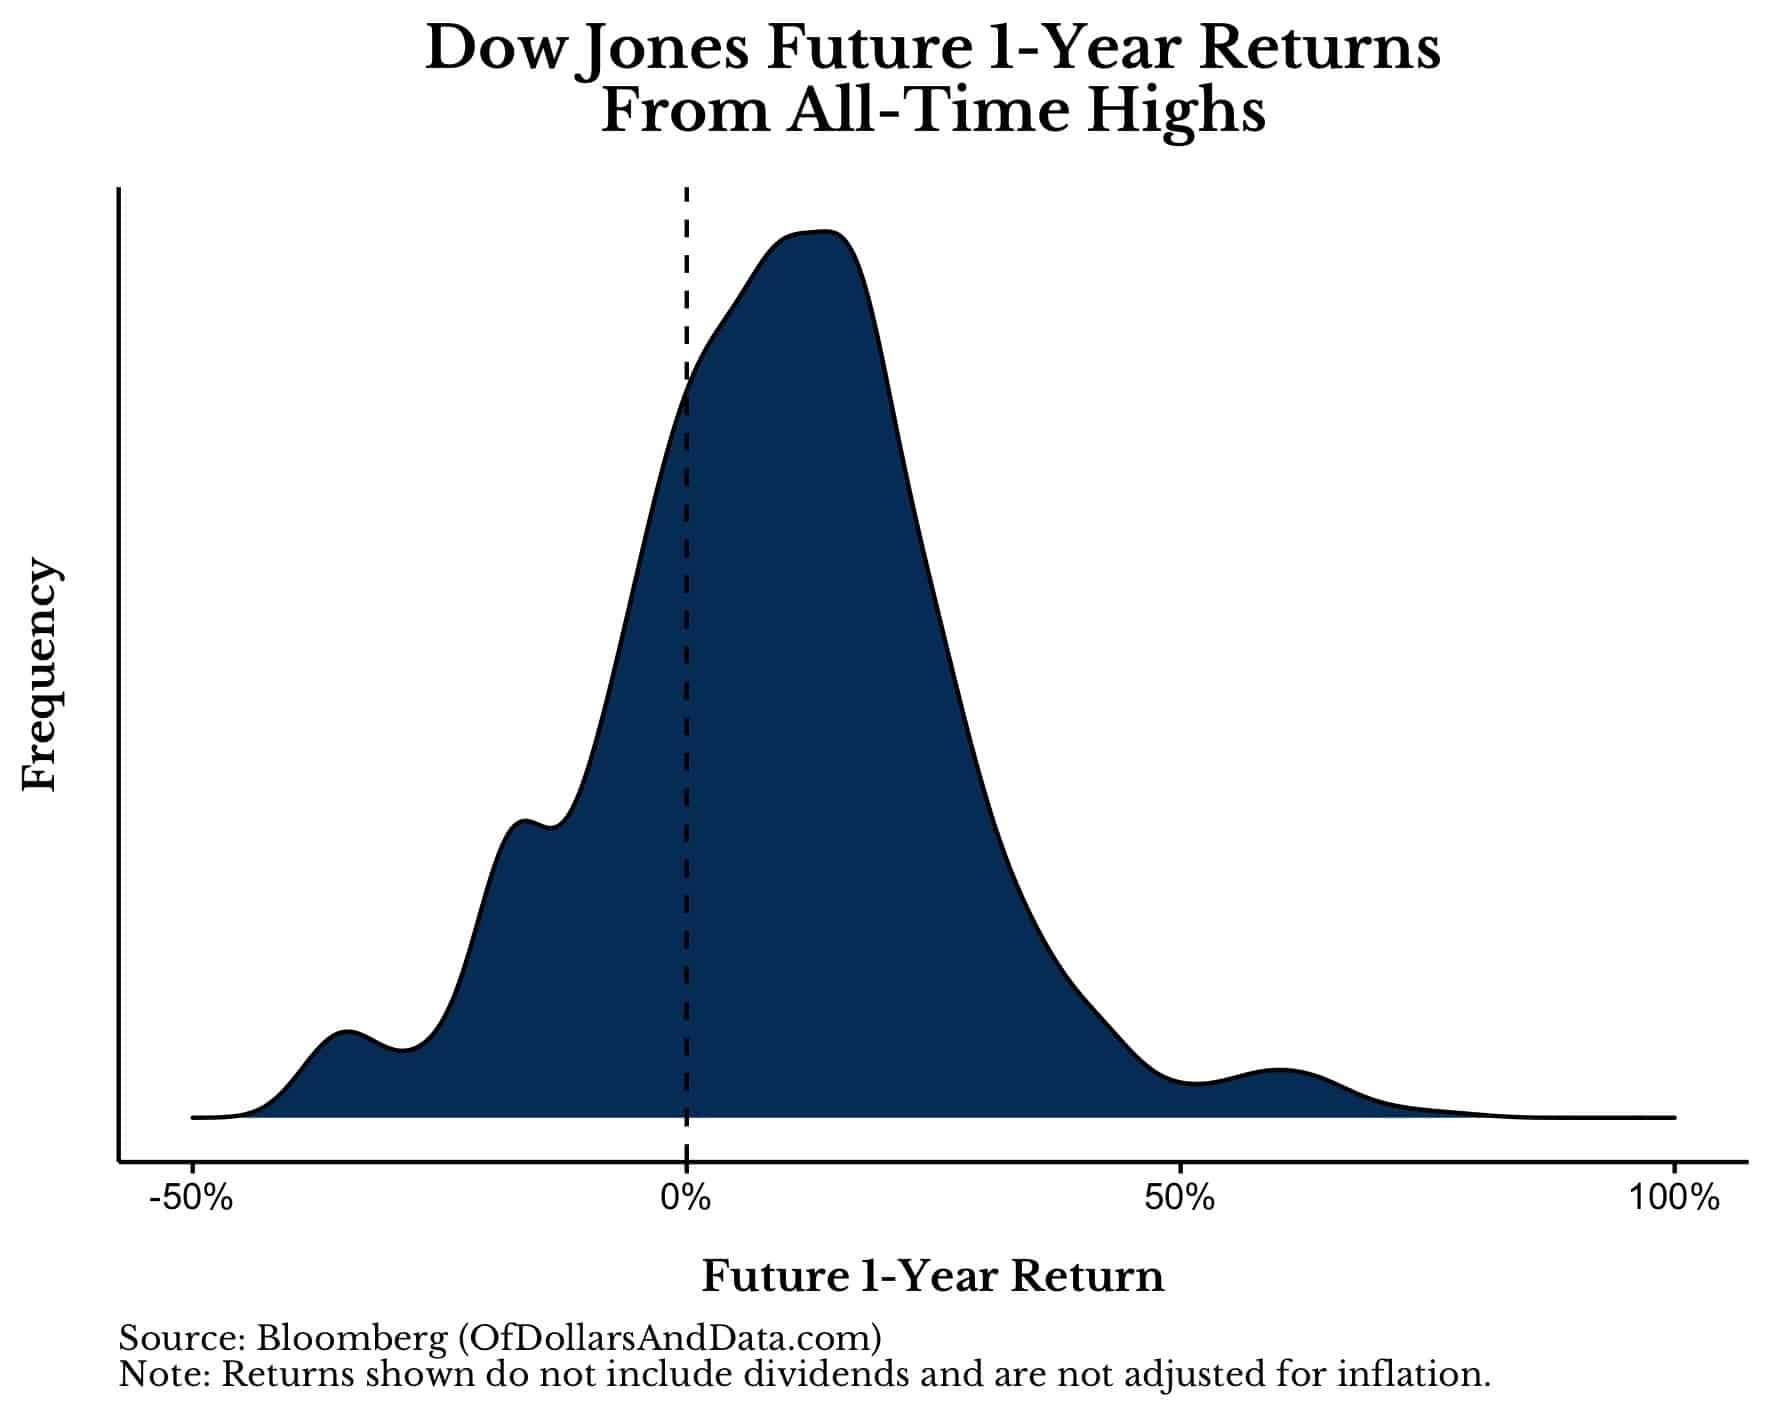
As you can see, 1-year future returns from all-time highs are generally positive, with the median 1-year future return being 9.6% (excluding dividends and not adjusting for inflation). What this means is that if you had bought the Dow at any all-time high since 1915, you could reasonably expect the index to be 9.6% higher one year later.
But how do 1-year returns change once the market is in a 10% decline/drawdown?
If we were to do this, we would see that 1-year future returns are about half as large following a 10% drawdown as they are following an all-time high. To be more specific, after a 10% correction, the median 1-year future return is only 5.5%:
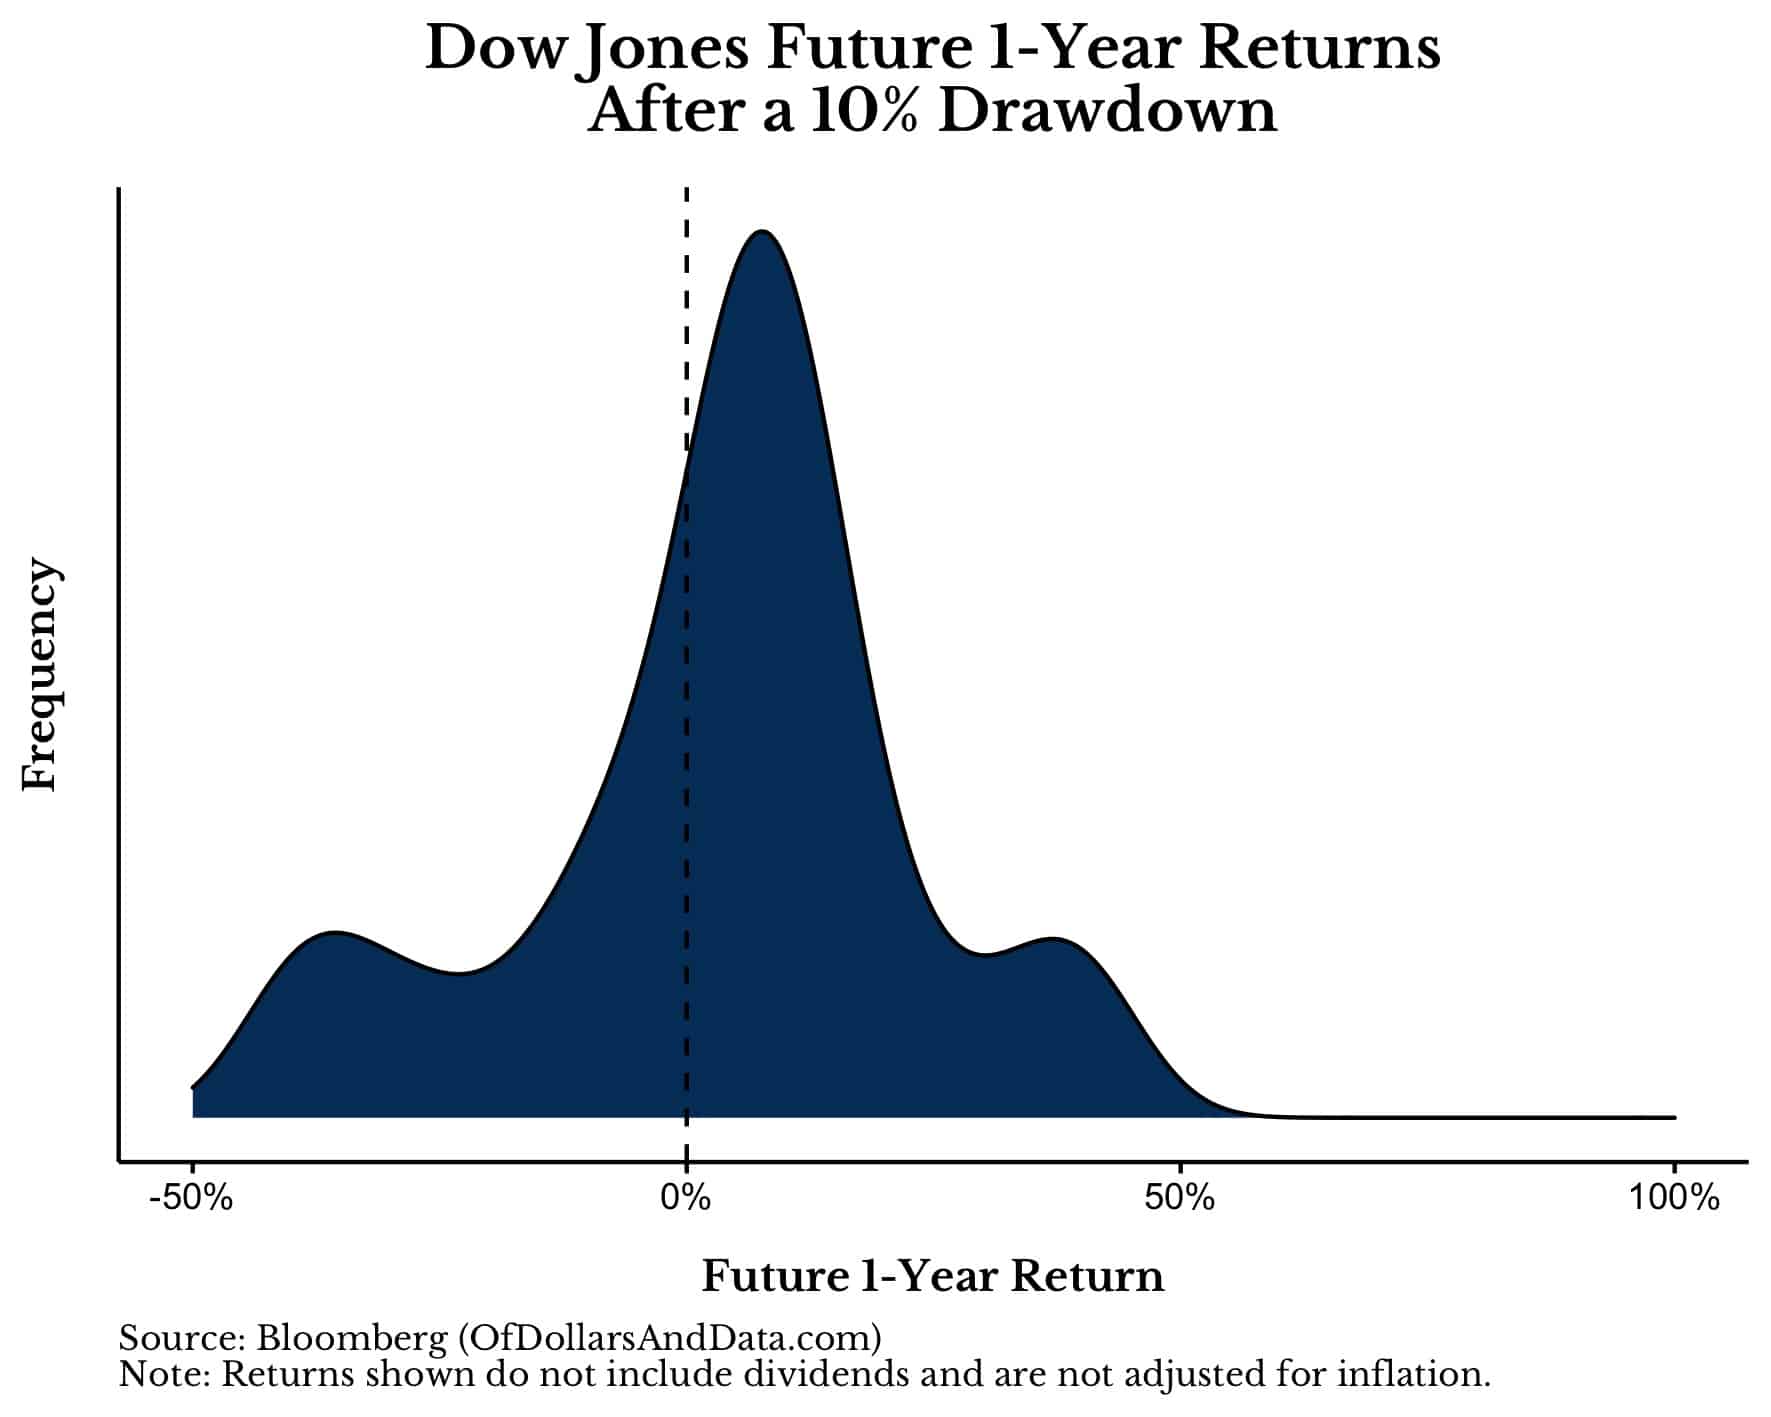
Why is this true? Because while the market can recover from a 10% decline it can also keep declining.
Since 1915, there have been 29 separate 10% declines in the Dow. Of those 29, the Dow had a positive return over the next year in 20 cases and a negative return over the next year in nine cases. Therefore, statistically, there is 69% chance that, following a 10% decline, the market would be higher one year later.
But what happens following bigger declines? Well it gets worse then it gets better. As the plot below shows, 1-year future returns tend to decrease following 10%-20% drawdowns, but increase after 30%+ drawdowns. For clarity, each colored distribution represents the distribution of 1-year future returns for a different drawdown threshold (0% = all time highs, 10% declines, 20% declines, etc.):
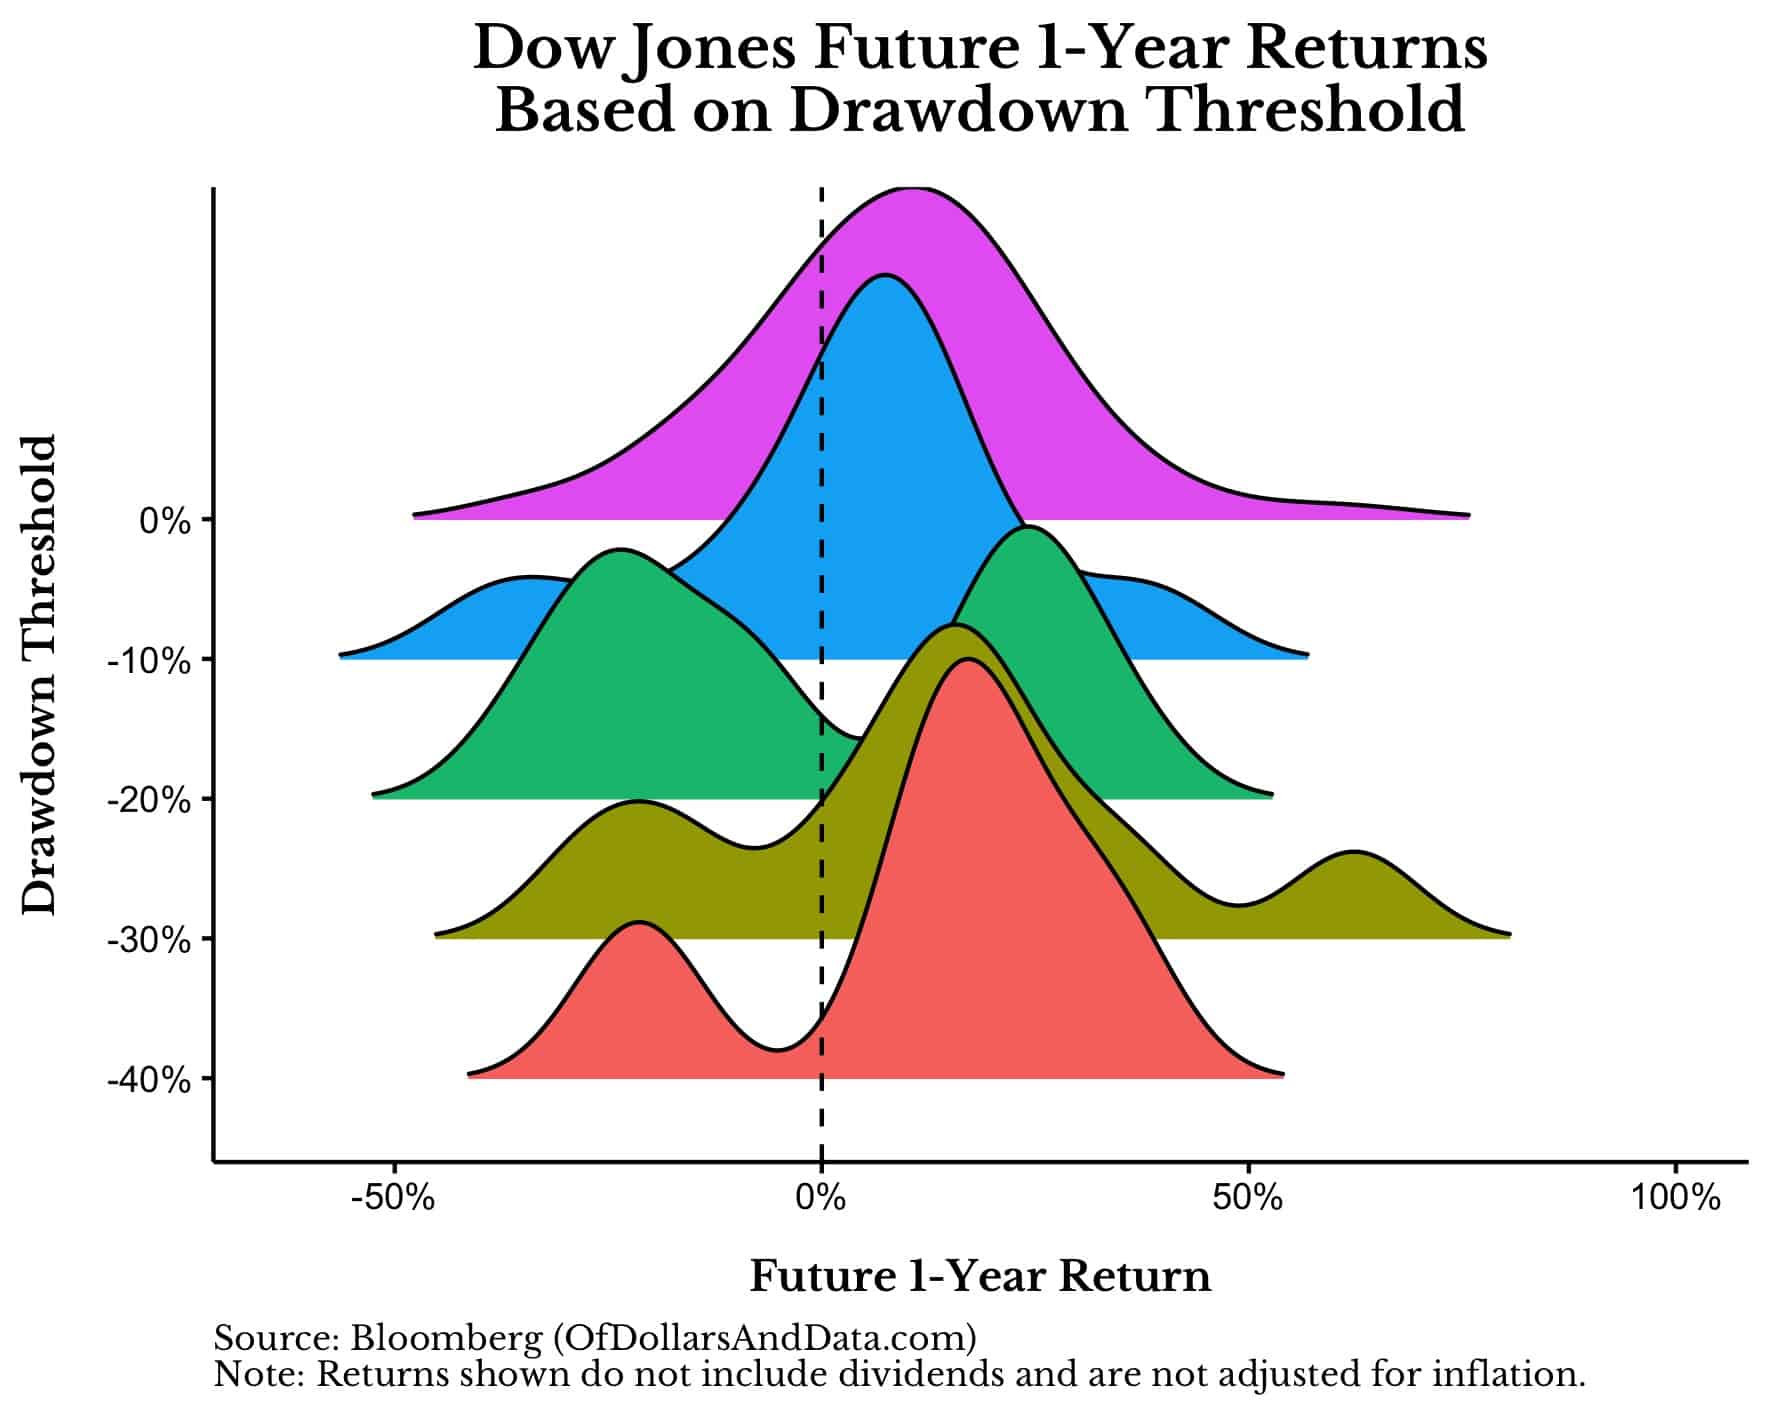
I created this plot so you could more easily compare how future returns are affected as market declines get more severe.
As you can see, 1-year future returns decrease with smaller market declines, but tend to improve after much bigger declines (30%+). To be more specific, after a 30% decline the median 1-year future return is 12.9%, and after a 40% decline the median 1-year future return is 15.8%. Both of these values are higher than the median 1-year future return after an all-time high (9.6%).
But what if we look over longer time periods? Does that change our results? Not much. If we look at this same plot for 3-year future returns, we see a similar pattern:
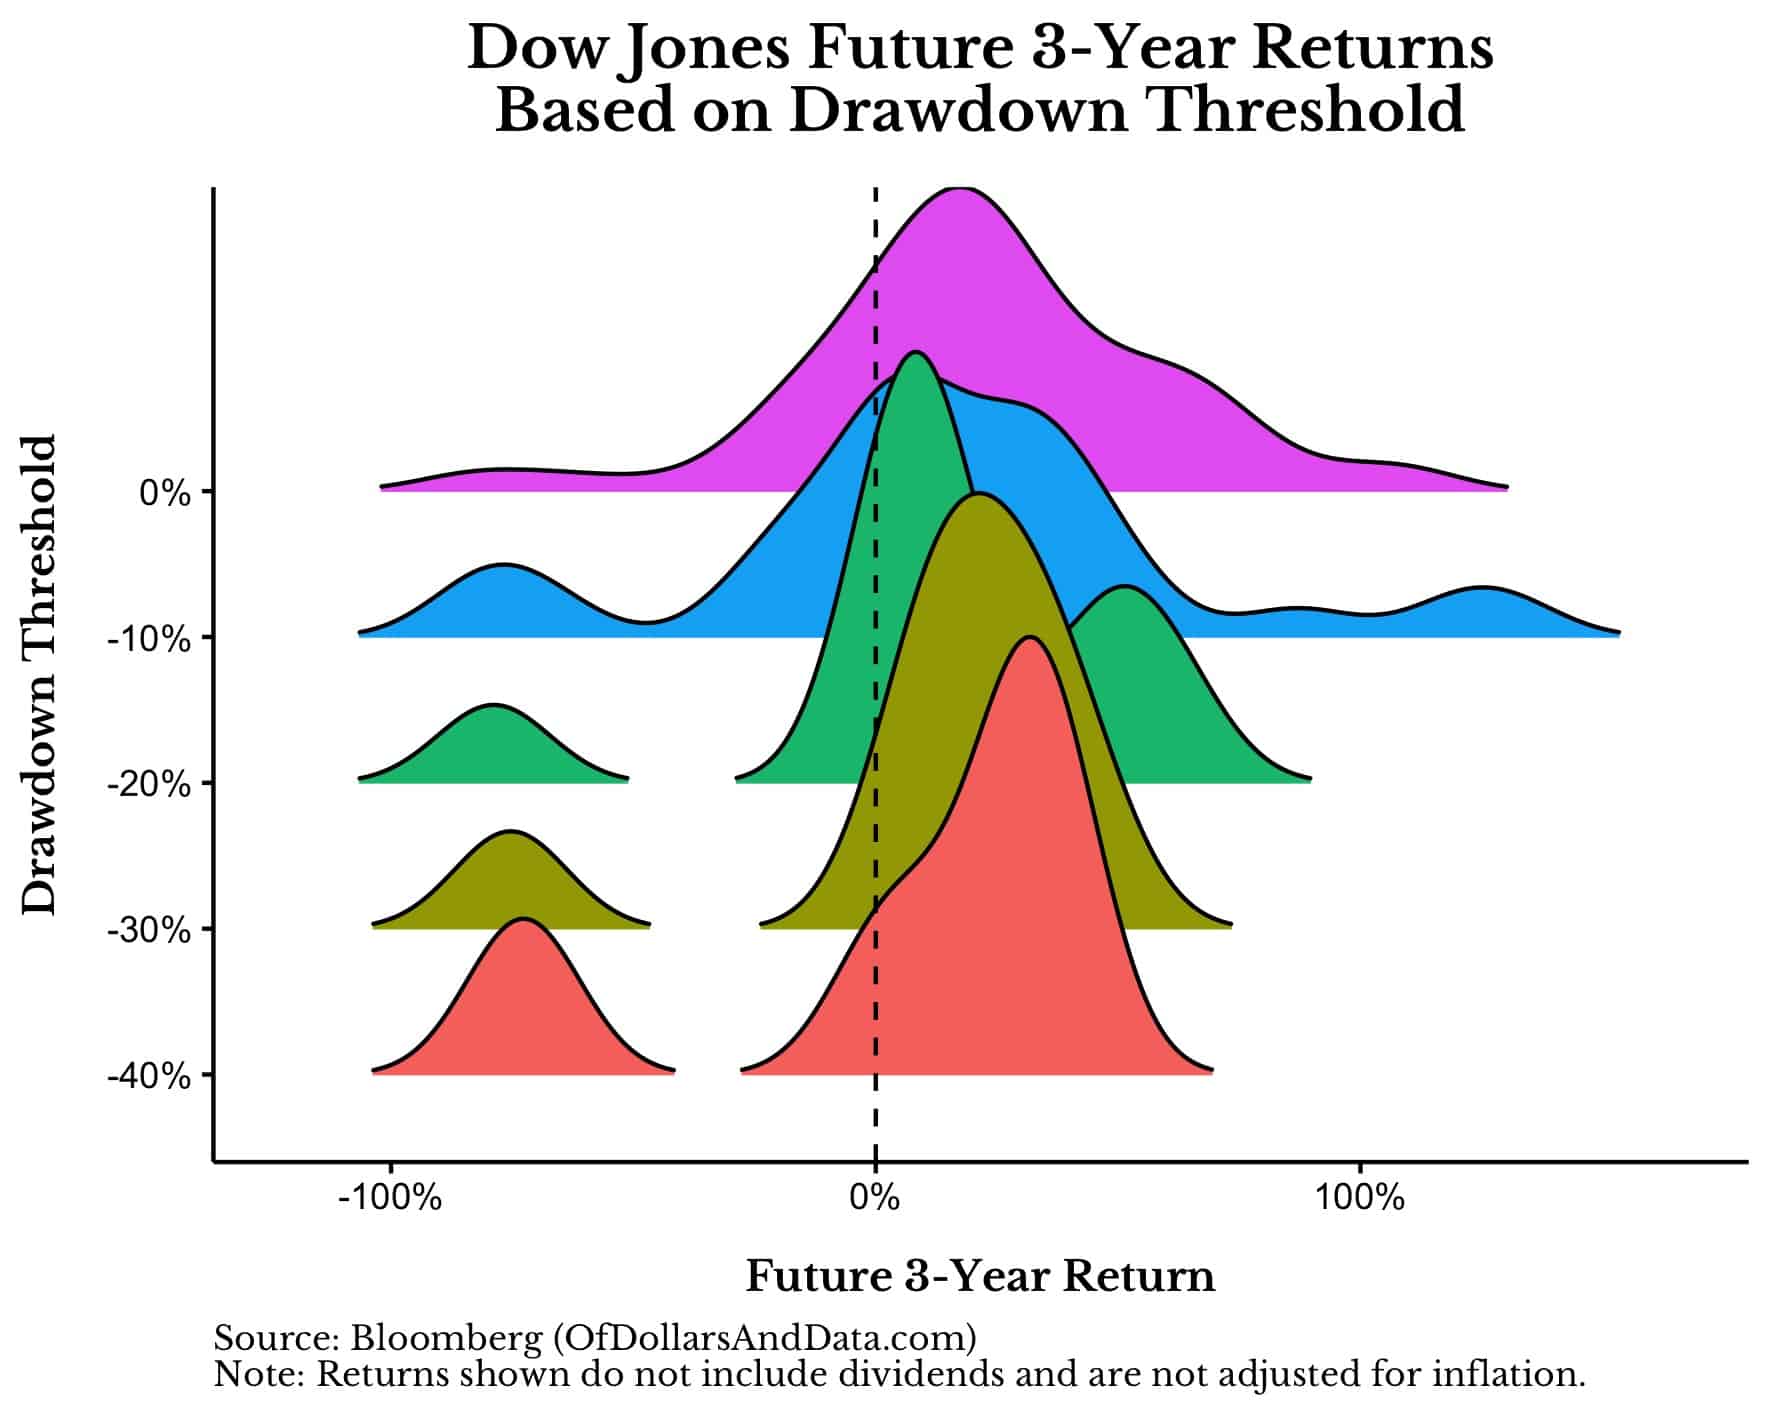
As you can see, 3-year returns tend to be positive regardless of the size of the initial market decline. More importantly, these returns tend to be more positive following larger market declines. The sole exception to this is The Great Depression (i.e. the individual humps you see on the left side of the plot).
That’s the one time in U.S. market history where things didn’t turn out okay for markets in the medium term. Given this information, we can reframe how we view market declines to provide a more optimistic outlook during darker times.
Reframing Market Declines
As the data above illustrates, most market declines (even the bigger ones) tend to experience some recovery in the short to medium term. However, there is a big exception to this rule (i.e. The Great Depression).
Therefore, when experiencing a future market decline, the only question you need to ask yourself is: will this be the next Great Depression?
Of course we cannot know this with certainty, but just play along.
If a market decline does not lead to the next Great Depression (or similar event), then you probably got all worked up for nothing. And if it does lead to the next Great Depression, then your portfolio will probably be the least of your worries. Why? Because your financial assets will probably matter far less to you than your job, your ability to get food, and much more.
In other words, it’s Great Depression or bust. And even if we experience a crash like the Great Depression once again, how much will your portfolio actually matter? It probably won’t. It’s similar to the idea of investing during the Apocalypse. Unless your asset allocation contains canned goods, guns, or private farmland, it’s irrelevant.
Thankfully, when it comes to “Great Depression or bust”, most of the time the answer is bust. Most of the time a market decline does not become a once-in-a-century kind of event. No, most market declines are far tamer. This doesn’t imply that these tamer declines can’t have devastating impacts on the economy, they definitely can. However, as the data suggests, their impact on market prices tends to be short-lived.
Lastly, I know I only relied on U.S. stock data for this analysis and that exceptions exist (yes, I’ve studied those exceptions). However, if we only invested based on what might happen, then we would never invest at all. As Franklin Delano Roosevelt stated in his 1st inaugural address on March 4, 1933:
The only thing we have to fear is fear itself.
Thank you for reading!
If you liked this post, consider signing up for my newsletter.
This is post 285. Any code I have related to this post can be found here with the same numbering: https://github.com/nmaggiulli/of-dollars-and-data

