At 10AM EST on March 3, 2020, the Federal Reserve announced that they were making an emergency 0.5% cut to the federal funds rate, reducing their target range to 1.00%-1.25%.
Immediately following this announcement, the S&P 500 shot up 2.5% before selling off throughout the rest of the day:
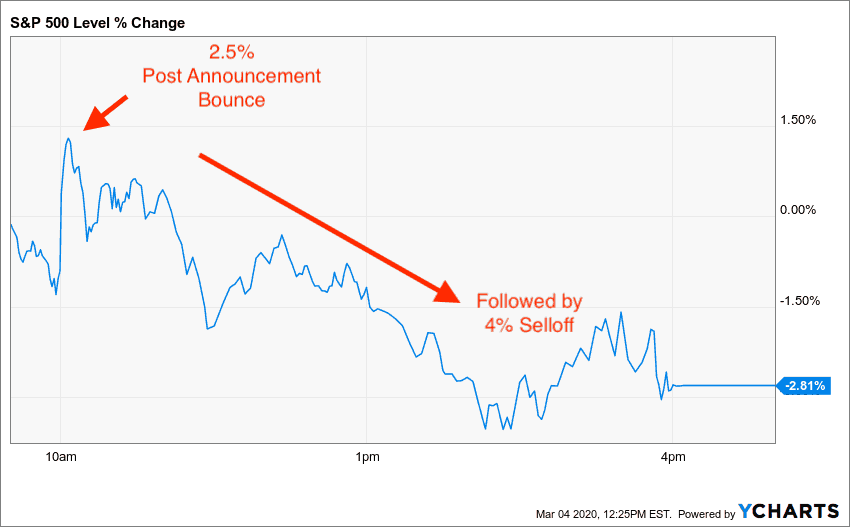
The market wasn’t having it. By the end of the day, the S&P 500 closed down 2.81%.
After seeing this happen in real time, I wanted to know: how do U.S. stocks typically perform after a Fed announcement? Do they go up? Do they decline?
To answer this, I collected data on every change to the federal funds rate since 1994 (i.e. when the Fed started publicly announcing their rate changes).
Below is a plot of the S&P 500 and all 73 changes to the federal funds rate over this time period (note: red points = when the Fed cut rates, green points = when the Fed raised rates): 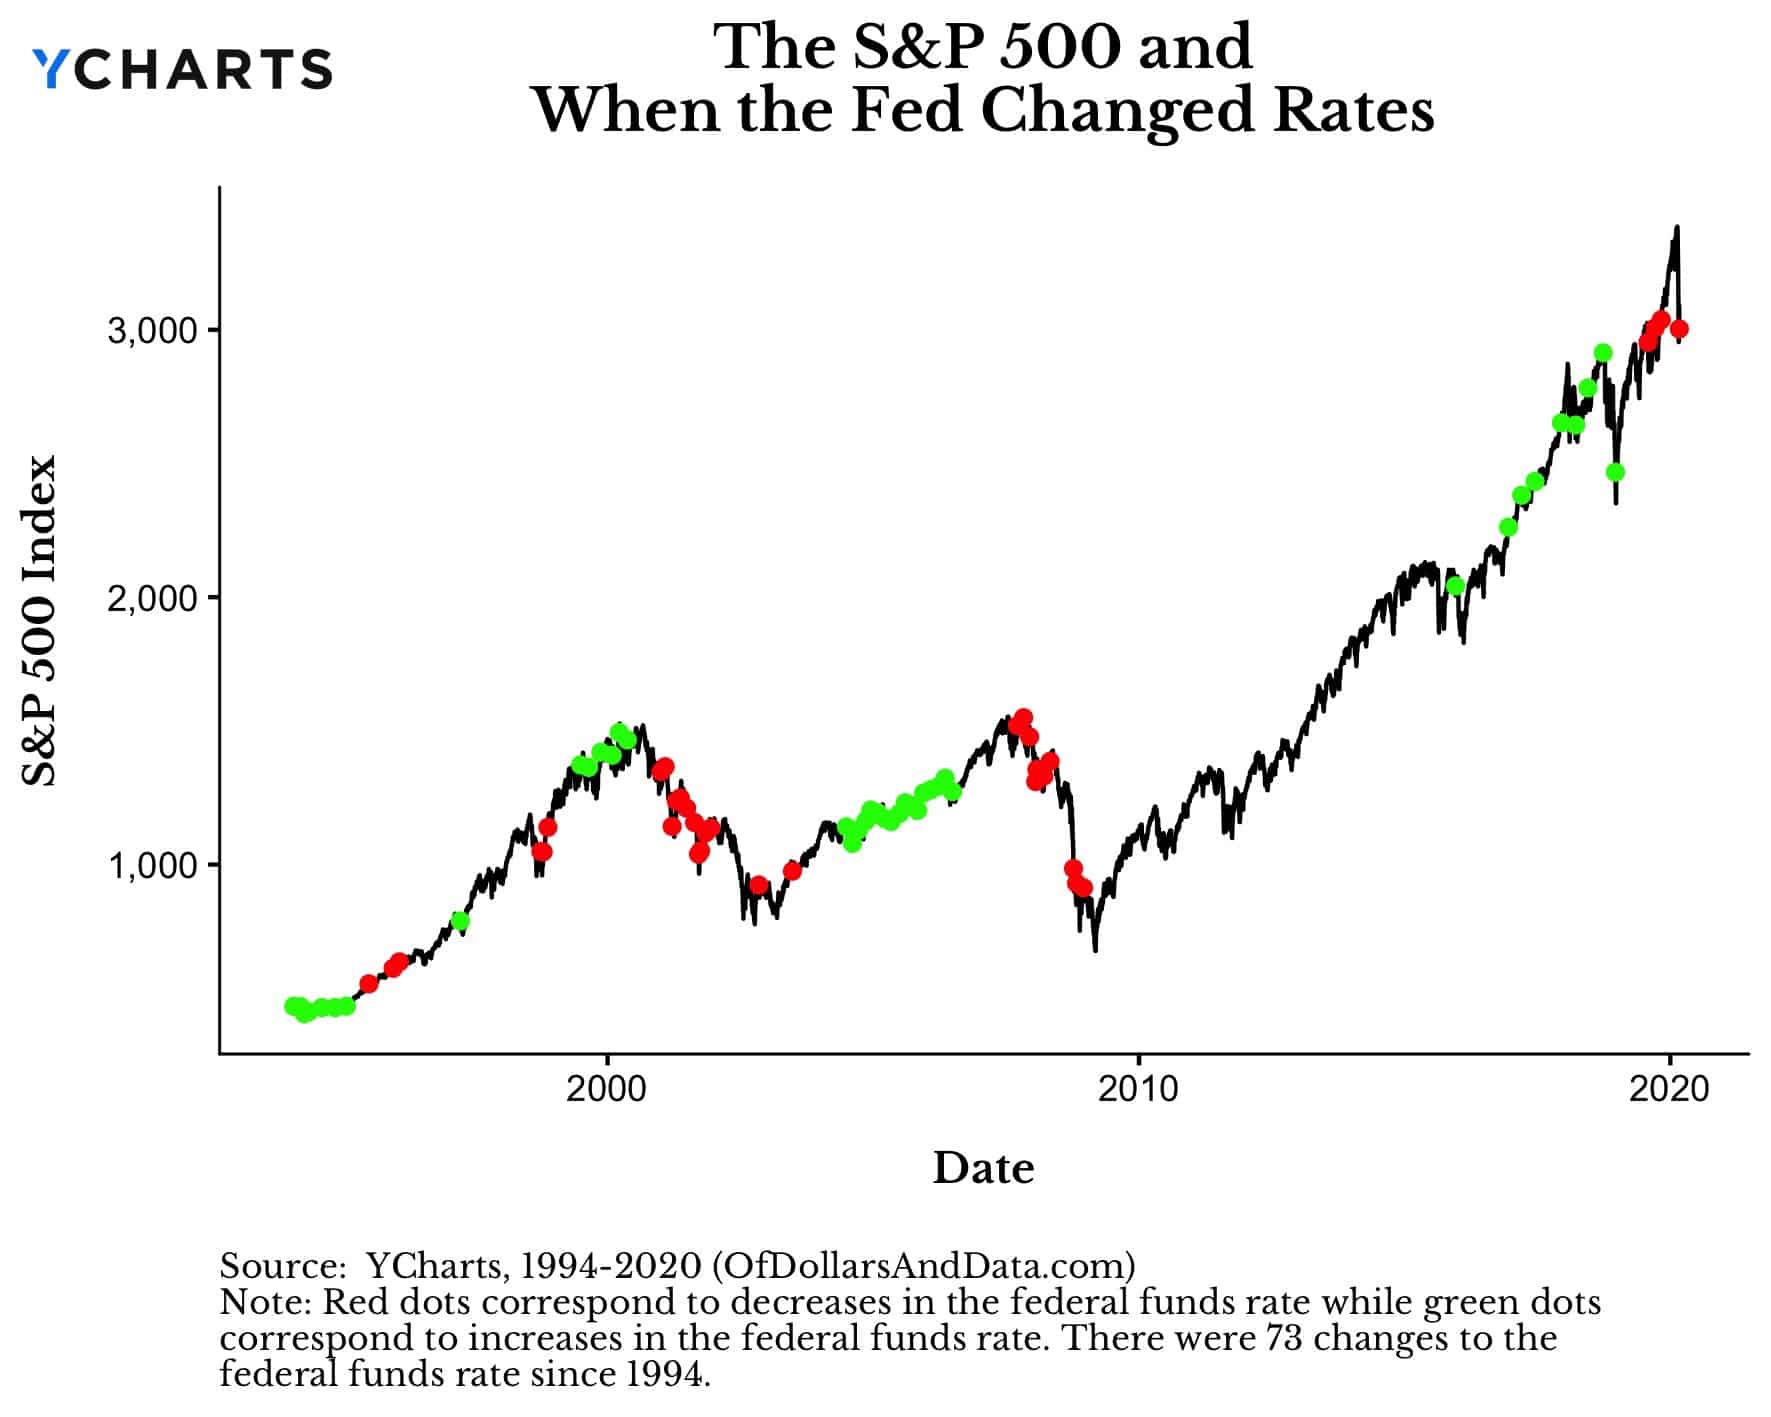
In total, the Fed has increased rates 40 times and decreased rates 33 times since 1994.
Looking at the plot above it seems like the Fed cuts rates when the stock market is falling and raises them when the market is rising. However, this is not technically the mandate that the Fed follows. The Fed is supposed to stabilize prices and maximize employment, but, after recent events, it can feel like they are trying to save the stock market.
However, this idea is anything but new. In the late 1980s the term “Greenspan put” was coined in order to describe how the Fed would typically cut rates during stock market corrections.
And if you look at the drawdowns in the S&P 500, they seem to partially correspond with rate changes:
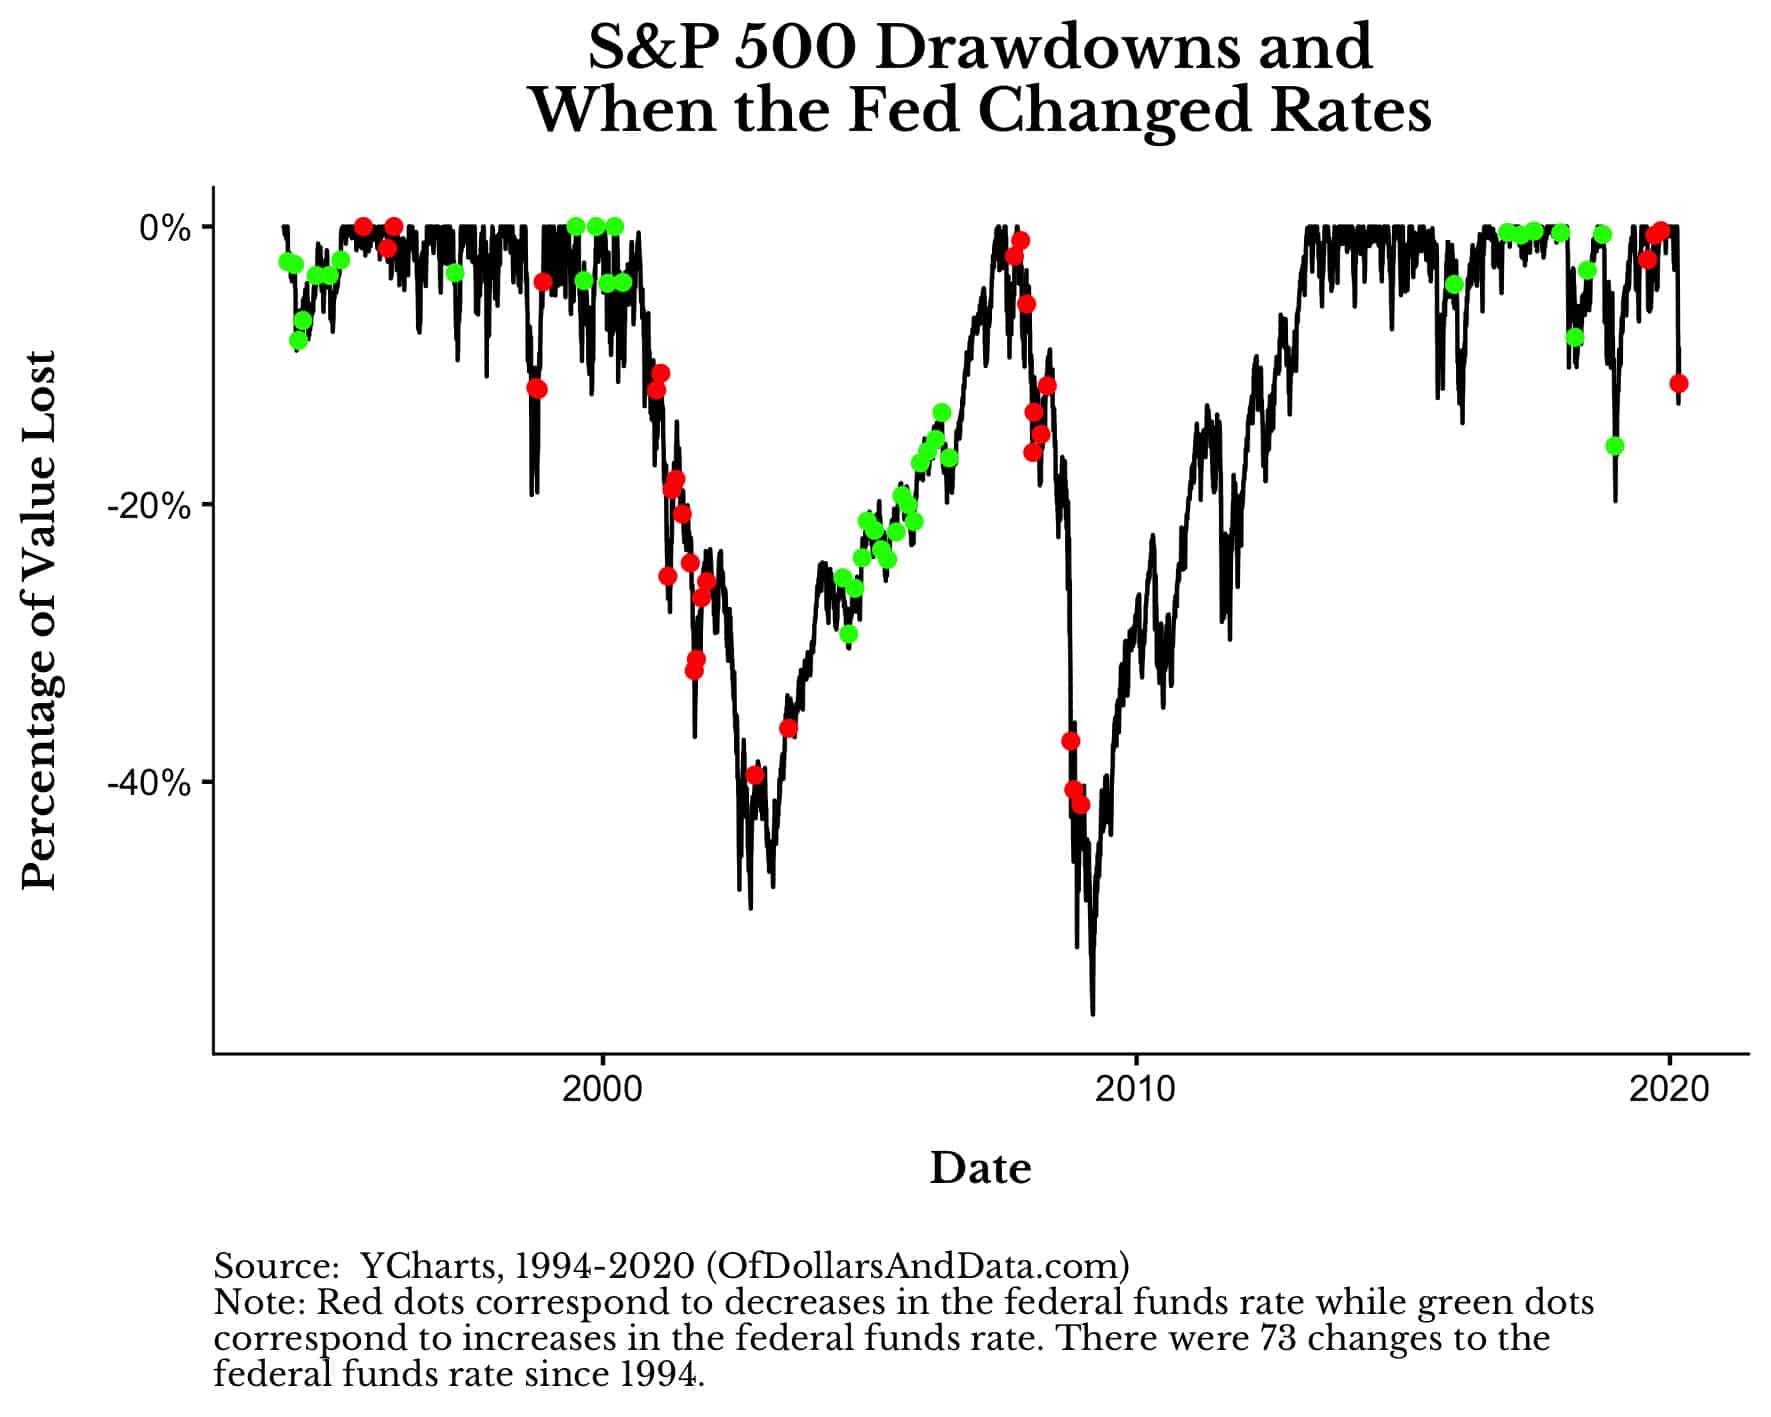
But, the real question is: when the Fed cuts rates, how does the market react?
The short answer is: we can’t know with certainty, but Fed rate cuts are usually followed by subpar U.S. stock performance.
For example, below is a plot of the median return for U.S. stocks across all days and across the days following a Fed rate cut for different forward-looking return periods:
As you can see, market performance tends to deteriorate as more time passes following a rate cut.
You can see this more clearly if we highlight how the S&P 500 performed for each of the 29 rate cuts since 1994:
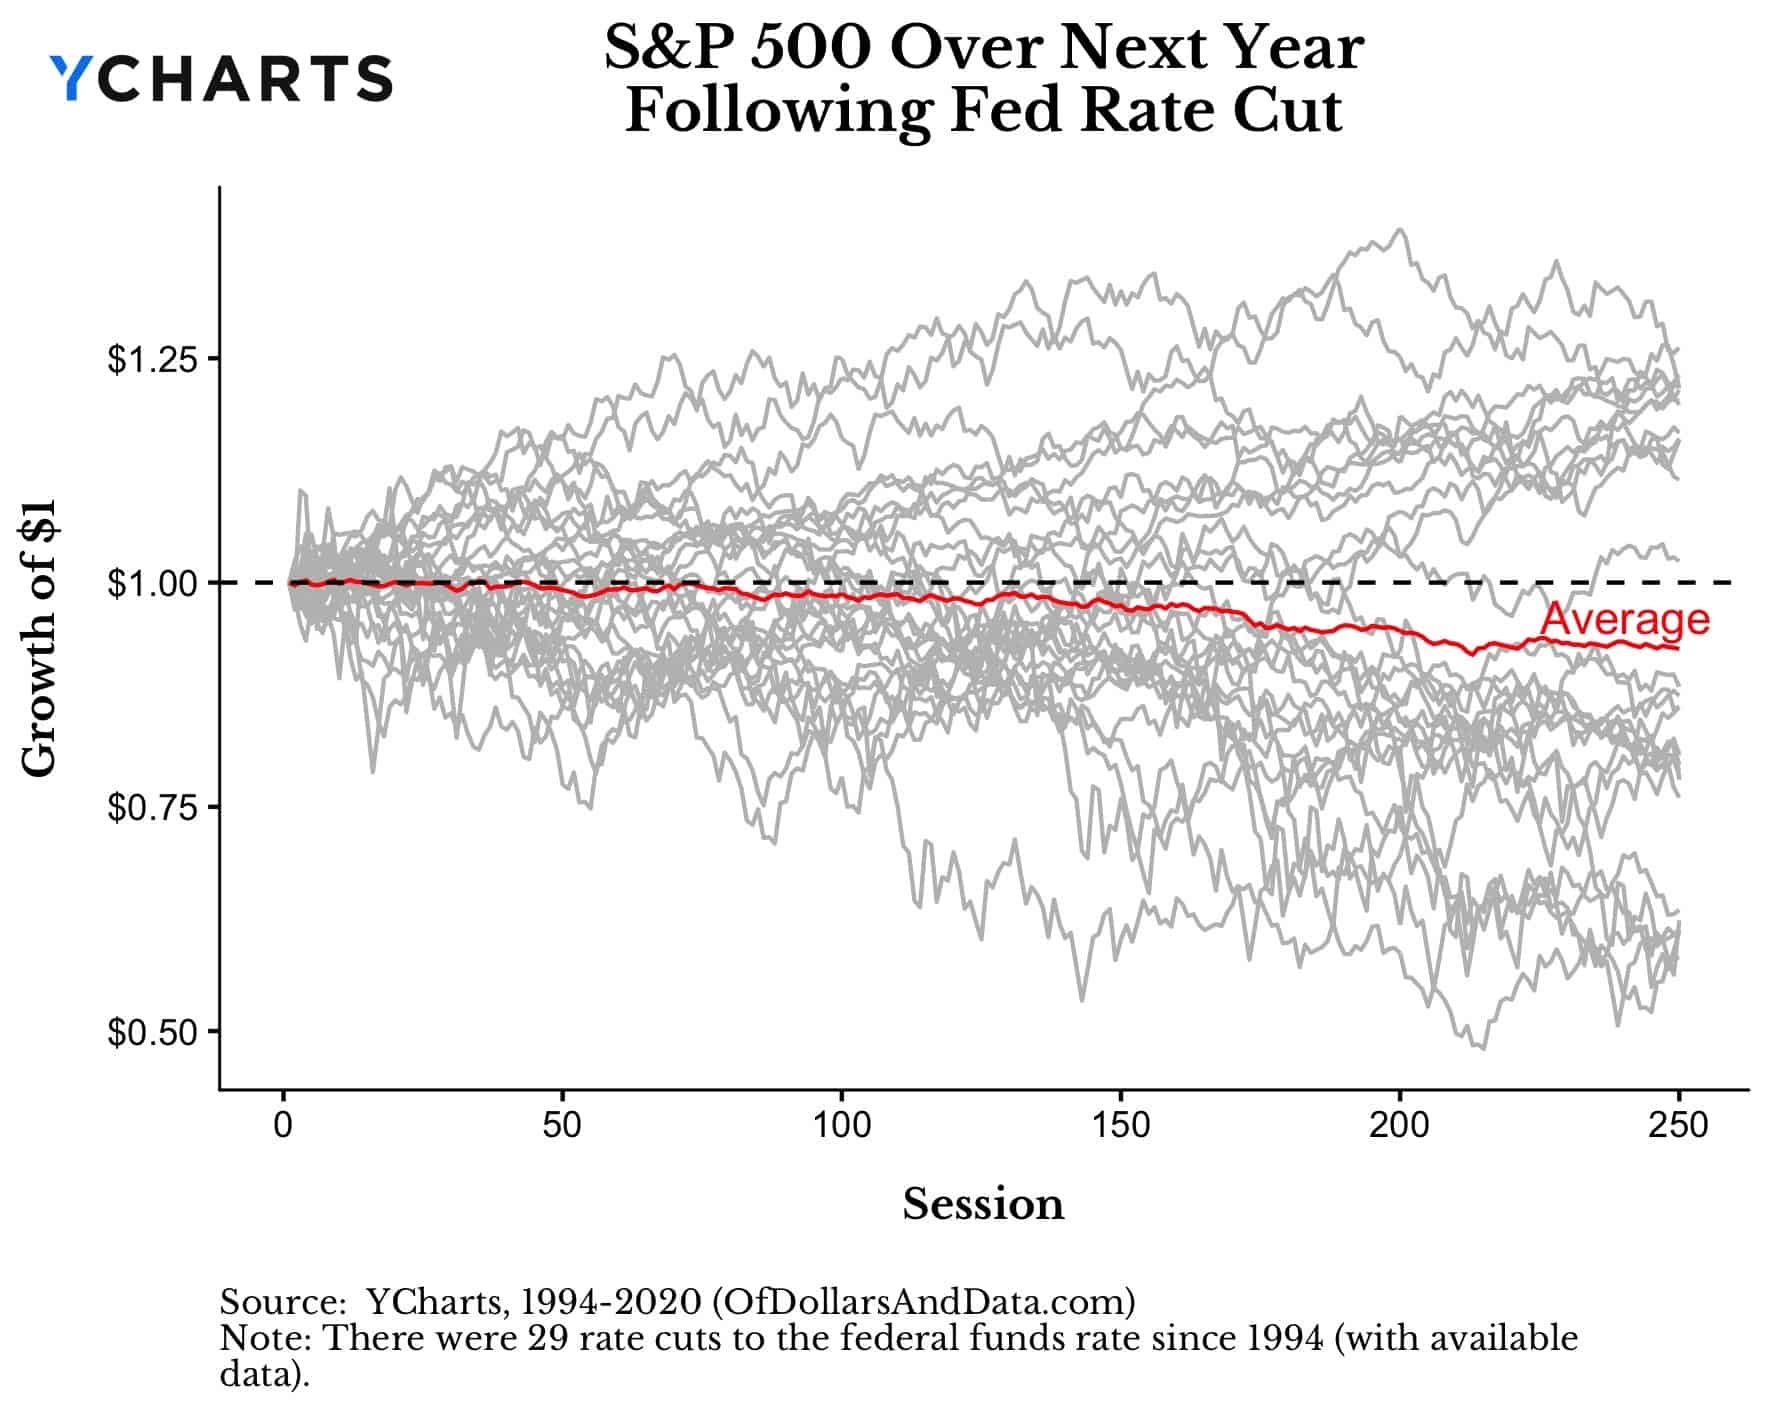
Of course I am not implying that the stock market does worse because of rate cuts, but because of the underlying problem that the rate cuts are responding to.
For all we know, these rate cuts could’ve prevented even worse outcomes in the stock market. However, since we can’t live through these alternate universes, we have to ask what usually happens following a rate cut.
And what usually happens is that markets sell off, especially following “emergency” rate cuts, as demonstrated in the plot below:
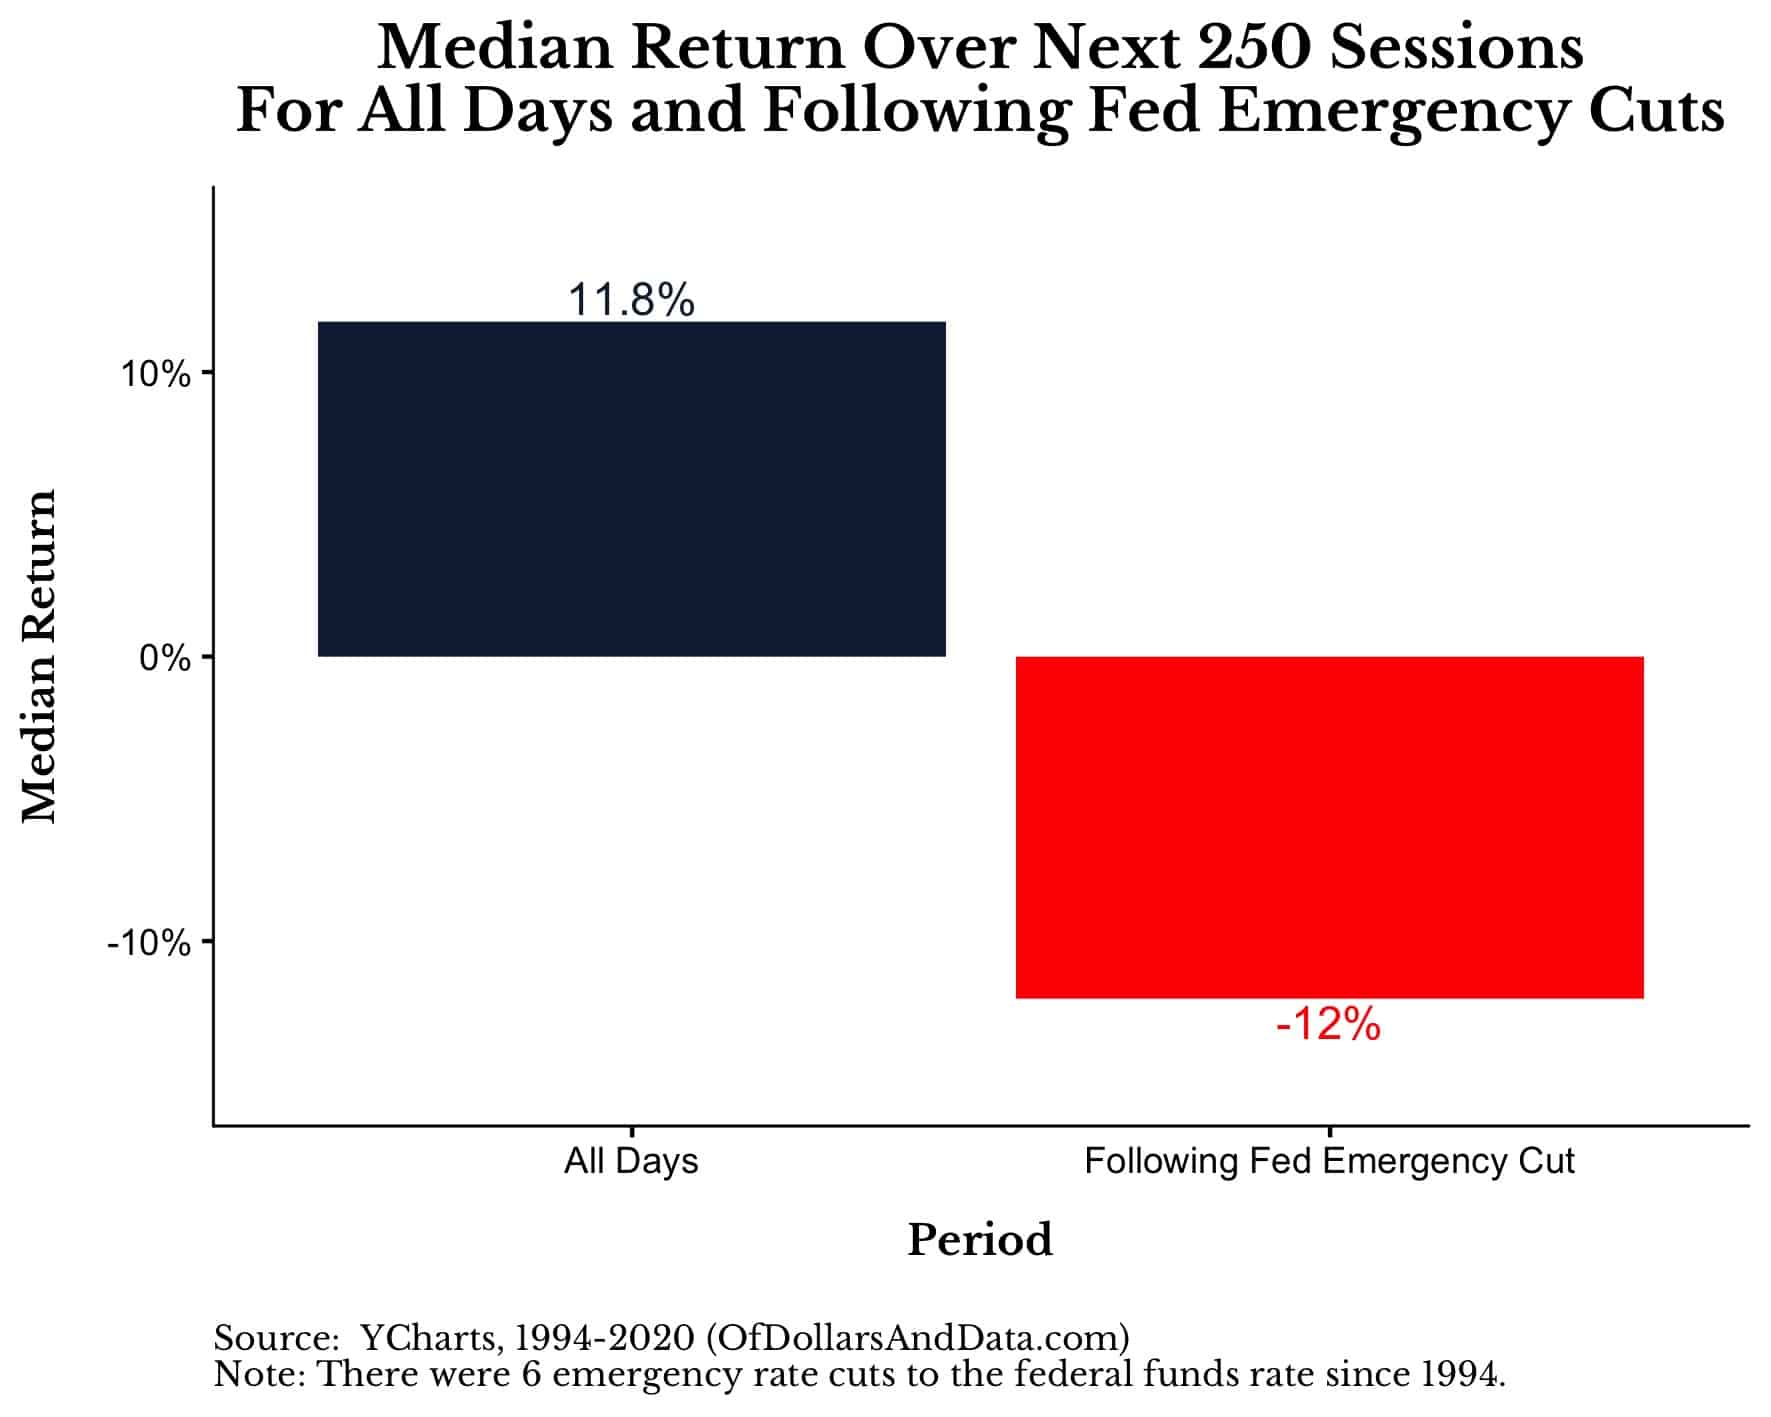
Yes the sample size for this analysis is low (i.e. only 6 emergency rate cuts), but this doesn’t change the extremity of the result. Even if I use the average (instead of the median), the 1-year return following an emergency rate cut is -7.3%.
So, though no one knows what will happen next, history suggests it might be a bit bumpy.
The Stock Market is Not the Economy
Despite the fear I may have instilled in you about how markets tend to react after rate cuts, I have another chart that should calm your fears a bit. Below I have plotted every time the Fed changed rates since 1994 against U.S. real GDP:
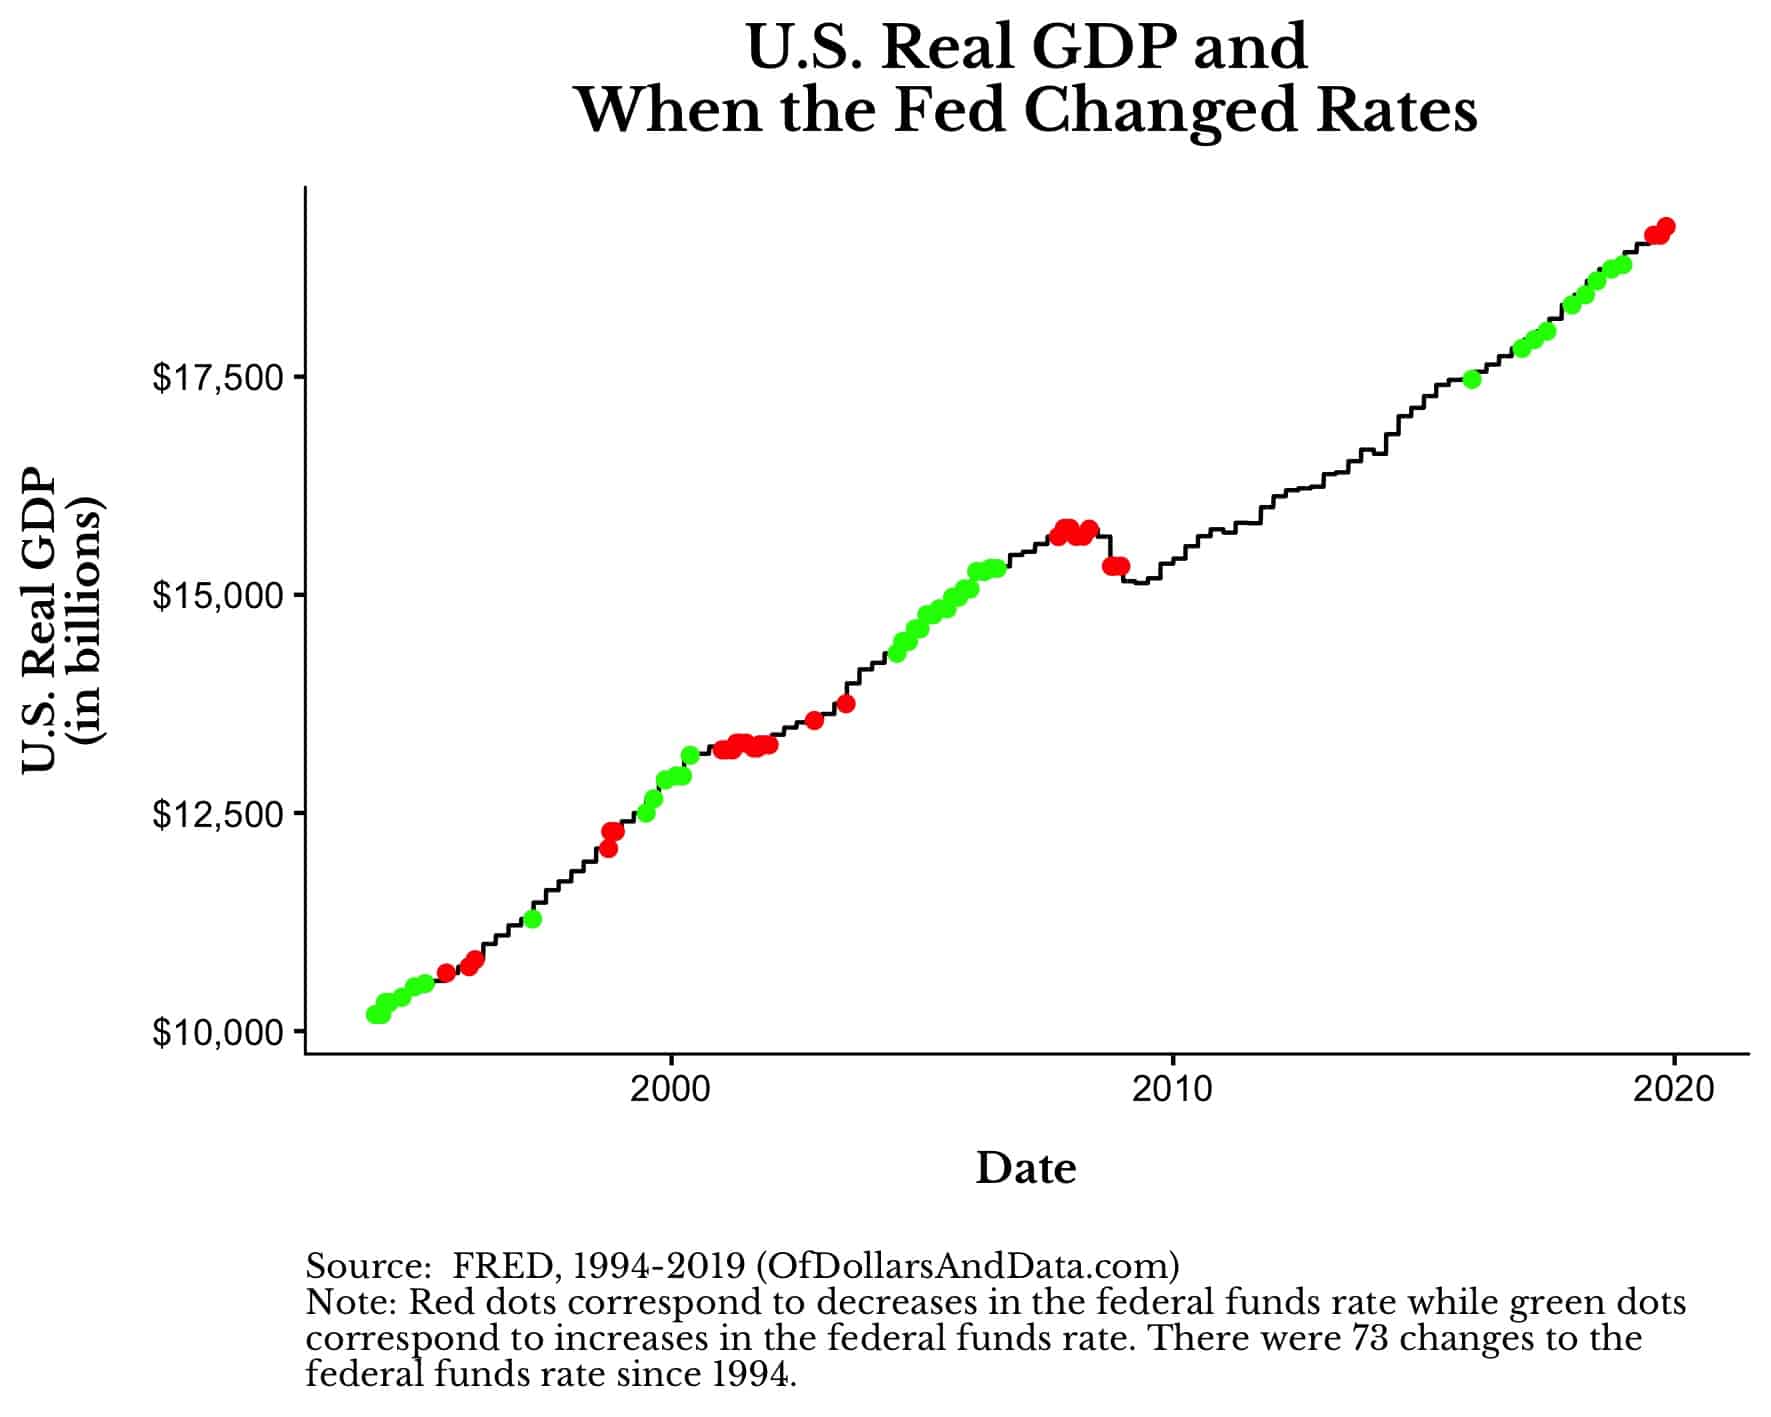
What’s amazing about this plot is how little U.S. real GDP fluctuates in comparison to the stock market.
For example, the largest decline in U.S. real GDP since 1994 occurred during the 2008 financial crisis when it contracted by only 4%:
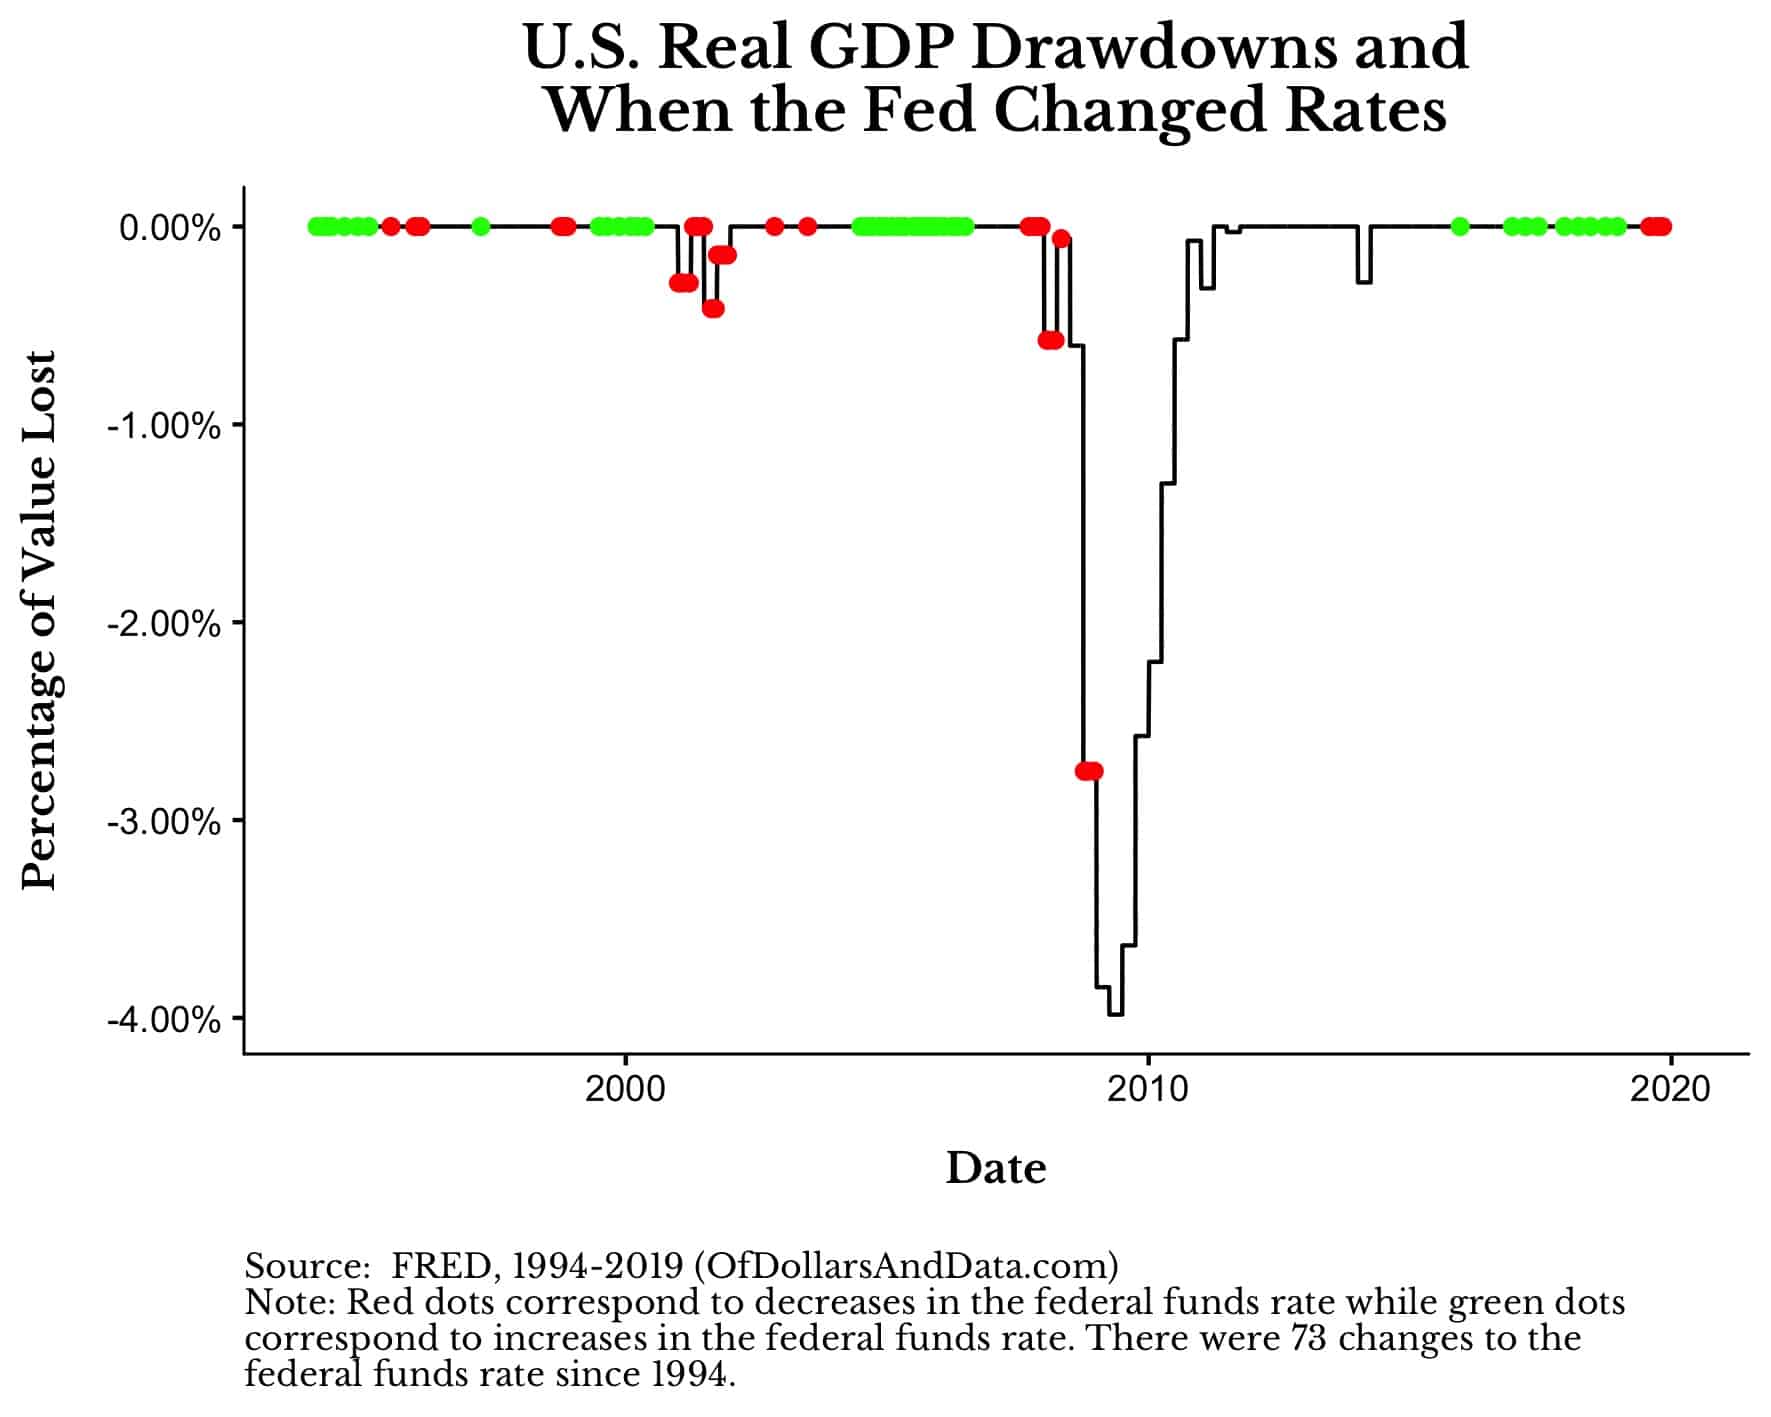
Think about that. GDP fell by 4% while asset prices were being cut in half!
This is just a simple reminder that the stock market is not the economy. Just because investors react quickly and negatively to a breaking news story doesn’t mean that those fears will ever materialize.
But this is the nature of markets. People will overreact on the upside and the downside. I just hope that you aren’t one of them.
Thank you for reading!
If you liked this post, consider signing up for my newsletter.
This is post 167. Any code I have related to this post can be found here with the same numbering: https://github.com/nmaggiulli/of-dollars-and-data

