So, it happened. You just received a lot of money. Maybe a relative passed away and left you a nest egg. Maybe you sold your business. Maybe you hit the lottery. Regardless of how you got the chunk of change you are currently sitting on, you now have to ask yourself:
Should I invest this money immediately or over time?
This question comes up a lot when we are chatting with clients. I understand the fear they (and you) may have around investing this money. There is a lot at stake. Hundreds of thousands, maybe millions, of dollars. What if the market crashes right after you invest? Wouldn’t it be better to average-in over time (i.e. dollar-cost averaging/DCA) to smooth out any unlucky timing on your part?
Statistically, the answer is no. In a paper from 2016, Vanguard found that 68% of the time it is better to invest your money right away (“Lump Sum”) rather than buying in over 12 months (“DCA”). I don’t disagree with Vanguard’s results (my results were strikingly similar), but I don’t think they went deep enough in explaining why this is true.
The main reason Lump Sum outperforms DCA is because most markets generally rise over time. Because of this positive long-term trend, DCA typically buys at higher average prices than Lump Sum. Additionally, in those rare instances where DCA does outperforms Lump Sum (i.e. in falling markets), it is difficult to stick to DCA. So the times where DCA has the largest advantage are also the times where it can be the hardest for investors to stick to their plan.
By putting these two points together I hope you come to the conclusion that you should just invest your cash now and move on with your life, because you are very likely to lose more money (in missed growth) if you don’t. I may not have convinced you yet, but I plan to. Let’s begin.
To compare Lump Sum and DCA, all you have to do is compare what a Lump Sum payment grows to and what each individual DCA payment grows to over the same buying period. When I say “buying period” I mean the amount of time you take to average-in to the market (i.e. 6 months, 12 months, etc.). Once the buying period is over, whichever strategy has more money is the winner. Why?
Because once DCA is fully invested, any subsequent returns between the two strategies will be identical going forward. This means that if over a 12-month buying period DCA has 10% more money than Lump Sum at the end of month 12, it will also have 10% more at the end of month 13, 10% more at the end of month 14, and so on.
Therefore, to compare Lump Sum and DCA, I looked at how much each strategy grew to in a 60/40 (stock/bond) portfolio over various buying periods from 1960-2018. The buying periods varied from as short as 2 months to as long as 60 months (5 years).
For example, below is a chart illustrating how DCA performed against Lump Sum in a 60/40 portfolio (using a 12-month DCA buying period) for each month from 1960-2018. The first point in January 1960 represents how much money the DCA strategy grew to (by averaging-in over 12 months) compared to how much the Lump Sum payment in January 1960 grew to over the same 12 months. I then did this for February 1960, March 1960, and so on:
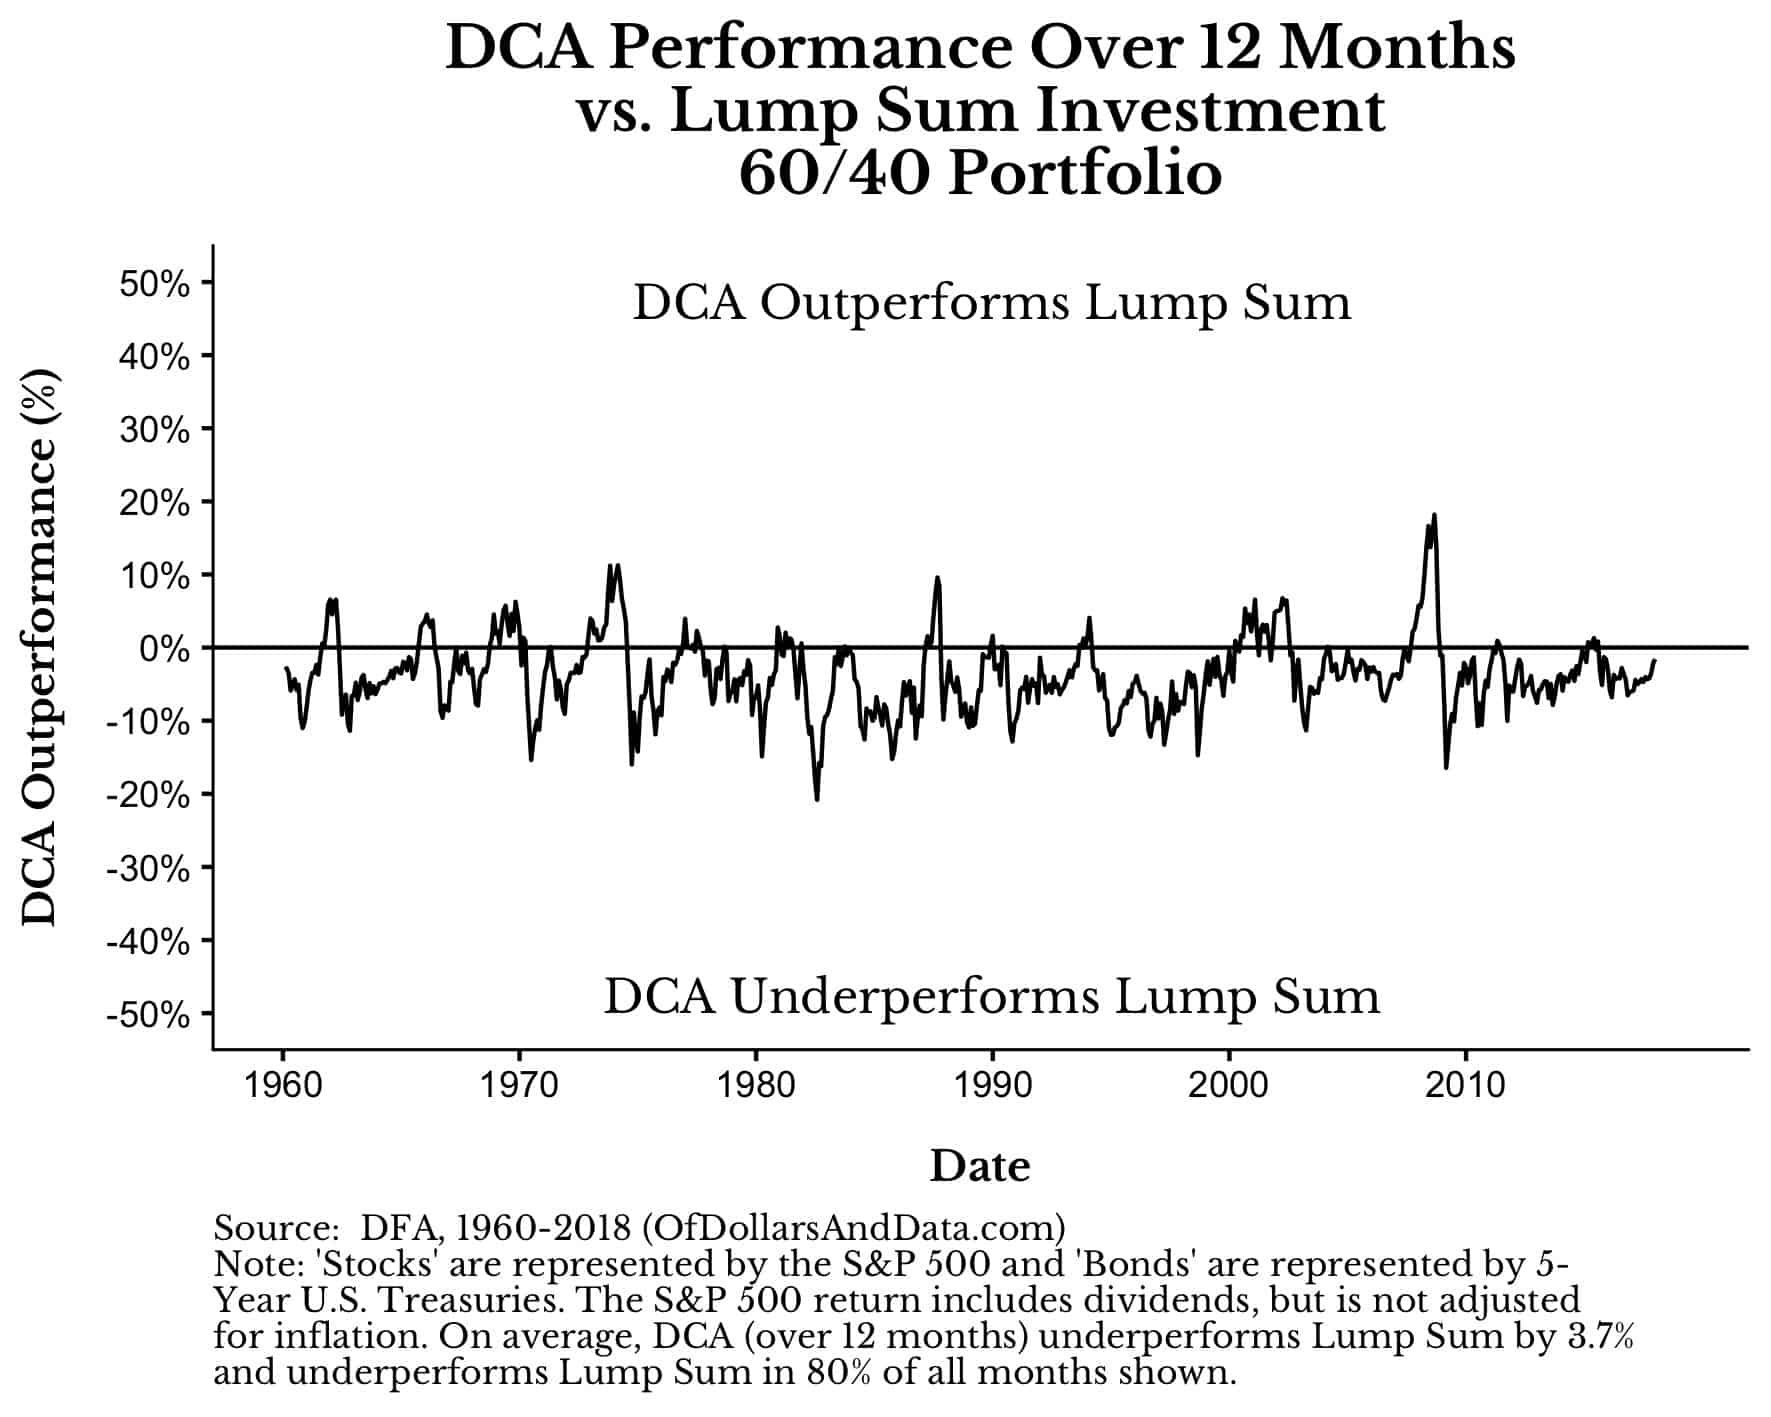
What you will notice is that DCA underperforms Lump Sum 80% of the time, but there are still a handful of periods where DCA outperforms. The most notable outperformance occurred 12 months before the bottom in March 2009. This makes sense because DCA beats Lump Sum when buying into a falling market (as I mentioned above).
However, you will also notice that immediately after the March 2009 bottom, Lump Sum immediately starts outperforming DCA again. This occurs because the market changes from a falling market to a rising market at the exact bottom (March 2009). It is at this exact inflection point that Lump Sum regains its advantage over DCA.
If we look at a distribution of DCA’s outperformance you can see the relative performance more clearly:
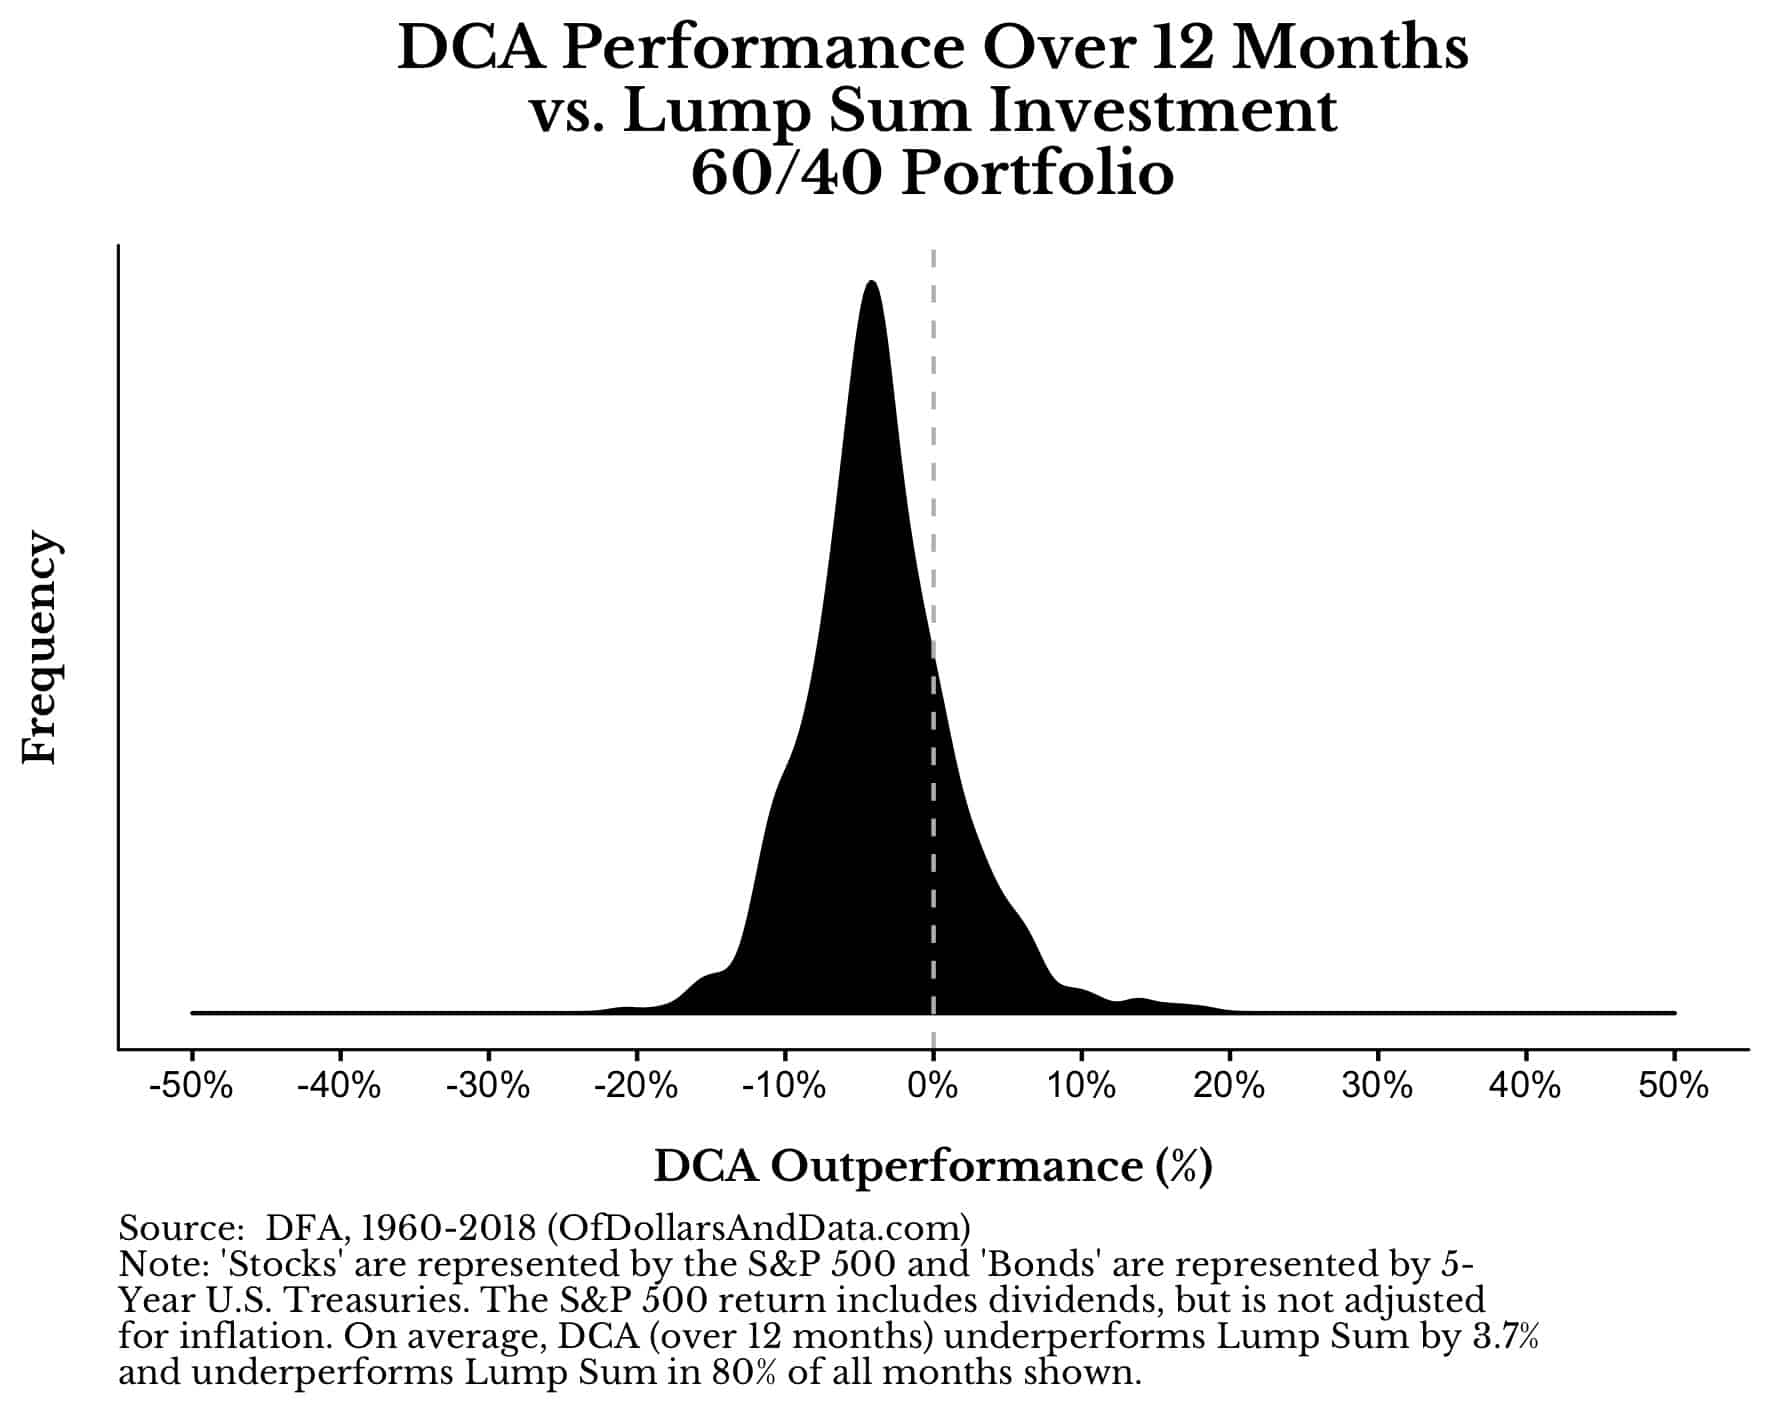
While 3.7% is the average underperformance of DCA, 5%-10% underperformance is far more common. More importantly, the distribution is quite symmetric, meaning that DCA has roughly the same amount of underperformance as outperformance at the tails of the distribution. So your fear of a market crash needs to be balanced out by the fear of being left behind as the market shoots upward.
But, it gets worse. Let’s say you think 12 months is far too short of a period over which to invest your money. You want to try something longer.
Well, as you lengthen the buying period, the chance of you outperforming doesn’t change much, but the chance of you underperforming starts to go up quickly. Specifically, as you average-in over 24 months (or more) the relative performance starts to drop precipitously.
Below is an animated plot showing the DCA outperformance over time in a 60/40 portfolio for buying periods ranging from 6 to 60 months:
As you can see, DCA underperformance increases as the length of the buying period increases. By the time you get to a 5-year DCA buying period, the chance of underperforming a Lump Sum is 95% and the average underperformance is 17%!
You can see this more directly by observing the leftward shift of the relative performance distribution as the buying period increases:
If this doesn’t illustrate the problem of waiting long periods of time to average-in your wealth, I don’t know what will.
So let’s ignore those longer periods and focus on the relative performance over a 2-year buying window:
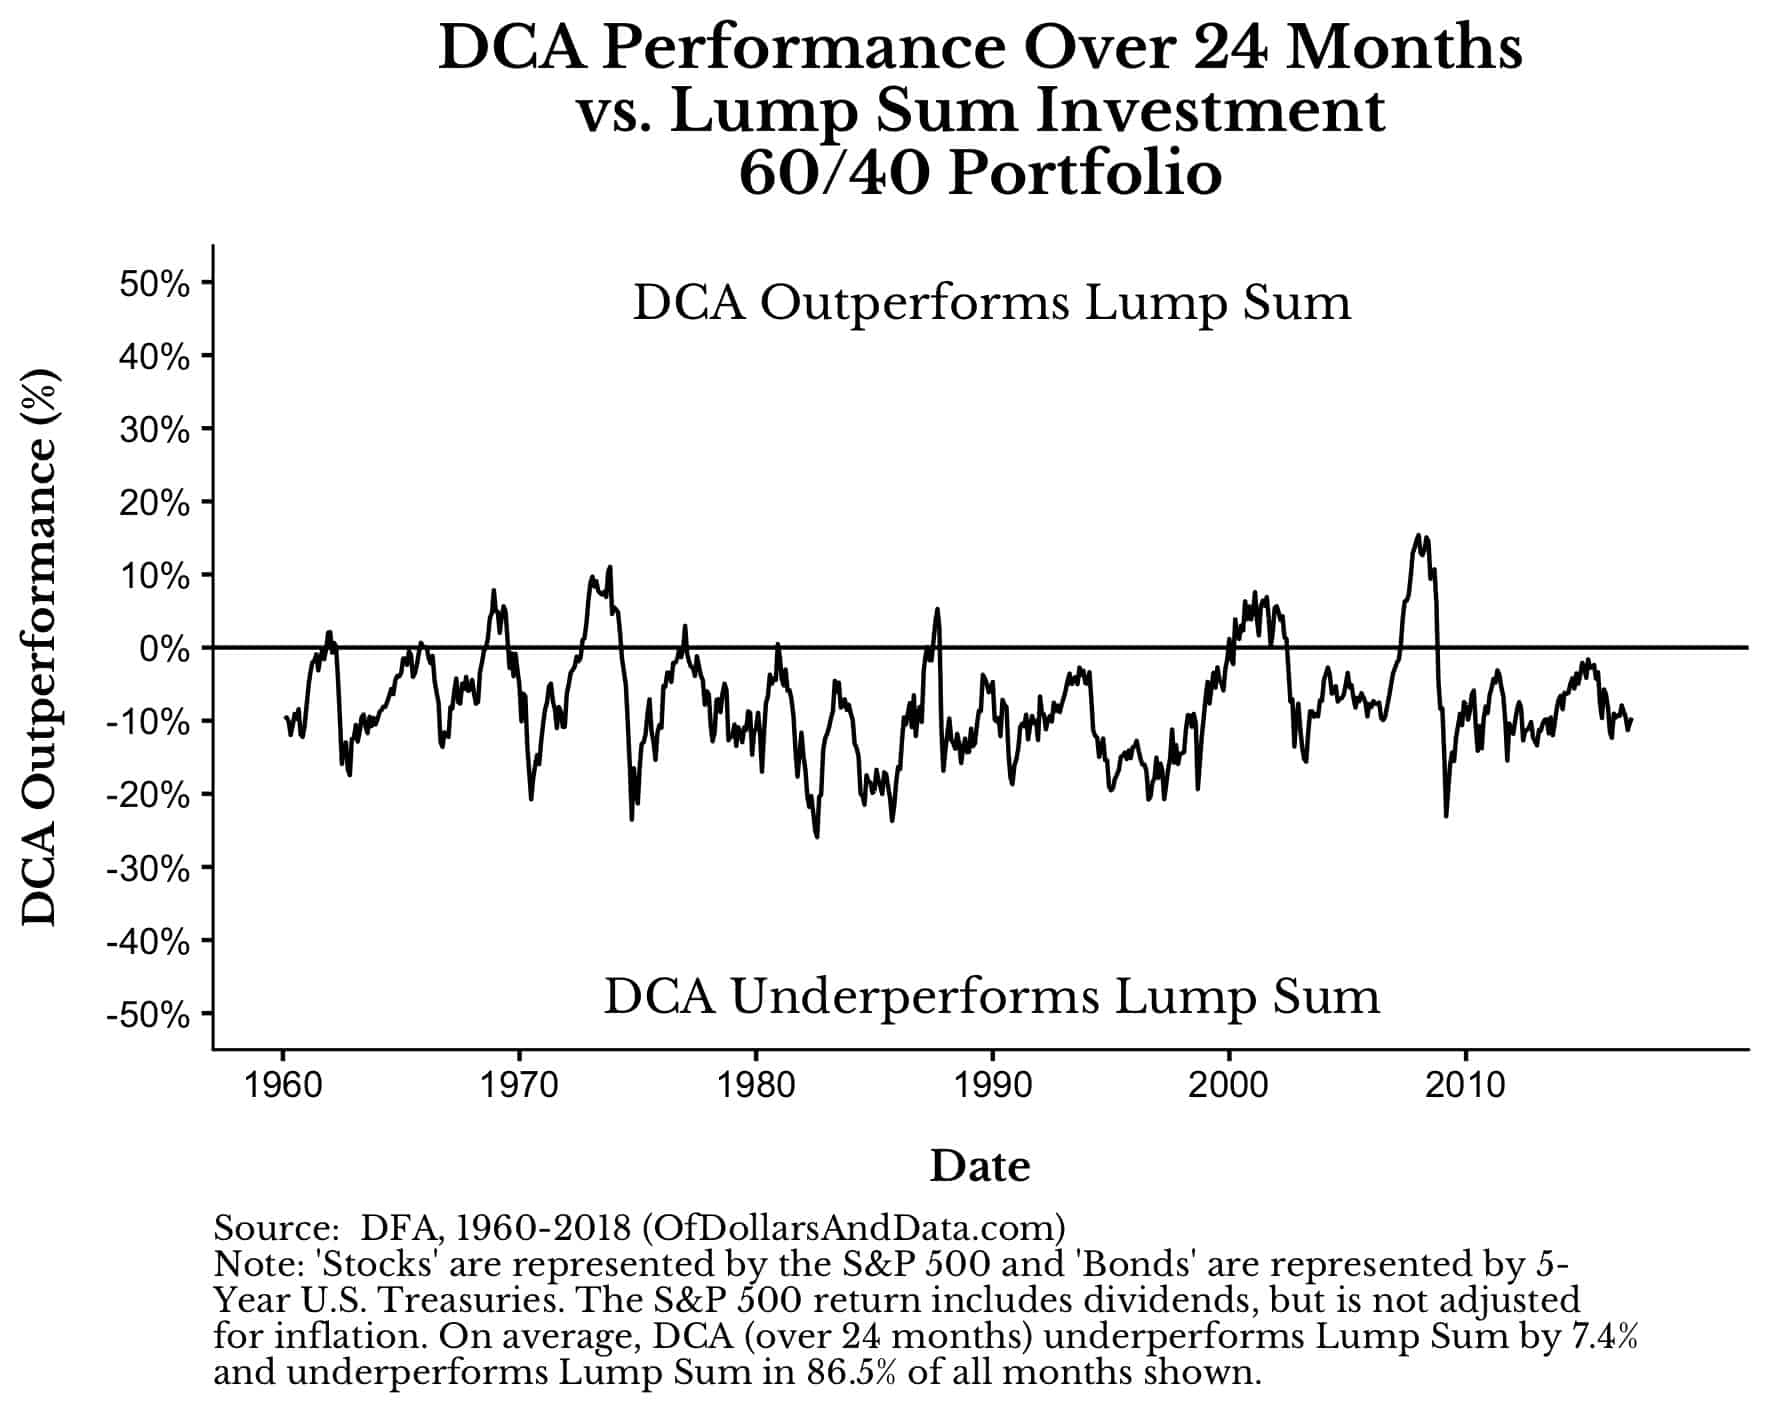
Do you really think you are going to be one of the lucky ones to start averaging-in during the handful of months above the 0% line? Or do you think it is far more likely that you will average-in during the months below the 0% line? Better yet, instead of the difference in performance between these strategies, consider the absolute performance of each for the same buying period (Note: Lump Sum = blue line, DCA = black line):
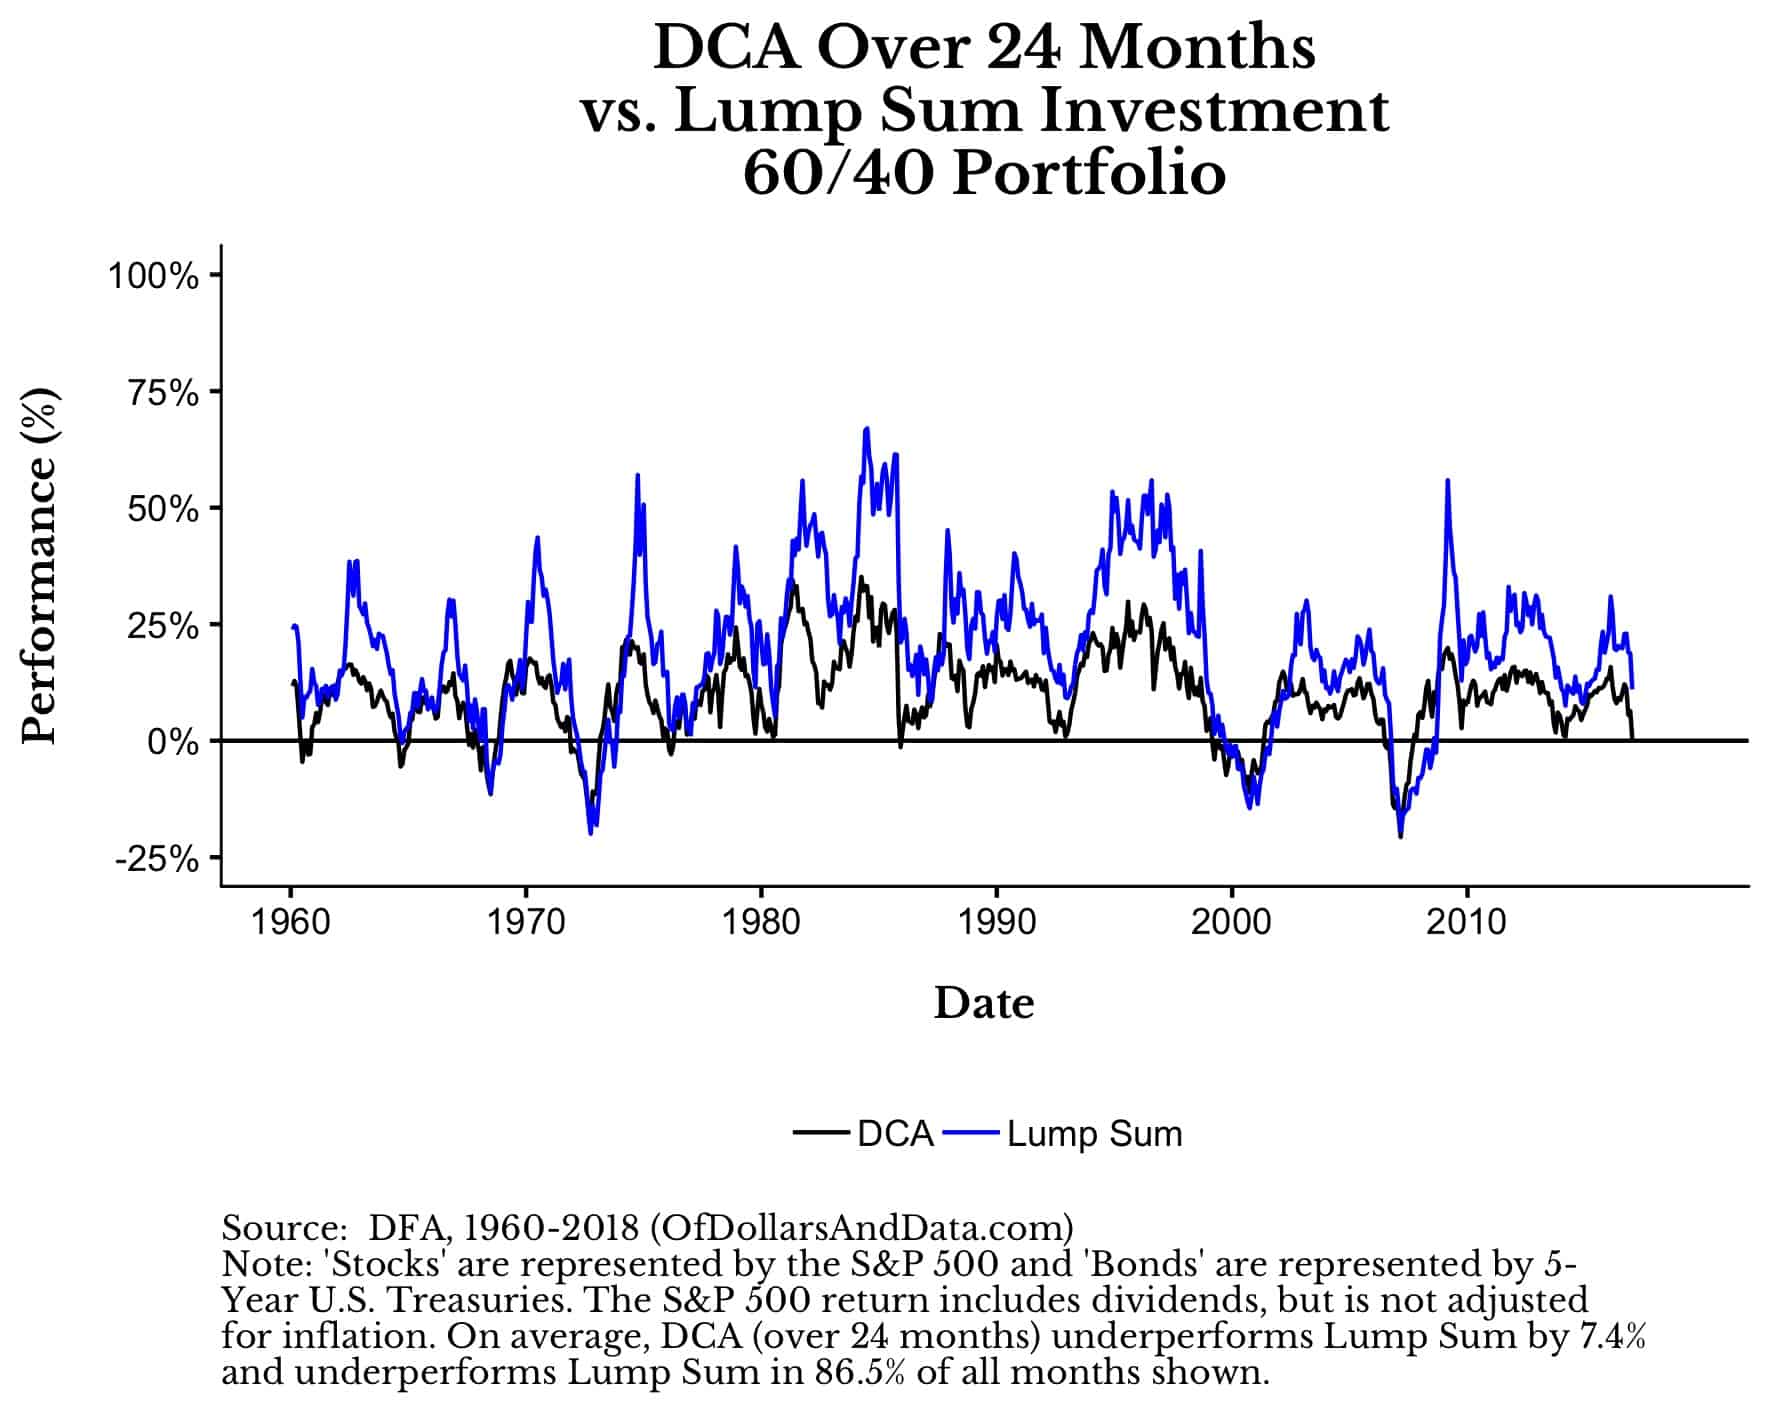 How much clearer can it get? Do you really want to choose the black line over the blue line? If you are still not convinced of the absolute dominance of Lump Sum investing over DCA, then maybe I haven’t learned my lesson from Jeremy Siegel:
Fear has a greater grasp on human action than does the impressive weight of historical evidence.
The More Important Question
If I still haven’t convinced you of the power of Lump Sum investing over DCA, then maybe YOU are not asking yourself an even more important question: What is my risk tolerance?
Anytime someone has fear about a market crash, my immediate response is that maybe their balance of risky and less risky assets is not appropriate for them. Everything I did here was for a 60/40 portfolio, but this could be done for any portfolio (with a generally positive long-term trend) and my conclusions would remain unchanged.
So, what is the largest amount of underperformance you could stomach? Once you know this, you can find a portfolio that fits you AND still do a Lump Sum investment.
Lastly, you only get one life to live. Time is your most important asset as a person and as an investor. Don’t waste it on the sidelines.
I hope this post was useful to you (or your clients, if you’re an advisor). Special thanks to Alex Palumbo and Matt Lohrius for lots of useful insights for this post based on their client experiences. Thank you for reading!
If you liked this post, consider signing up for my newsletter.
This is post 112. Any code I have related to this post can be found here with the same numbering: https://github.com/nmaggiulli/of-dollars-and-data

