What if I told you that there was a way for you to spend more money in retirement without increasing your risk of going broke? Would you be interested? Well, the good news is that you can. The bad news is that you have to be flexible. Let me explain.
Earlier this year, the popular finance/early retirement blogger The Mad Fientist reached out to me wondering whether someone could retire earlier if they were less strict with how they spent their money in retirement. Given that the early retirement community tends to be more spending conscious, he reasoned that they could use this to their advantage and cut back during difficult times in order to retire sooner in time.
And he was right. After some back and forth discussions, I ran some simulations and he published the results in a collaborate blog post a little over a month ago. If you’re interested in early retirement, this post provides a great way of thinking about how you can use spending flexibility to retire earlier.
But, I also wanted to address these results for the non-retire early crowd as well. So, if you’re interested in learning how you can spend more in retirement without increasing your risk of running out of money, read on.
How the 4% Rule Becomes the 5.5% Rule
The most popular retirement spending advice out there is the 4% rule. Based on research from William Bengen, the 4% rule assumes that you spend 4% of your portfolio each year and adjust it for inflation on a go-forward basis.
For example, if you retired with $1 million in assets and inflation was constant at 5% per year, you would spend $40,000 in year 1 [4% * $1 million], $42,000 in year 2, $44,100 in year 3, and so forth. This rule grew in popularity because of it’s simplicity and because it almost guaranteed that you wouldn’t run out of money.
But what if you could be more flexible with your spending? What if you reduced your spending in bad years? Would that allow you to spend more in good years? Yes! Depending on how flexible you can be, you could spend up to 5.5% of your portfolio instead of just 4%.
How is this possible? Because we follow a simple strategy that cuts our spending when we enter a correction or bear market. We will call this the Flexible Spending Strategy, and here’s how it works:
On December 31 of each year you check to see how far the S&P 500 is away from its all-time highs. Based on that number, your discretionary spending falls into one of three possible conditions:
- Normal market: If the S&P 500 is less than 10% away from its highs, you spend all of your discretionary spending in the next year.
- Correction: If the S&P 500 is more than 10% away from its highs but less than 20% away from its highs, you spend half of your discretionary spending in the next year.
- Bear market: If the S&P 500 is more than 20% away from its highs, you spend none of your discretionary spending in the next year.
But what do I mean by discretionary spending? Discretionary spending includes all the things in life that are nice to have, but not necessary for you in retirement. This could include nice vacations, going out to eat, or Taylor Swift concert tickets. If it feels discretionary to you, then it is discretionary. If it doesn’t, then we should consider it required spending.
Let’s put some numbers to this to make it palatable. If you had a $1 million portfolio and your expected spending was 100% required spending (i.e. no discretionary spending), then you would use the 4% rule and spend $40,000 per year (adjusted for inflation). This is the default retirement spending advice.
But what if 50% of your spending was discretionary? In that case, you could spend up to 2.75% of your portfolio every year (adjusted for inflation) as required spending and spend the other half based on the Flexible Spending Strategy above. Note that we never adjust our discretionary spending for inflation.
Using our $1 million portfolio as an example, you would get to spend $27,500 every year and adjust it for inflation for the rest of your retirement. This is your required spending and it does not change based on what is happening in the stock market.
However, your discretionary spending would change based on how the market was doing. For example:
- Normal market: If the S&P 500 is less than 10% away from its highs, you could spend an additional $27,500 in the next year.
- Correction: If the S&P 500 is more than 10% away from its highs but less than 20% away from its highs, you could spend an additional $13,750 in the next year.
- Bear market: If the S&P 500 is more than 20% away from its highs, you could spend an additional $0 in the next year.
Note that these discretionary numbers never change with inflation throughout your retirement. Whether you check the S&P 500 on December 31 in year 1 or year 30 of your retirement, you would use the numbers above and add them to your required spending (which has moved with inflation).
Putting this all together, your total spending in year 1 of retirement based on the three market conditions above would be:
- Normal market: $55,000 [$27,500 required + $27,500 discretionary]
- Correction: $41,250 [$27,500 required + $13,750 discretionary]
- Bear market: $27,500 [$27,500 required + $0 discretionary]
As you can see, during a normal market and a correction you get to spend more money than you would under the 4% rule ($40,000) because of this Flexible Spending Strategy.
But, this does come at a cost—you have to completely cut your discretionary spending during all years following a bear market. And while these bear markets only account for about 1 in 5 years going back to 1926, they tend to cluster together. This could lead to some stretches of time where you are living a very restricted lifestyle in retirement.
For example, if you had retired in 1930 using this strategy, you would have to cut all of your discretionary spending until 1944. That’s 14 years where you don’t get to spend any money on anything you consider fun or exciting. Though this is an outlier in the realm of history, you should expect to have a string of years without discretionary spending at some point if you use this strategy.
Now that we have looked at how the 4% rule becomes the 5.5% rule (with flexible spending rules), let’s see how the results fare for those with differing levels of discretionary spending.
What Are the Results for Different Levels of Discretionary Spending?
While the above example used a 50% discretionary spending percentage, not all retirees will be comfortable with this level of discretionary spending. Therefore, I created the table below which shows the probability of you not running out of money for different discretionary spending levels and withdrawal rates over a 30-year retirement (using an 80/20 U.S. stock/bond portfolio). [Note that the table included in The Mad Fientist’s blog post uses a 40-year retirement since he was primarily writing for those who would like to retire early.]
To use this table effectively, you should first estimate what percentage of your spending will be discretionary in retirement. Then, go to that column in the table below and go down until you find the percentage chance of not running out of money that you feel comfortable with:
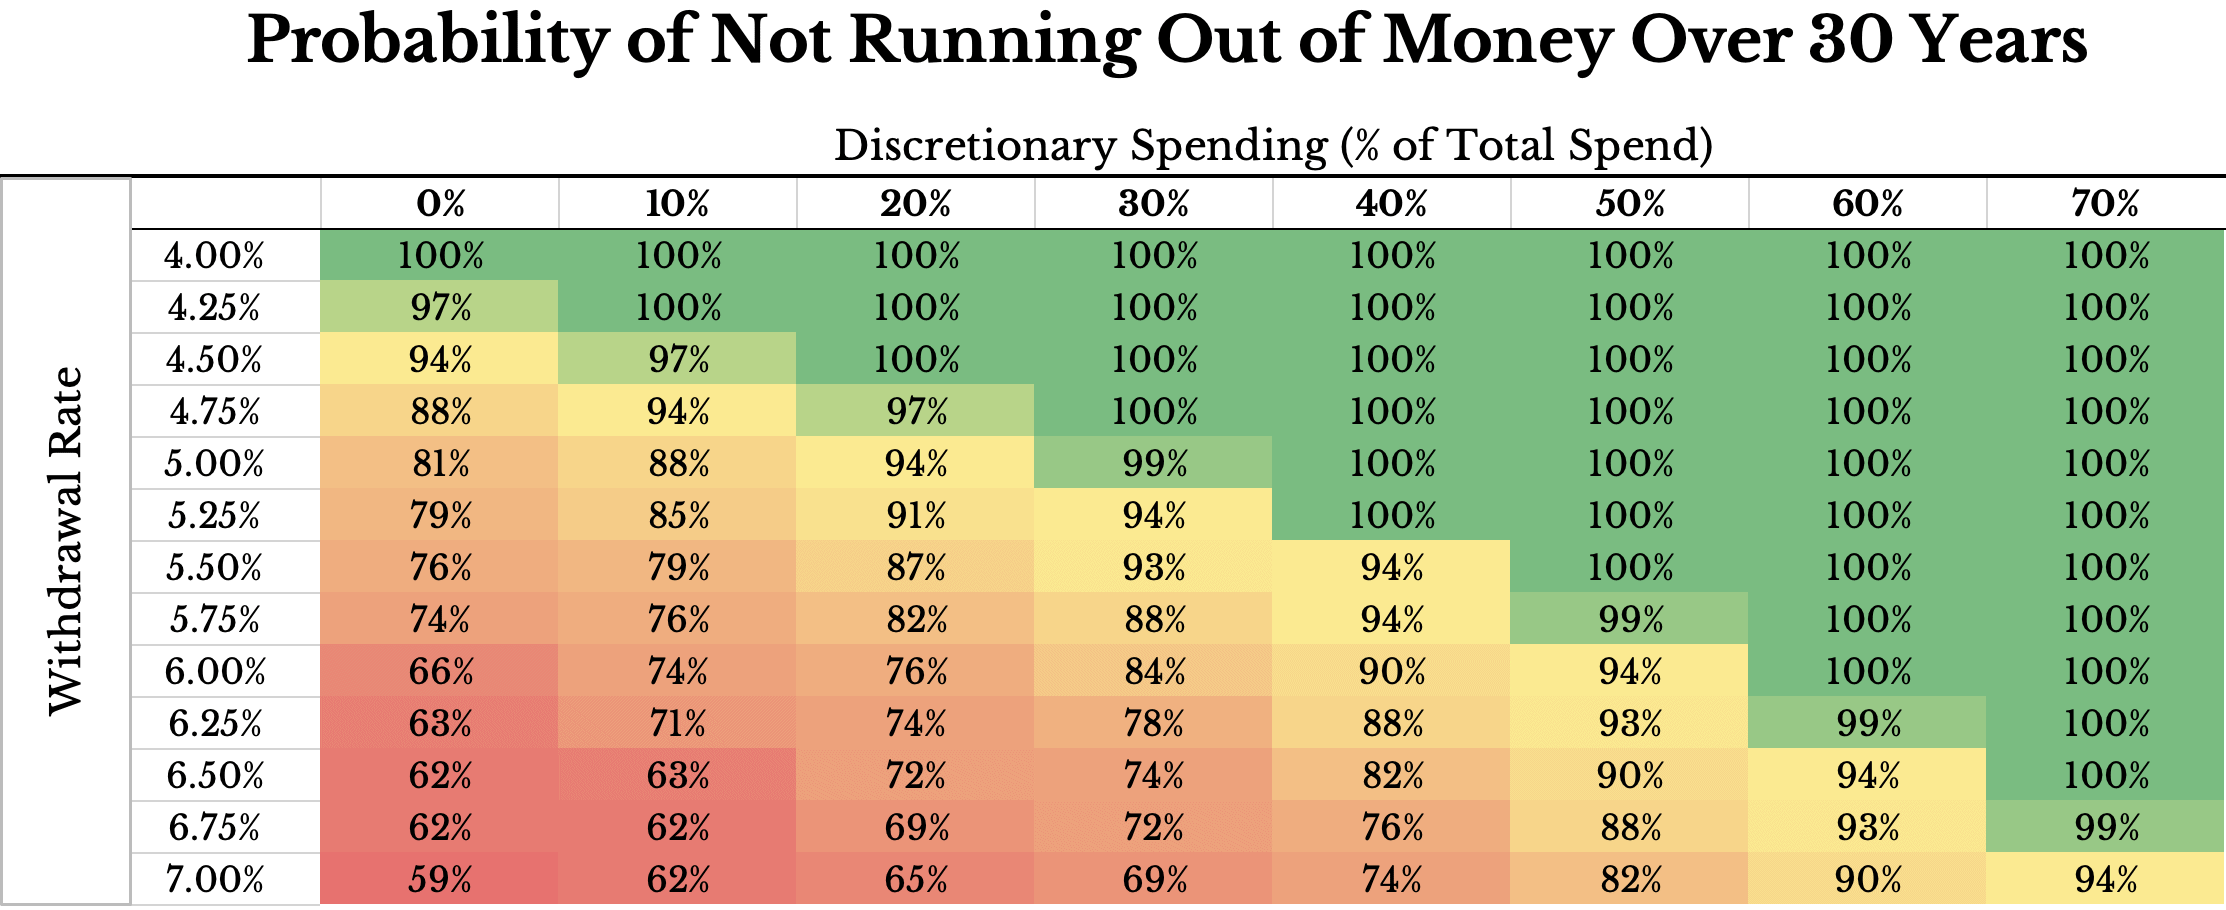
For example, if you had 0% discretionary spending and wanted a 100% chance of not running out of money over 30 years, you would choose a withdrawal rate of 4% (i.e. the 4% rule).
However, if 30% of your spending was discretionary (move 3 columns to the right), you could increase your withdrawal rate to 4.75% and still have a 100% chance of making it through 30 years of retirement. Of course, this is based on historical simulations since 1926 where you follow the Flexible Spending Strategy detailed above.
The best part about this table is that once you know roughly how much of your spending will be discretionary in retirement, you can approximate how much you could withdraw in retirement (i.e. your withdrawal rate) while utilizing the Flexible Spending Strategy.
Now that we have seen the full set of results based on your discretionary spending percentage, let’s dig into why this strategy actually works.
Why Does the Flexible Spending Strategy Work?
If you want to know why Flexible Spending Strategy allows you to withdraw more in retirement (at least in most years), you need to understand the concept of sequence of return risk and how it impacts retirees. The basic idea is that you want to withdraw less money when your portfolio is down because every extra dollar you withdraw during a major decline doesn’t have the chance to recover. To illustrate this, let’s imagine the following scenario:
- It’s the morning of the last trading day of 2023.
- You have a $1 million retirement portfolio.
- You plan to take a $100,000 withdrawal from this portfolio on the first trading day of 2024, which would leave you with $900,000 for 2024.
- Unfortunately, as soon as the market opens, your portfolio declines by 20% and you end 2023 with $800,000.
- On the first trading day 2024 you take your $100,000 withdrawal as planned, leaving your portfolio with $700,000 [$800,000 – $100,000].
- Over the course of 2024 your portfolio recovers and goes up by 25%. This offsets the 20% loss experienced at the end of 2023 (i.e. the total 1-year return is 0%).
- How much money do you have at the end of 2024?
The correct answer is $875,000 [$700,000 * 1.25]. Unfortunately, this is $25,000 less than the $900,000 you expected to have after taking your withdrawal at the beginning of 2024.
Where did that extra $25,000 go? It disappeared due to sequence of return risk. Because you withdrew $100,000 after a 20% decline, that $100,000 never got to experience the 25% recovery that followed in 2024. As a result, your portfolio ended up being $25,000 below where you expected it to be.
This is where the Flexible Spending Strategy stands out. Because, if the market ends the year being at least 10% off its highs (and you end up following the Flexible Spending Strategy) you won’t withdraw as much in the following year. This prevents you from proverbially kicking your portfolio while its down.
This is why the Flexible Spending Strategy works. You get to withdraw more in the good years because you withdraw less in the bad years.
Now that we’ve examined why the Flexible Spending Strategy works, let’s wrap things up by demonstrating the implications of this strategy for your retirement.
The Bottom Line
There are two tangible ways in which the Flexible Spending Strategy can benefit you:
- You can spend more in retirement, or
- You can save less for retirement.
And, if you think about it a little, you will realize that these are basically the same thing. For example, if you want to spend $40,000 a year in retirement, you could either:
- Save $1 million and use the 4% rule (with 0% discretionary spending), or
- Save $727,272 and use the 5.5% rule (with 50% of your spending being discretionary under the FSS)
In this case, the Flexible Spending Strategy would allow you to retire with $300,000 less than what you thought you needed originally.
On the other hand, if you had $1 million saved for retirement, you could:
- Spend $40,000 a year using the 4% rule (with 0% discretionary spending), or
- Spend $55,000 a year (in most years) using the 5.5% rule (with 50% of your spending being discretionary under the FSS)
Whether you want to spend more or save less, the Flexible Spending Strategy can be beneficial for anyone willing to make the necessary tradeoffs. And, yes, this strategy has tradeoffs like any other retirement spending strategy. There is no free lunch. There is no silver bullet. If you want to spend more in retirement you have to either: (1) take on more risk (i.e. increase the chance you run out of money) or (2) spend less money at least some of the time.
The Mad Fientist and I wanted to emphasize this point because we realized that all of these decisions come down to tradeoffs. And we wanted our readers to be informed of these tradeoffs so they could make the choice that was right for them. So whether you have a 30-year retirement or a 60-year retirement ahead of you, if you want to spend more, you just have to be flexible.
A HUGE thank you to The Mad Fientist for inspiring this collaboration. If you want to dive deeper on this, check out our recent episode of the Earn & Invest podcast. And, as always, thank you for reading!
If you liked this post, consider signing up for my newsletter.
This is post 354. Any code I have related to this post can be found here with the same numbering: https://github.com/nmaggiulli/of-dollars-and-data

