It was late 1999 and Warren Buffett had experienced his worst year in a decade. While the S&P 500 was up over 20%, Berkshire Hathaway’s stock price was down 20%. Some started to believe that Buffett had lost his magic touch.
An article titled “What’s Wrong, Warren?” from late 1999 captures this sentiment:
Indeed, Buffett has even started taking flak on Internet message boards. One contributor called Berkshire a “middlebrow insurance company studded with a bizarre melange of assets, including candy stores, hamburger stands, jewelry shops, a shoemaker and a third-rate encyclopedia company [the World Book].”
Some had begun to feel that Warren Buffett was an old man who was out of touch with the internet economy of the late 1990s. But you already know how this story ends.
In the 3 years that followed, Berkshire’s stock increased in value by 29% while the S&P 500 lost 37% by the end of 2002. The Oracle of Omaha had the last laugh.
This story illustrates how, despite being one of the best money managers of all time, Warren Buffett still has periods of underperformance. Ben Carlson summarized this idea well with a table showing Berkshire’s largest price declines since 1980:
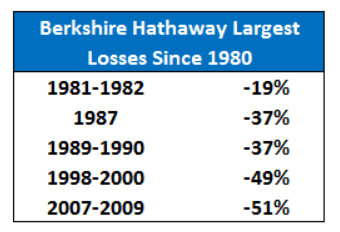
As you can see, Berkshire has temporarily declined in value 30-50% multiple times in the last few decades. The question is: If Warren Buffett has periods of underperformance, why would you expect anything differently for your personal portfolio?
This question is important because if you understand the nature of underperformance, you are more likely to hold onto asset classes that perform poorly in the short run. Let me illustrate this using some data.
Back in January of this year I wrote a post about asset allocation that computed the optimal portfolio using data on 9 different asset classes over the period of 1976–2016. I found that the portfolio with the highest risk-adjusted return over this time period contained:
- 34% U.S. Treasury 10 year Bonds
- 29% S&P 500
- 24% REIT (real estate investment trust)
- 10% Gold
- 3% International Stocks (developed markets)
You might think that after “data mining” this portfolio you would have incredible performance and few losses, but you would be wrong.
While this portfolio has real returns of 7% a year with a 9% standard deviation, it still loses money in 25% of all years. For comparison, the S&P 500 had a 9% real return with a 16% standard deviation over this period:
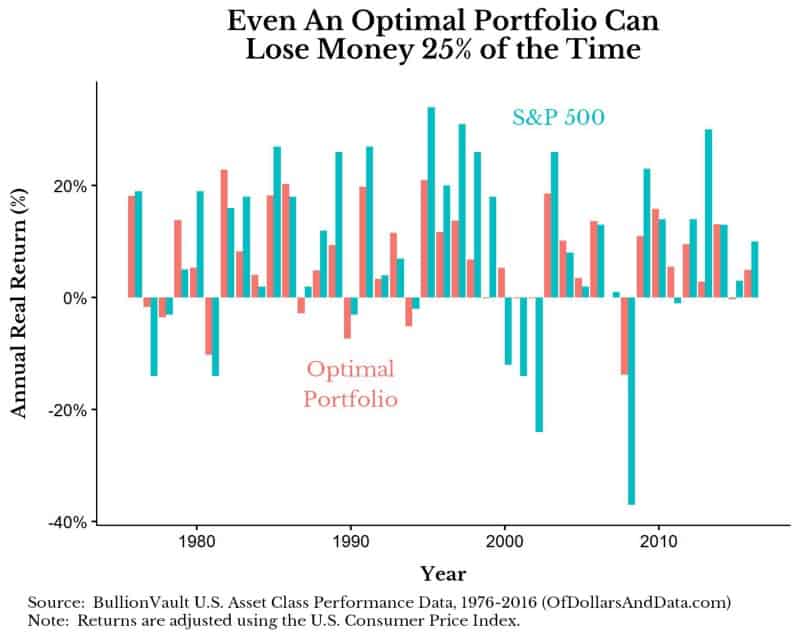
Though this portfolio underperforms the S&P 500 by 2% each year, it has far less risk as illustrated by its smaller annual losses and lower standard deviation.
What is even more intriguing is that while this portfolio only contains 5 asset classes, in any given year 2 of them are likely to lose money.
Think about what this means. Even when we cheat and mathematically compute the optimal portfolio using historical data, we will still have assets that underperform regularly.
In fact, this optimal portfolio has at least 1 asset class that loses money in 75% of all years and 2 or more asset classes that lose money in half of all years.
Why does this matter to you? Because if we see this level of individual underperformance when we know the future, imagine what might happen to your portfolio given we don’t know the future.
Knowing that some of your assets will underperform can help you to stay the course. If you still are skeptical, I am going to take this idea one level deeper by having us play a coin flipping game.
Demonstrating Underperformance via Coin Flips
Imagine I have a rigged coin that comes up heads 60% of the time and tails 40% of the time. I will say that this coin has a 10% “edge” for heads, where “edge” is defined any percentage above 50%.
Let’s also imagine that you are going to place bets based on the outcome of the coin flip, and I will pay you even odds on the outcome (i.e. if you bet $1 and win you get $2 back, if you bet $1 and lose you get $0 back).
Given you will always bet heads (trust me on this), what is the optimal bet size to maximize your return over many rounds of this game?
Rather than getting into the complexity of the math, which you can read about here, the optimal bet in this game will be 2 * your edge.
So with an edge of 10% for heads, you should always bet 20% of your bankroll on heads. For example, if you start with $100, you would bet $20 on your first flip. If the first flip comes up heads, you win $20 and now have $120. You would then bet $24 (20% * $120) on heads in the next round, etc.
At the extremes this strategy makes sense. For example, with a 0% edge (i.e. a fair coin with a 50% chance of heads) you should not play since 2 * your edge = 0. With a 50% edge (i.e. the coin always lands heads), you should always bet 100% of your bankroll on heads for every flip since 2 * your edge = 100%.
Despite following the optimal betting strategy I outlined above, we can still underperform over shorter periods of time due to chance alone. For example, let’s imagine doing 100 coin flips of the 60% heads coin and betting different amounts (10% to 50%) on heads for each flip.
As you can see, in this particular simulation, betting 10% of your bankroll in each flip outperforms betting 20% for the first 100 flips:
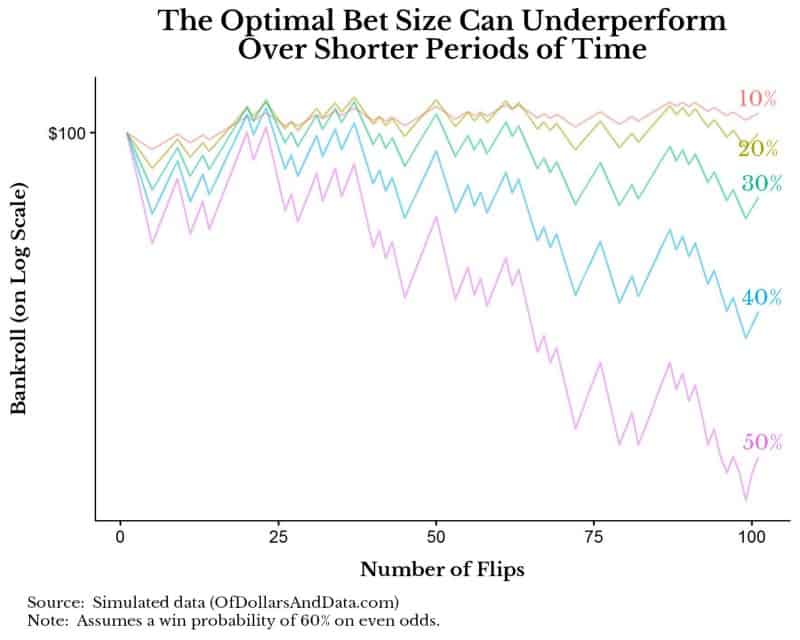
But, we know mathematically that 10% is not the optimal bet size, 20% is the optimal bet size. By chance, we had a lot of tails early on in this simulation and lost out. However, if we extend the number of flips, the optimal strategy emerges:
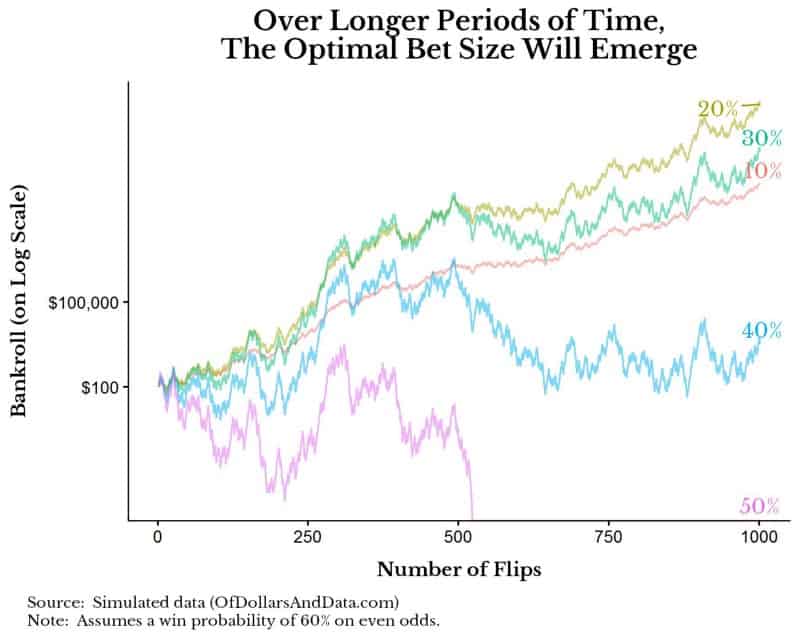
As you can see, over longer periods, the betting 20% of your bankroll strategy is ideal. For those of you that are wondering why the 50% strategy goes to 0, this is because we assume that your bankroll rounds to $0 if you only have $0.01 left and lose.
Betting 50% of your bankroll is too aggressive for this particular coin as too many tails in a short period will bankrupt you. However, betting too little (<20%) is also sub-optimal as you don’t take full advantage of your edge.
Underperformance Should Be Expected
I hope that the coin flip example was useful in demonstrating that even when we know we are behaving optimally, we may not always get the best results. This is especially true with investing where a diversified portfolio of broad asset classes with low fees can have periods of underperformance.
Some of your individual asset classes are likely to lose money in every year, but you should expect this. If everything you own is moving up all of the time, maybe your assets are too correlated and the next crash will be particularly ugly.
I wanted to reiterate this point because I know the psychological feeling of seeing an asset underperform. Back in 2013, before I knew much about investing, I sold all of my bonds and was 100% stock because bonds had lost money while the S&P 500 was up 32% that year.
I knew the value of having bonds for diversification, but I still made this decision because I hated the feeling of underperforming. I got lucky that stocks didn’t crash before I added bonds back into my portfolio, but I have since learned to accept underperformance as a necessary part of a well-built portfolio.
I hope you can realize that bouts of poor performance will happen to you, and everyone else, as well.
Lastly, if you enjoyed the coin flipping/betting ideas and want to read about a pioneer in investing and betting, I highly recommend Ed Thorpe’s A Man for All Markets. Thank you for reading!
If you liked this post, consider signing up for my newsletter.
This is post 41. Any code I have related to this post can be found here with the same numbering: https://github.com/nmaggiulli/of-dollars-and-data

