Have you seen the movie 21? Ever heard of the MIT blackjack team? Does the term “card counting” mean anything to you?
If so, then you already know the story of how a clever group of students were able to beat the casinos at their own game and make a fortune. They did it by playing blackjack and following a relatively simple strategy—keep a running count of how many high and low cards had been dealt, and then bet a larger amount anytime there were more high cards than low cards remaining.
This concept, known as card counting, was first popularized by the mathematician Edward Thorpe in his seminal book Beat the Dealer. Thorpe’s big revelation was that the probability of winning a particular hand changed over time based on which cards had been dealt previously. As Thorpe calculated, the standard casino edge when a player was playing perfectly was 0.21%, meaning that the casino should win 0.21% of all money wagered over time.
However, when certain cards were removed from the deck, the casino’s probability of winning changed. For example, as high cards (ace/king/queen/jack/ten) were removed, the casino’s chance of winning a particular hand increased. But, Thorpe discovered that the opposite was also true. As he stated in A Man for All Markets (emphasis mine):
But taking out the “small” cards, which are 2, 3, 4, 5, and 6, helped the player enormously. Removing four 5s was the best, changing the casino edge of 0.21 percent to a huge player edge of 3.29 percent.
This meant that, in an ideal scenario, the player would go from losing 0.21% of what they wagered to winning 3.29% of what they wagered in the long run. Though this change in edge was small, it had enormous implications. These implications resulted in a new way to make money, the MIT Blackjack team, and a film that grossed $160 million at the box office.
I think about Thorpe and his calculations from time to time not because I like blackjack, but because of how this framework can help us with our investments. For example, a reader recently asked:
I’m in retirement and using the 4% rule to fund my lifestyle. My question is: Is it better to sell 4% of my portfolio at the beginning of the year (in January) or sell throughout the year as I need the money? Which strategy leads to more wealth in the long run? Assume you are invested 100% in US equity index funds.
This question is great because it allows us to compare two different strategies (Beginning of Year Withdrawals vs. Quarterly Withdrawals) to see if either of them has an edge. To get started, let’s imagine how each of these strategies work:
- Beginning of Year Withdrawals: Withdraw 4% of the portfolio each January and have the rest of the nest egg in 100% stocks throughout the rest of the year. Repeat the process each year thereafter.
- Quarterly Withdrawals: Calculate your total withdrawal amount (4% of January’s portfolio value), but withdraw it in four quarterly installments (i.e. January, April, July, October). Repeat the process each year thereafter.
By testing the strategies in this way, we ensure that the same amount of money is withdrawn from each, only the timing of the withdrawals is what varies. One strategy sells right away, while the other sells over time. Which will win? Let’s find out.
If you compare these strategies over various time periods, you will see that Quarterly Withdrawals beat Beginning of Year Withdrawals anywhere from 62% to 100% of the time:
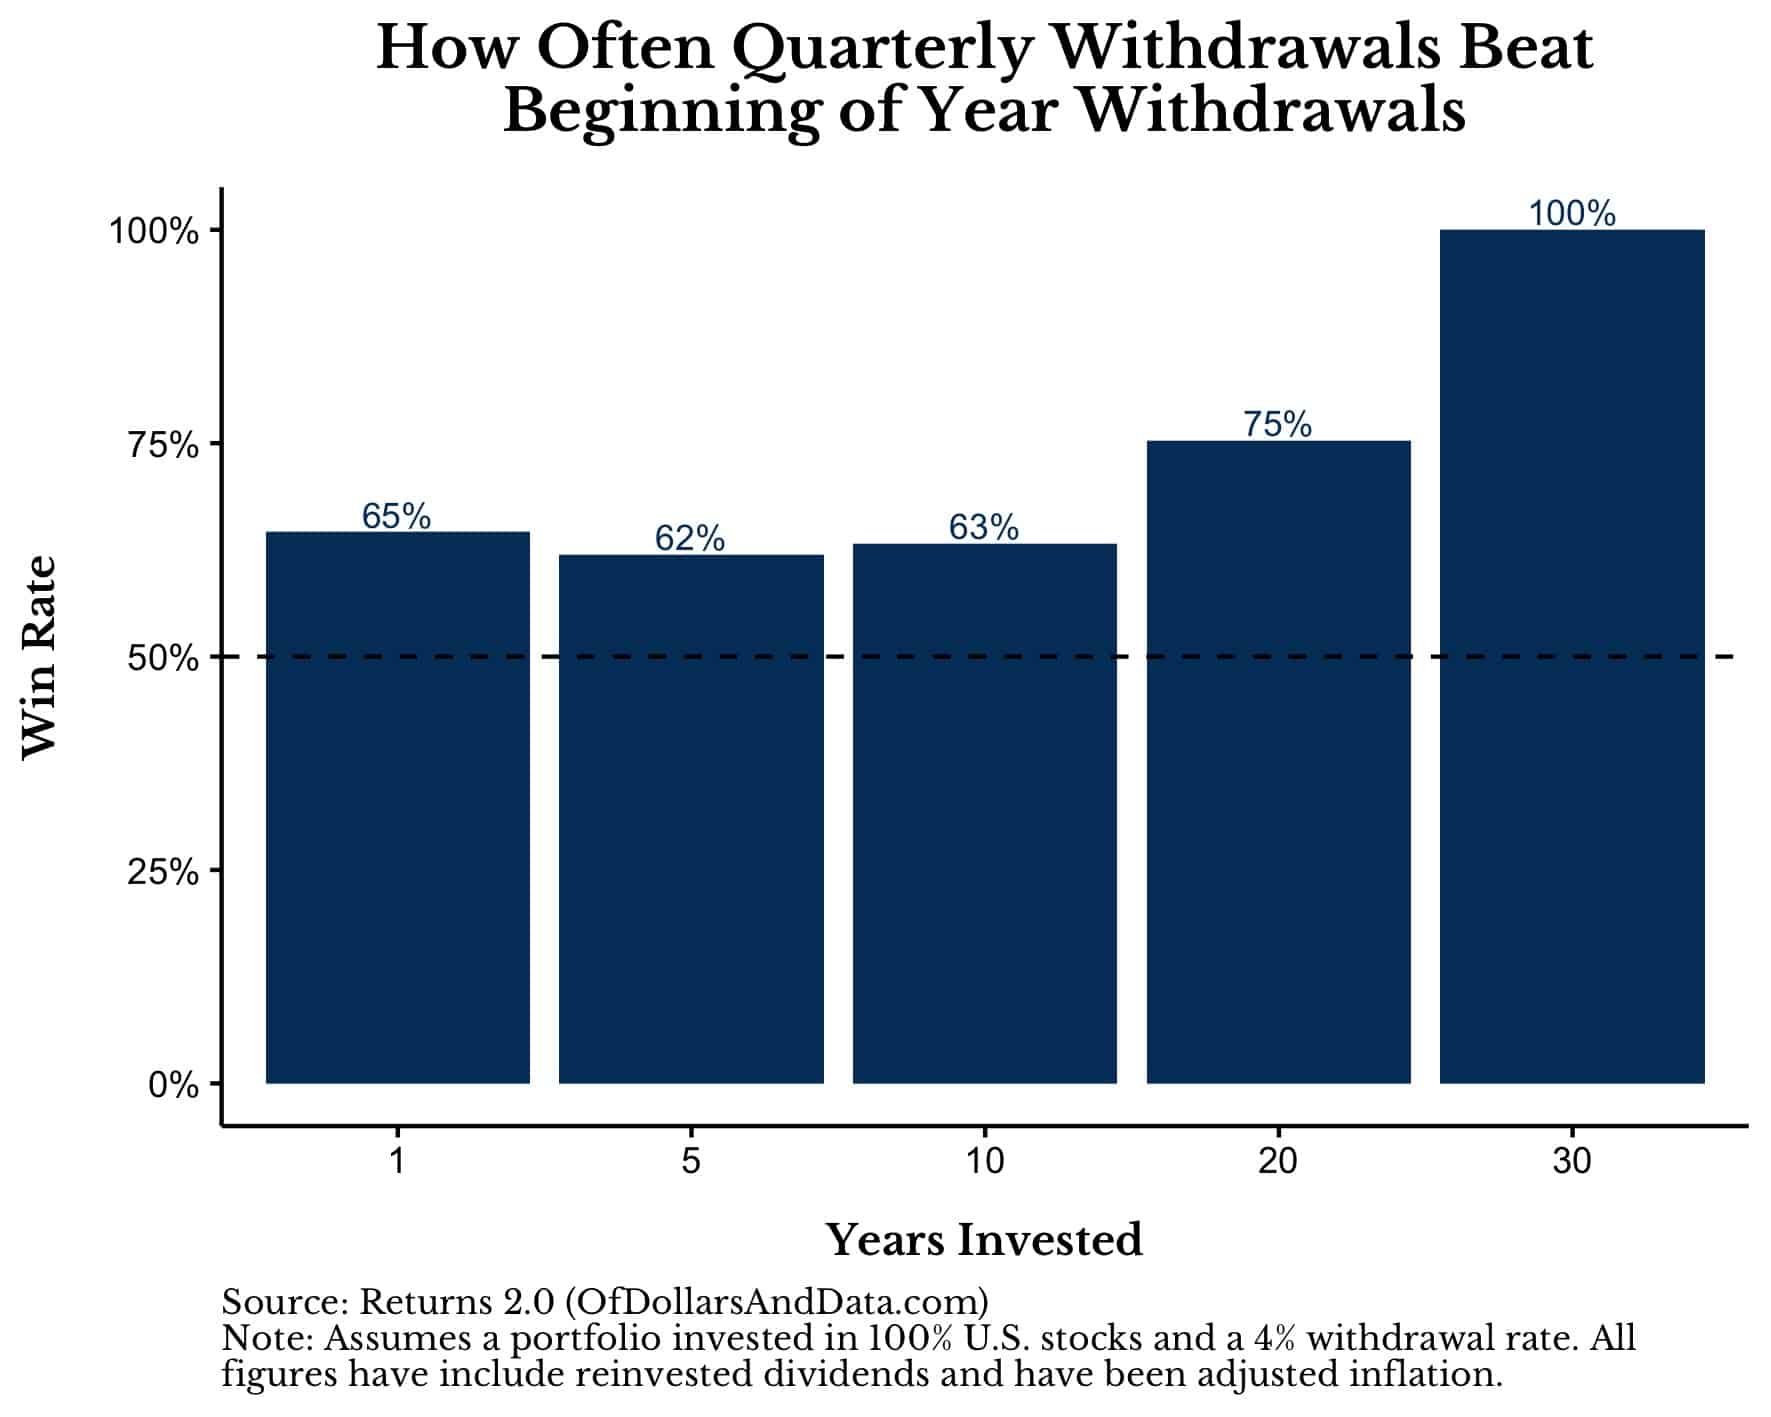
For example, if we tested these strategies across all single calendar years from 1926 to 2021, the Quarterly Withdrawal strategy would have more money at year end than the Beginning of Year Withdrawal strategy 65% of time. If we followed both strategies over five years, the Quarterly Withdrawal strategy wins in 62% of 5-year periods, and so forth. By the time we get to 30-year periods, the Quarterly Withdrawal strategy wins 100% of the time.
However, we don’t just care about the win rate, but also how much we win or lose by over time. So how much do you outperform by if you follow the Quarterly Withdrawal strategy? Unfortunately, not much. The Quarterly Withdrawal strategy tends to outperform the Beginning of Year Withdrawal strategy by only 0.1%-0.2% on an annualized basis, regardless of the number of years invested.
Despite this meager performance improvement, over time this strategy can produce a significant edge. For example, over a 1-year period, the Quarterly Withdrawal strategy only has an edge of about 0.05% over the Beginning of Year Withdrawal strategy. But, after 10 years this edge climbs to 0.72% and by 20 years it reaches 1.54%! Recall that Ed Thorpe made card counting famous because of a 1%-2% edge against the casino.
This edge might not seem like a lot, but it is. As a reminder, if you play a fair game (50% chance of winning) with even odds (i.e. you bet $1 to make $1), your edge would be 0%. No one would have an advantage over anyone else. However, get an edge of 1%-2% and your winnings will pile up over time, whether in blackjack or investing.
You might be wondering why the Quarterly Withdrawal strategy typically beats the Beginning of Year Withdrawal strategy, but the answer is simple—markets go up most of the time. Because of this, your best course of action (in theory and in practice) is to sell slowly. By selling your income-producing asset over time you end up experiencing more market growth (on average) than someone who sells right away. This is the logic of my lump sum post in reverse.
And this logic doesn’t just apply to diversified ETFs/index funds, but to individual stocks as well. Unless you have a good reason to exit an individual stock position quickly (i.e. concentration risk, etc.), selling over time is usually the way to go. As I stated in Ch. 18 of Just Keep Buying:
If you look at the universe of individual stocks in the U.S. going back to 1963, the median one-year return is 6.6%, including dividends. This means that if you grabbed an individual stock at random at any point in time since 1963, you would’ve earned roughly 6.6% over the next year.
Of course, this is only on average. Anyone who sold slowly in 2022 is feeling the pain of not selling sooner.
However, this doesn’t mean that it was a bad decision to sell slowly. It just means that you got unlucky. Anyone who says otherwise is merely judging the decision by the outcome and not the process we took to get there (see resulting).
Because, if they had judged the decision by the process and actually examined the data, they would have realized that selling slowly was the optimal course of action in the U.S. stock market for 17 out of the last 20 years. And, frankly, I like those odds. I hope you do too.
Happy investing and thank you for reading!
If you liked this post, consider signing up for my newsletter.
This is post 303. Any code I have related to this post can be found here with the same numbering: https://github.com/nmaggiulli/of-dollars-and-data

