With the year coming to a close and many assets near all-time highs, you might be wondering whether now is a good time to buy. After all, nobody wants to deploy their capital right before a crash and then wait years before seeing a return on their investment. We all want the best price possible, and buying near an all-time high doesn’t feel like we are getting the best price.
This intuition is correct. As I have shown previously, there is only a 5% chance that you are going to buy an asset (like a U.S. stock index fund) at its best possible price. This means that there is a 95% chance you will buy too high relative to some lower future price. Does this imply that you shouldn’t buy near all-time highs? Not at all.
In fact, the data suggests that for many risky assets (stocks, Bitcoin, gold, etc.), all-time highs are a bullish indicator, at least in the near term. Why? Because all-time highs tend to follow other all-time highs. Of course, this process won’t last forever, but it can go on longer than you think. This is why there is nothing wrong with striking while the iron is hot and this post is going to demonstrate why.
Why All-Time Highs Are Usually Bullish
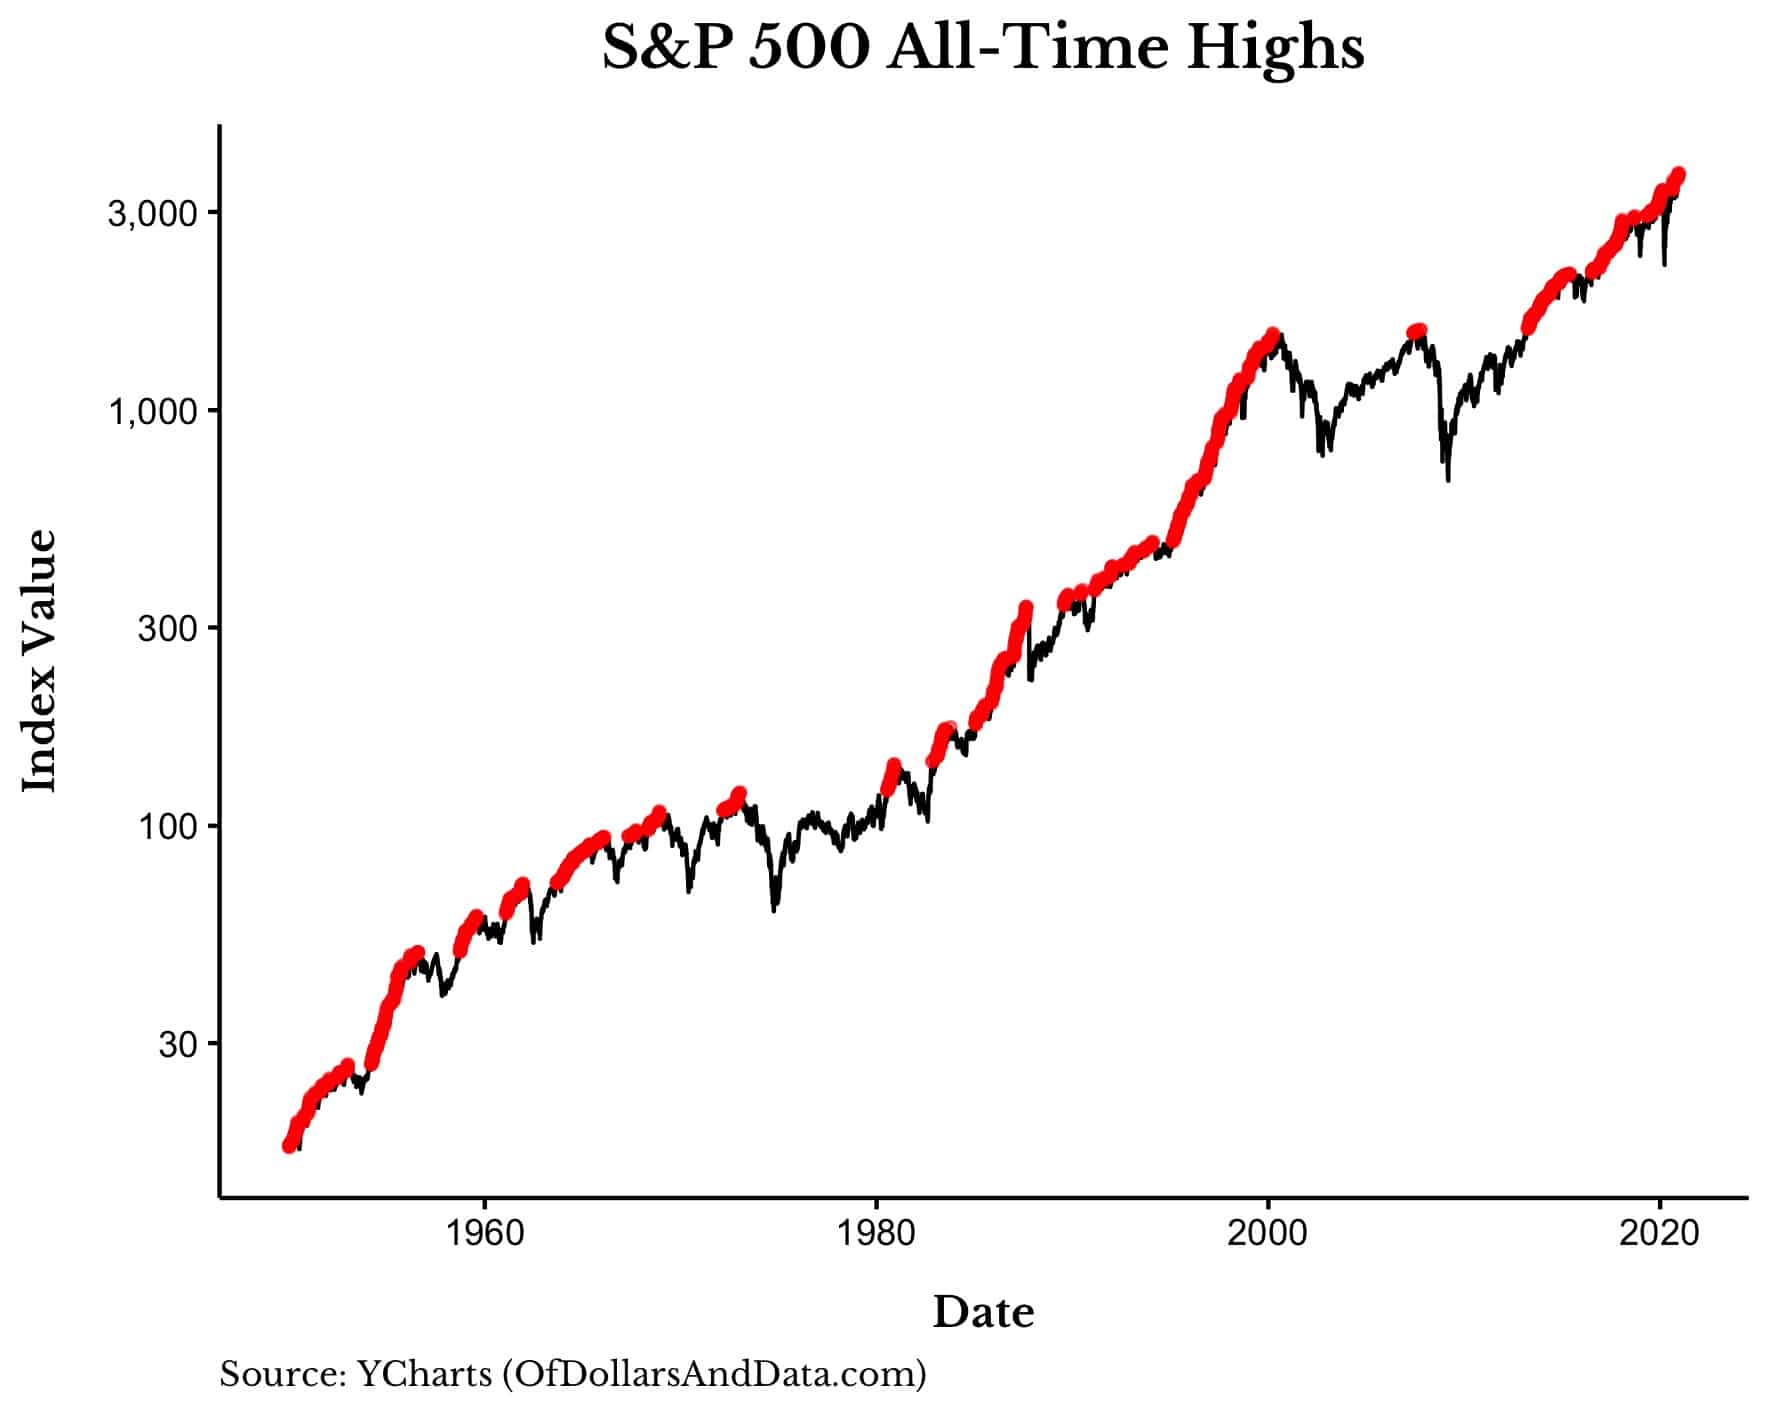
When you think of all-time highs it’s easy to think of them in terms of fear. All-time highs represent uncharted territory and the unknown, right? But what you should really think about when you hear “all-time highs” is more buying. Period. This is how markets work. When more dollars are trying to get into an asset then are trying to get out, prices rise. And if this behavior continues, prices will continue to rise. This is why all-time highs tend to follow all-time highs. Higher prices attract more buyers which attracts higher prices, etc.
You can see this more clearly by looking at the all-time highs in the S&P 500 since 1950 (Note: the y-axis is a log scale):
 As you can see, there are long periods of time where markets can run upward. If we were to plot the number of trading days between these all-time highs for the S&P 500, it would look something like this:
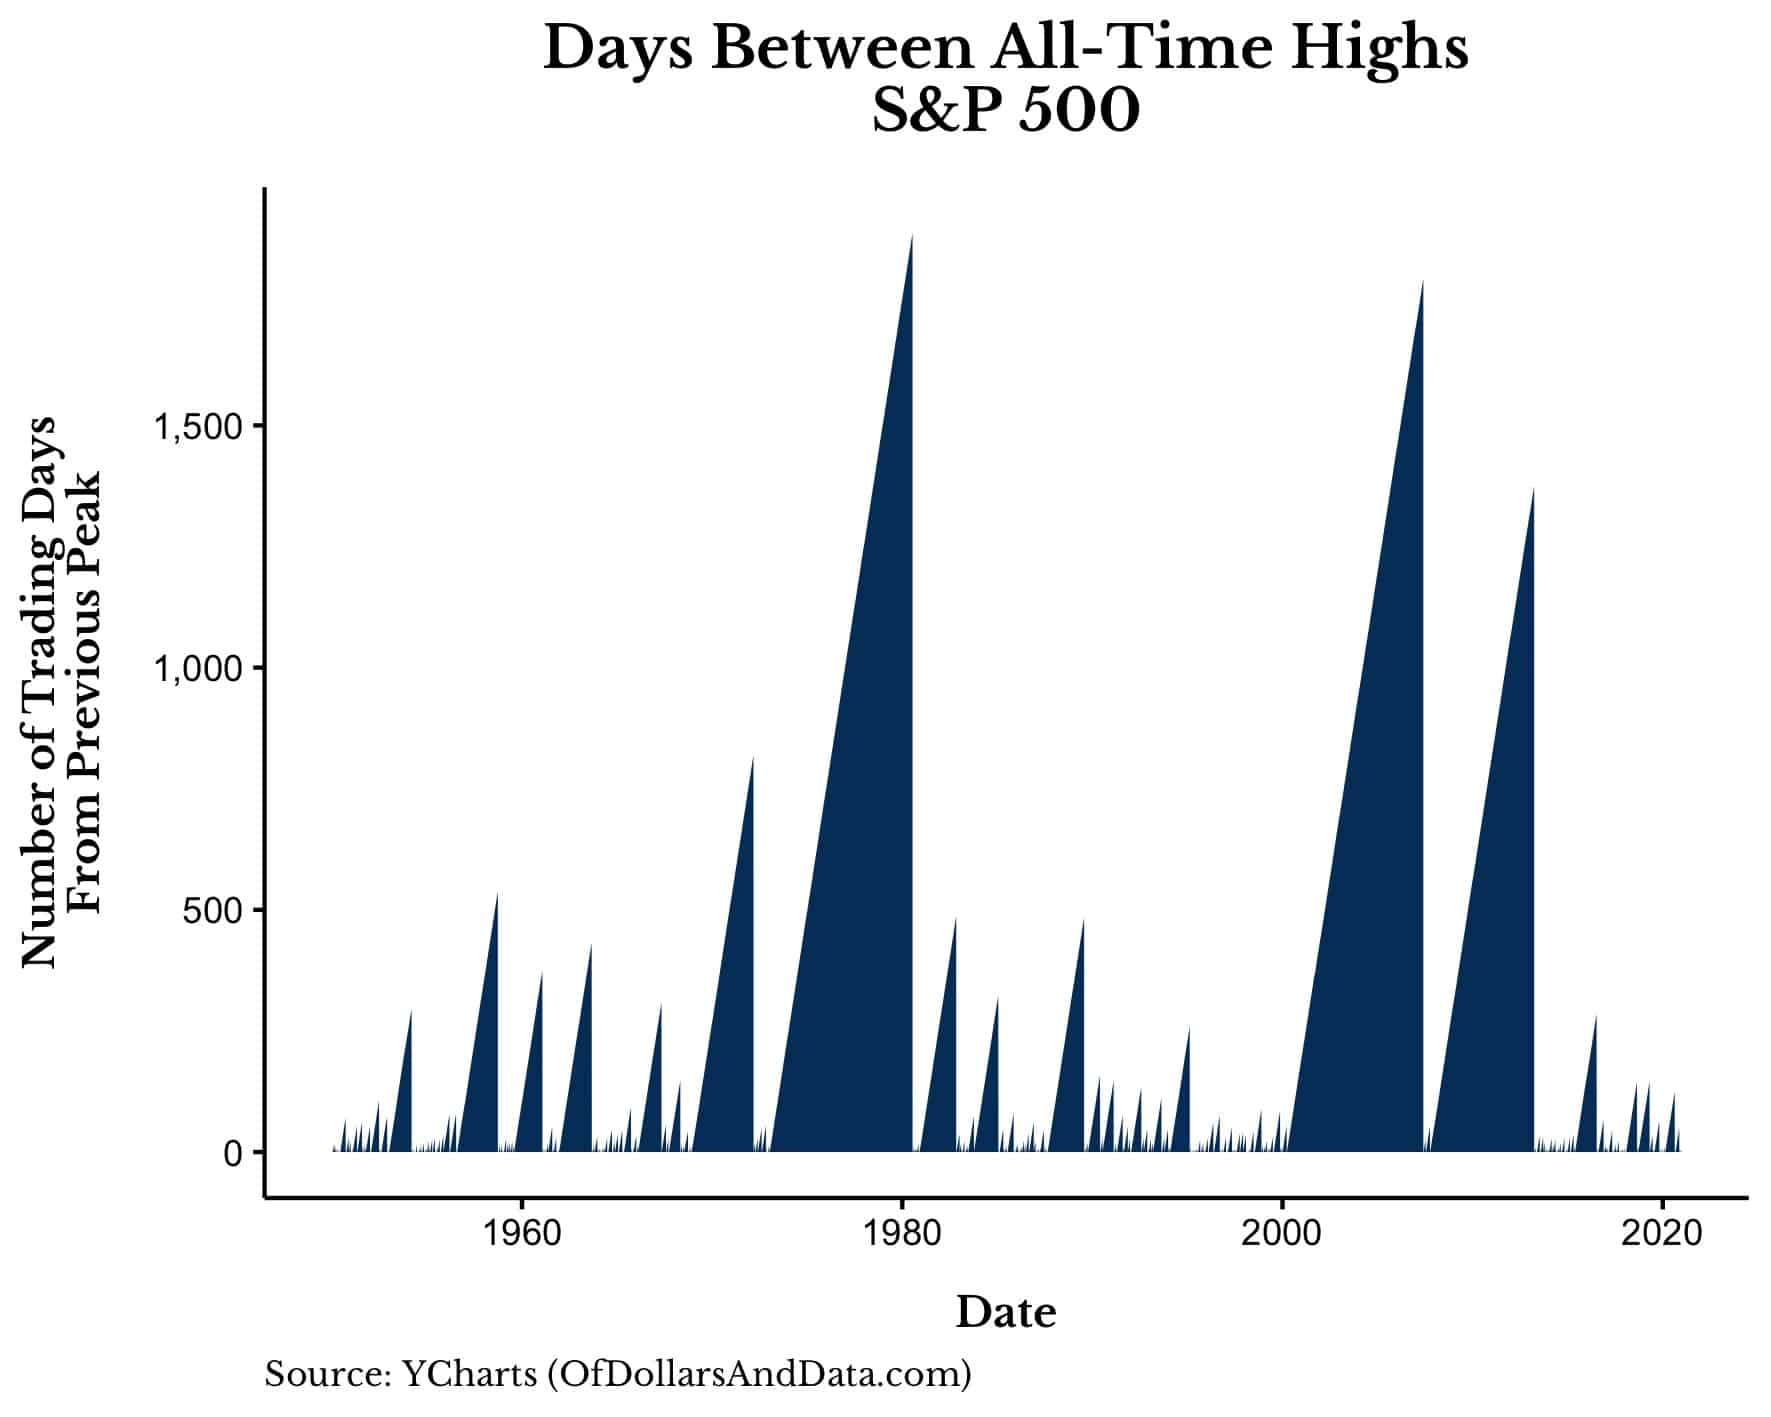
While it’s easy to look at this chart and focus on the few large spells between all-time highs, what you should really be focusing on is the many, many short spells. Most of the action in this chart is happening near the base of the y-axis. This is why the S&P 500 has been within 5% of an all-time high nearly half the time since 1950.
But what about performance? How does the S&P 500 perform following an all-time high. As the distribution plot below shows, when the S&P 500 is near an all-time high (“Near ATH”) returns over the next year are similar to those when the S&P 500 is more than 5% away from an all-time high (“Off ATH”):
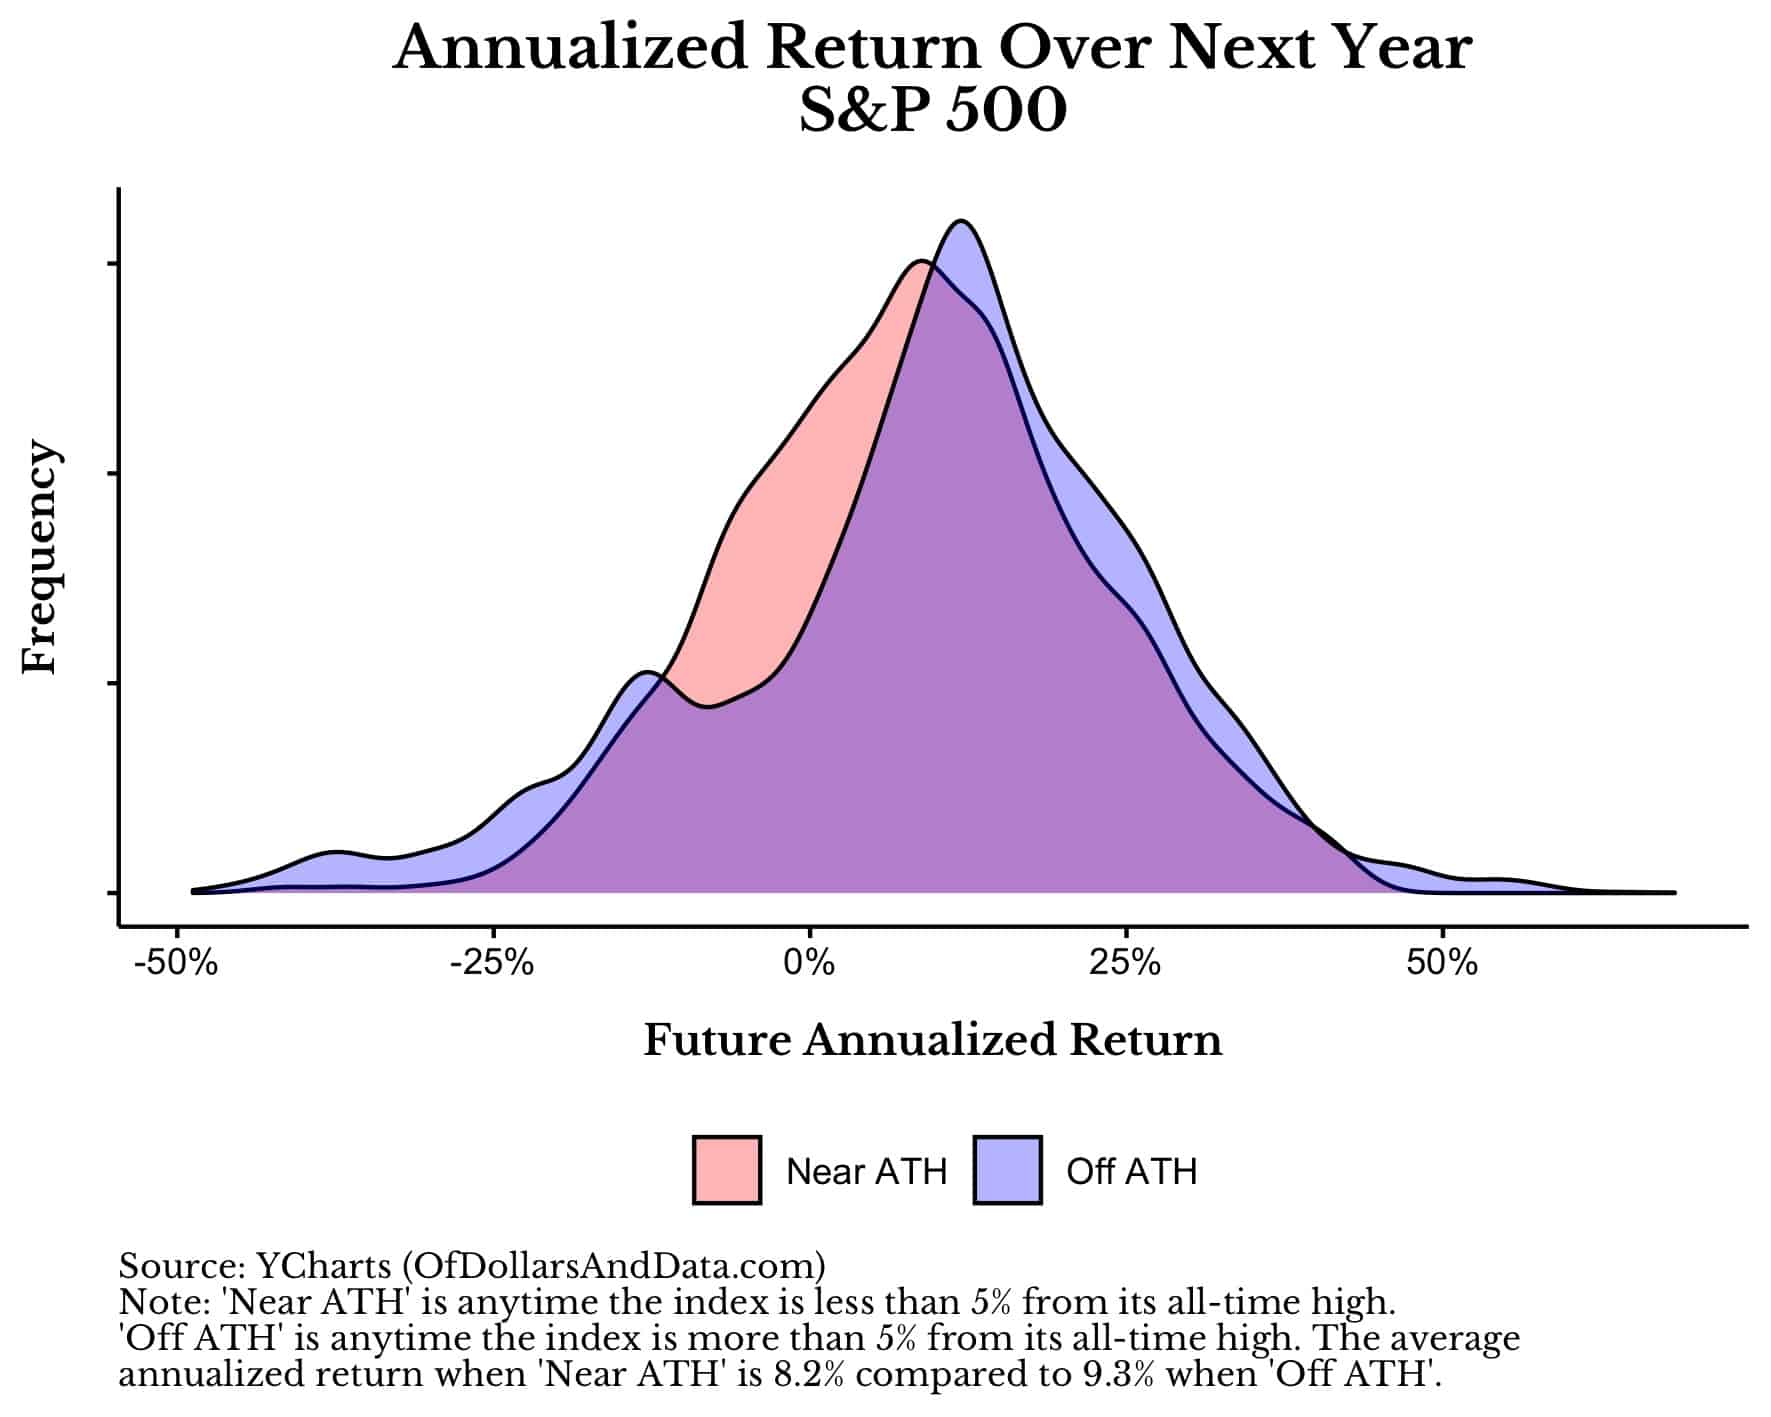
This plot suggests that the fear of a crash following all-time highs may be slightly overblown.
And if we look over longer time periods, investing in the S&P 500 near an all-time high becomes even more compelling. As the plot below shows, the average annualize return over the next three years when investing near an all-time high is slightly higher than the average annualized return when further away from an all-time high:
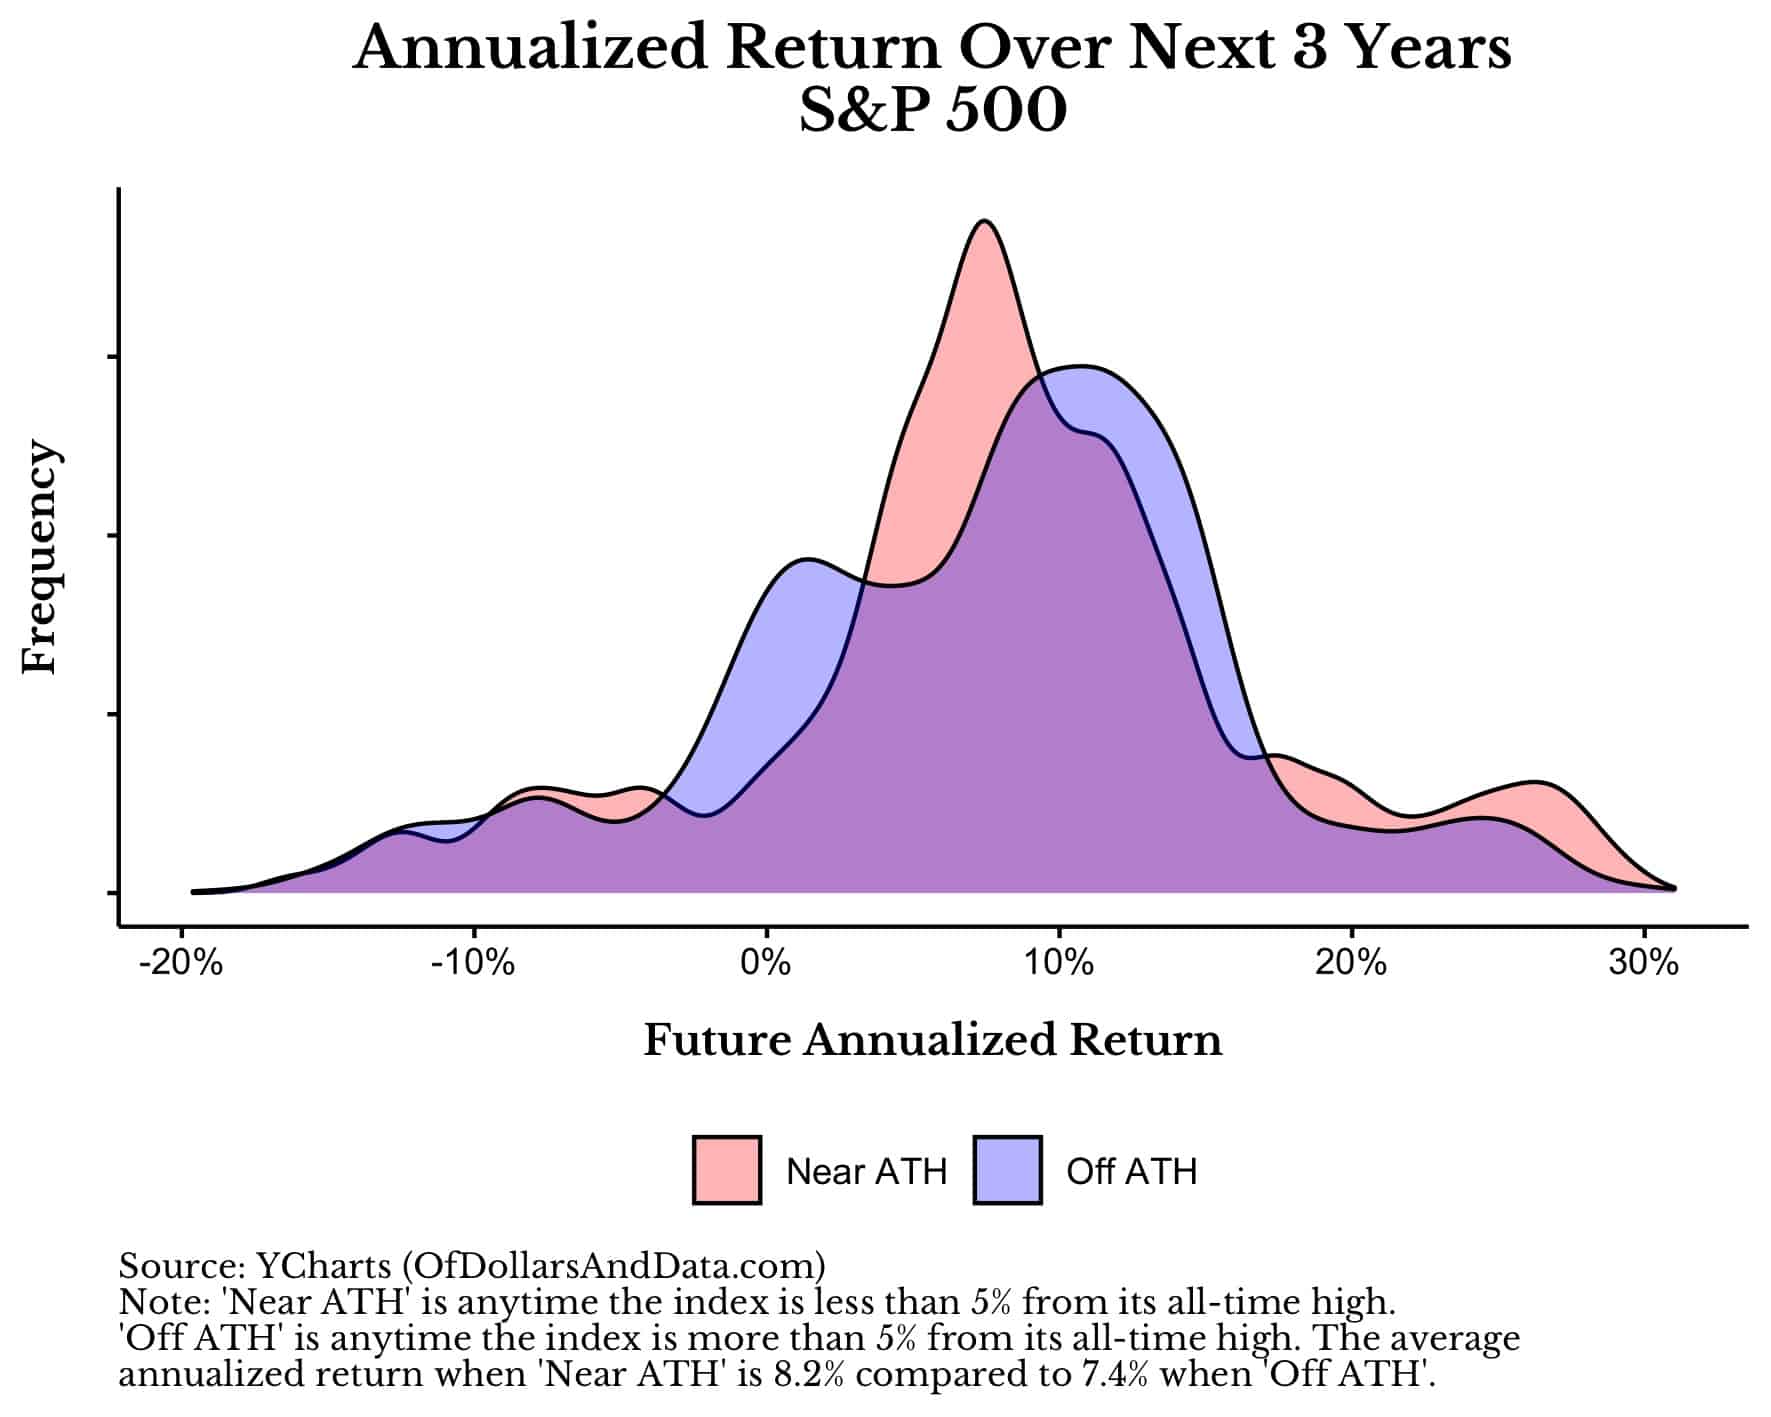
Of course we have no idea if this relationship will hold in the future, but the data should provide you some comfort when you invest near market peaks.
And if it doesn’t, then consider this post by Meb Faber. In it he compares “Buy and Hold” to a strategy that only invests in stocks at all-time highs and switches to bonds in all other months. Surprisingly, the strategy that only bought at all-time highs had better performance and lower volatility than “Buy and Hold”!
Of course, you may still be skeptical of these findings since U.S. stocks have been one of the best performing asset classes of the last century. Does investing near all-time highs produce positive results in international equity markets? You bet.
What About International Stocks?
Now that we have seen that investing near all-time highs isn’t problematic most of the time for U.S. stocks, we can now turn our attention to international stocks where the evidence for investing following all-time highs is even stronger. For this analysis I will look at the MSCI EAFE and MSCI Emerging Markets indices in particular.
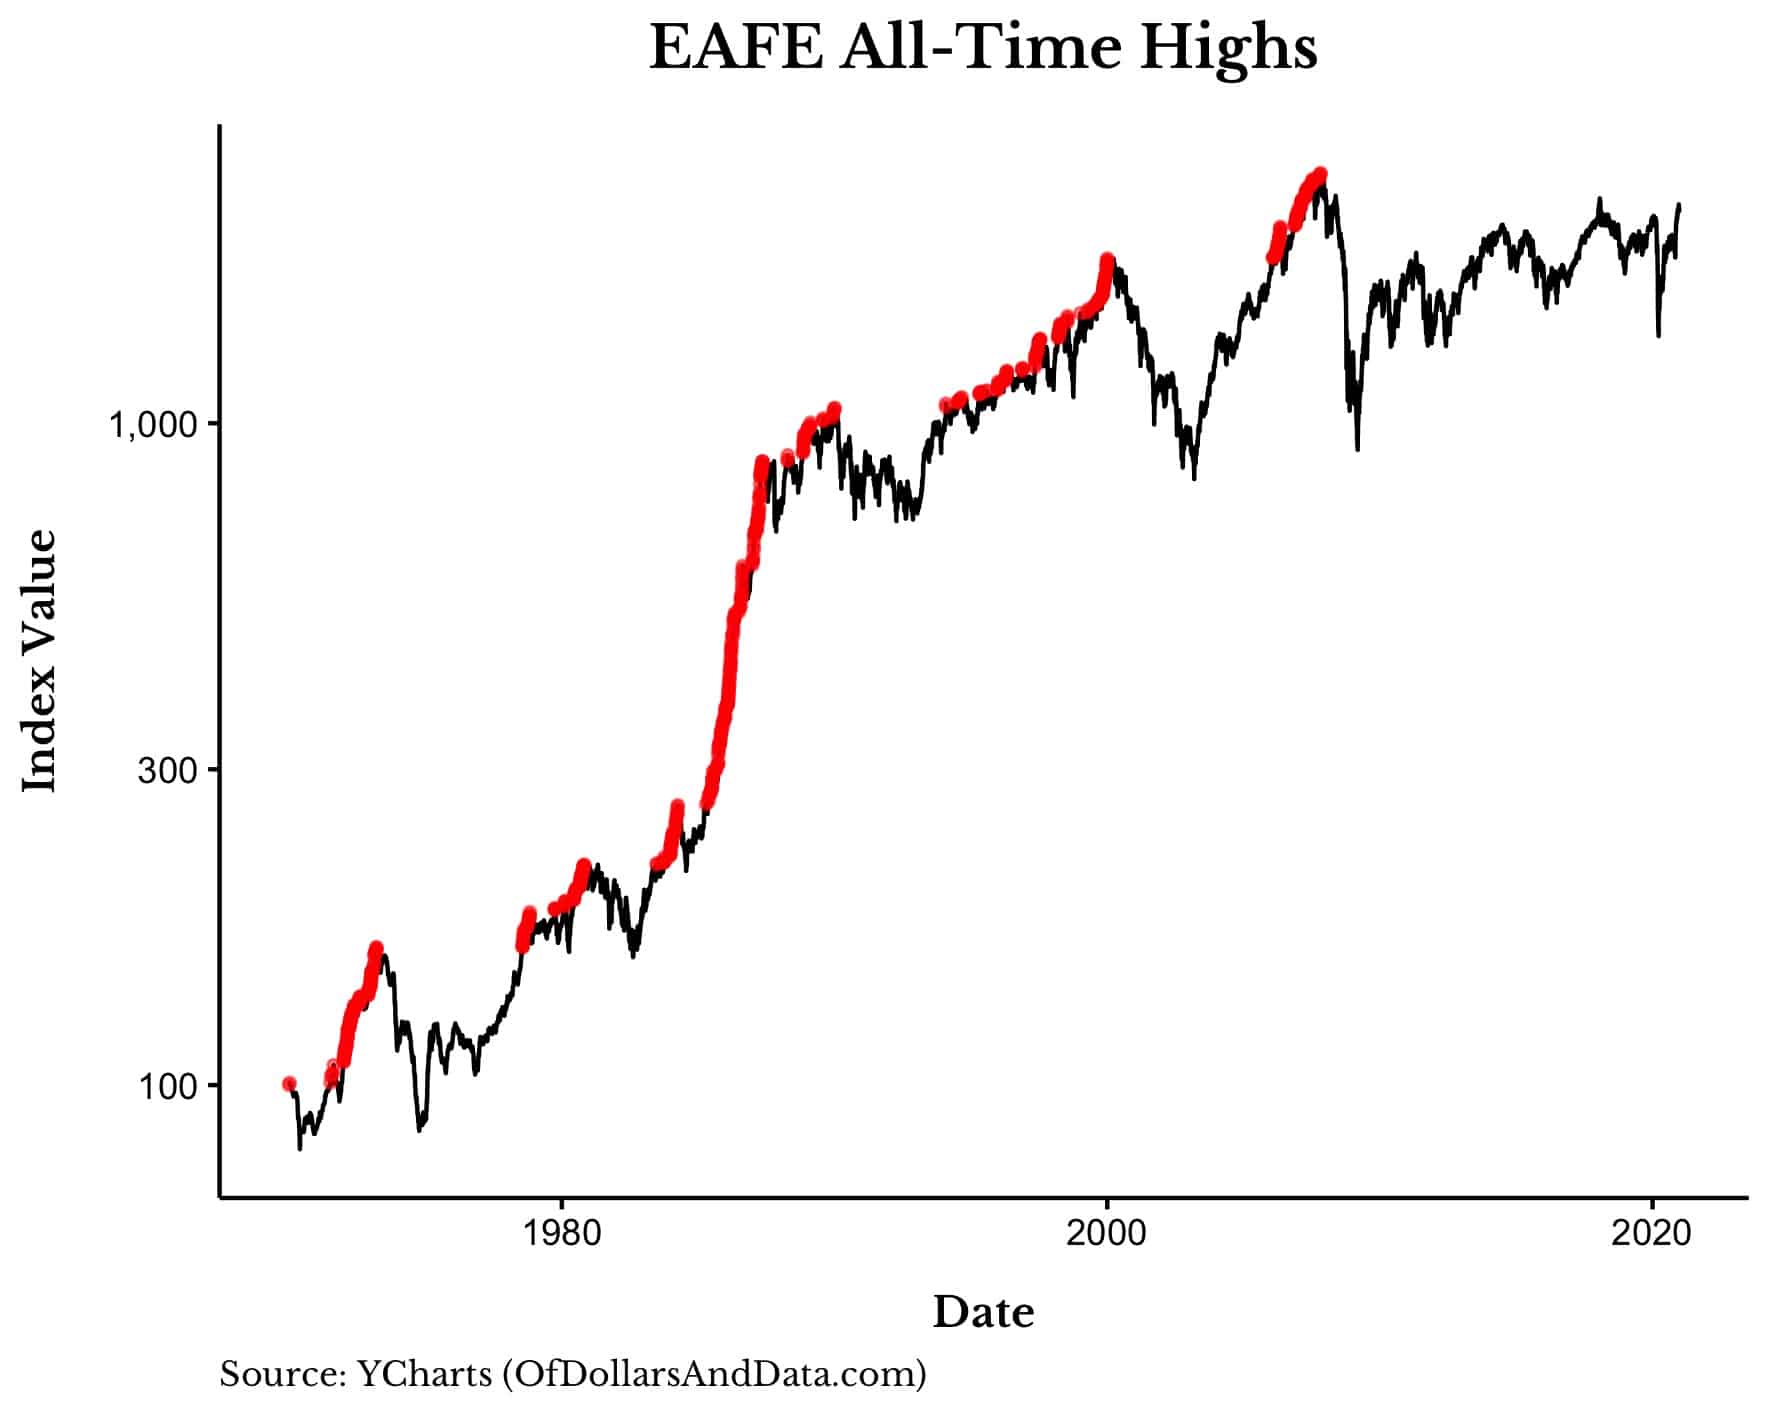
As a little refresher, both the EAFE and Emerging Market indices are still more than 5% below their all-time highs from November 2007. Starting in 1970 we can see how the EAFE index has performed over the last half century:
And here is how Emerging Markets index has performed since 1989:
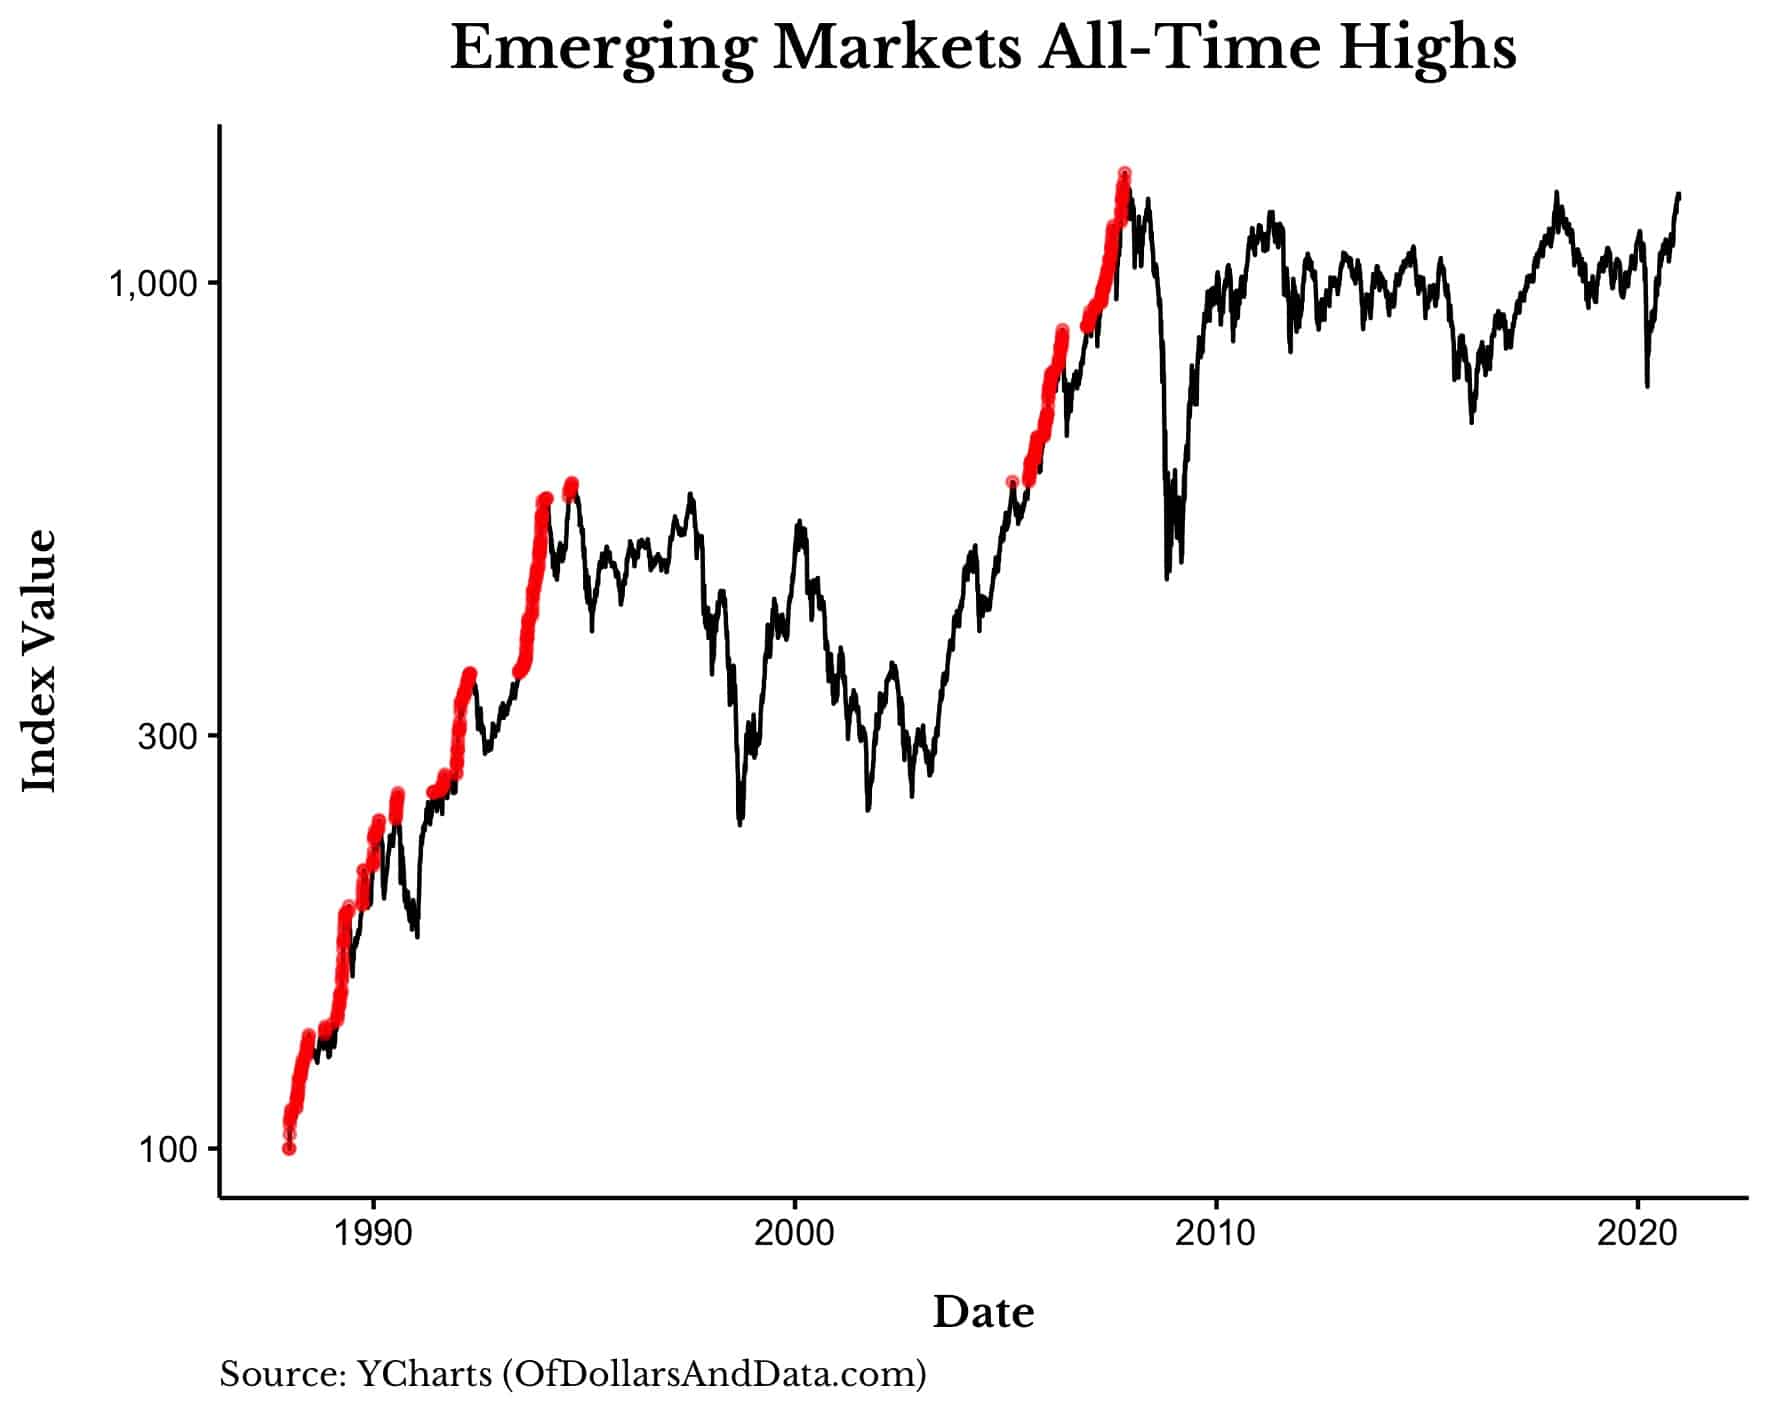
As you can see, despite their current drawdowns, both indices exhibit clustering of all-time highs.
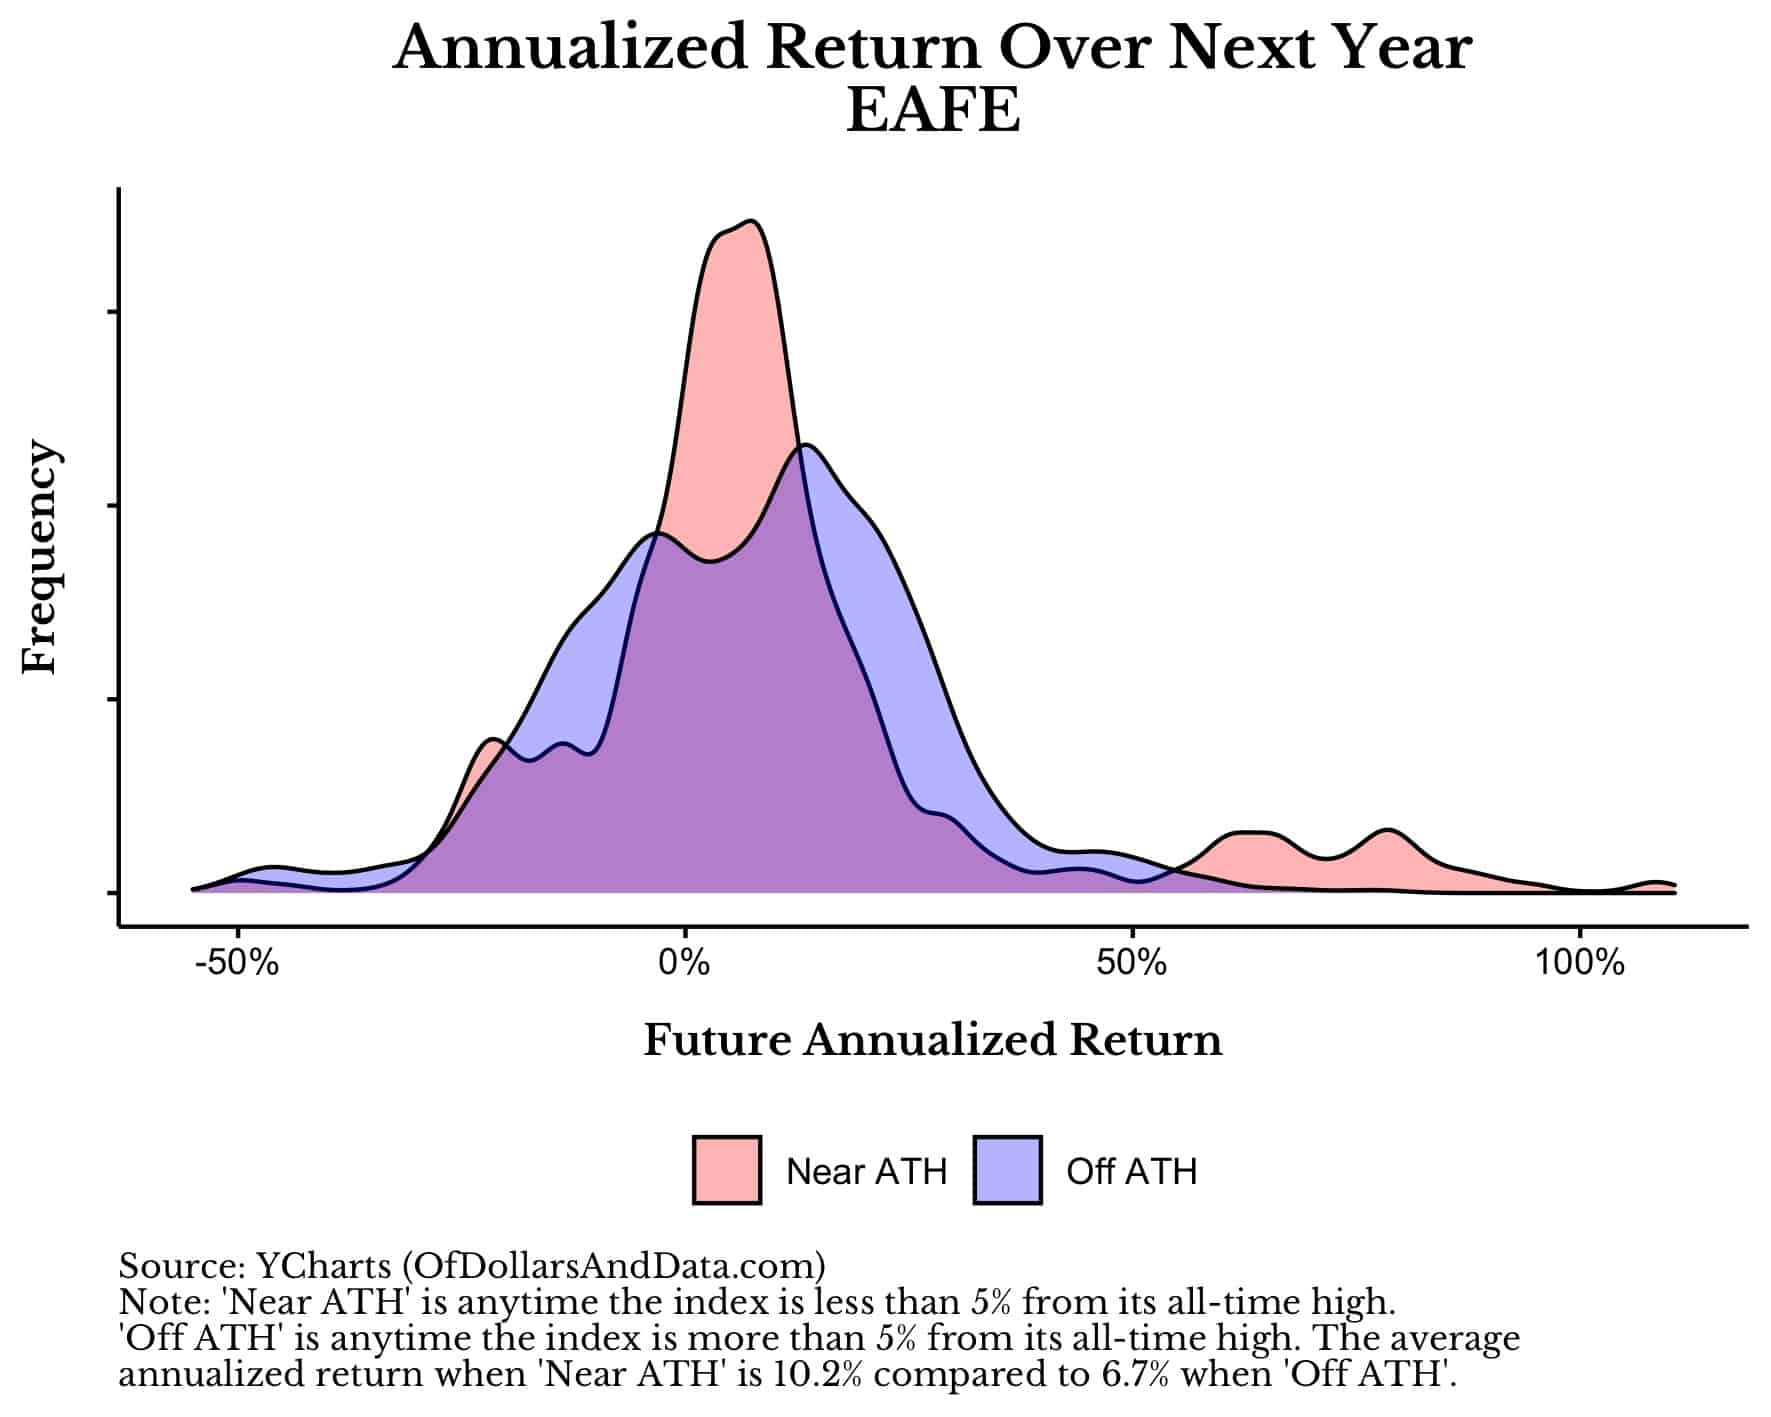
Because of this clustering, the data suggests that investing within 5% of an all-time high (“Near ATH”) has provided better returns than when investing further away from all-time highs (“Off ATH”).
For example, the average return for EAFE stocks over the next year is 10.2% on average when near an all-time high and only 6.4% when off an all-time high:
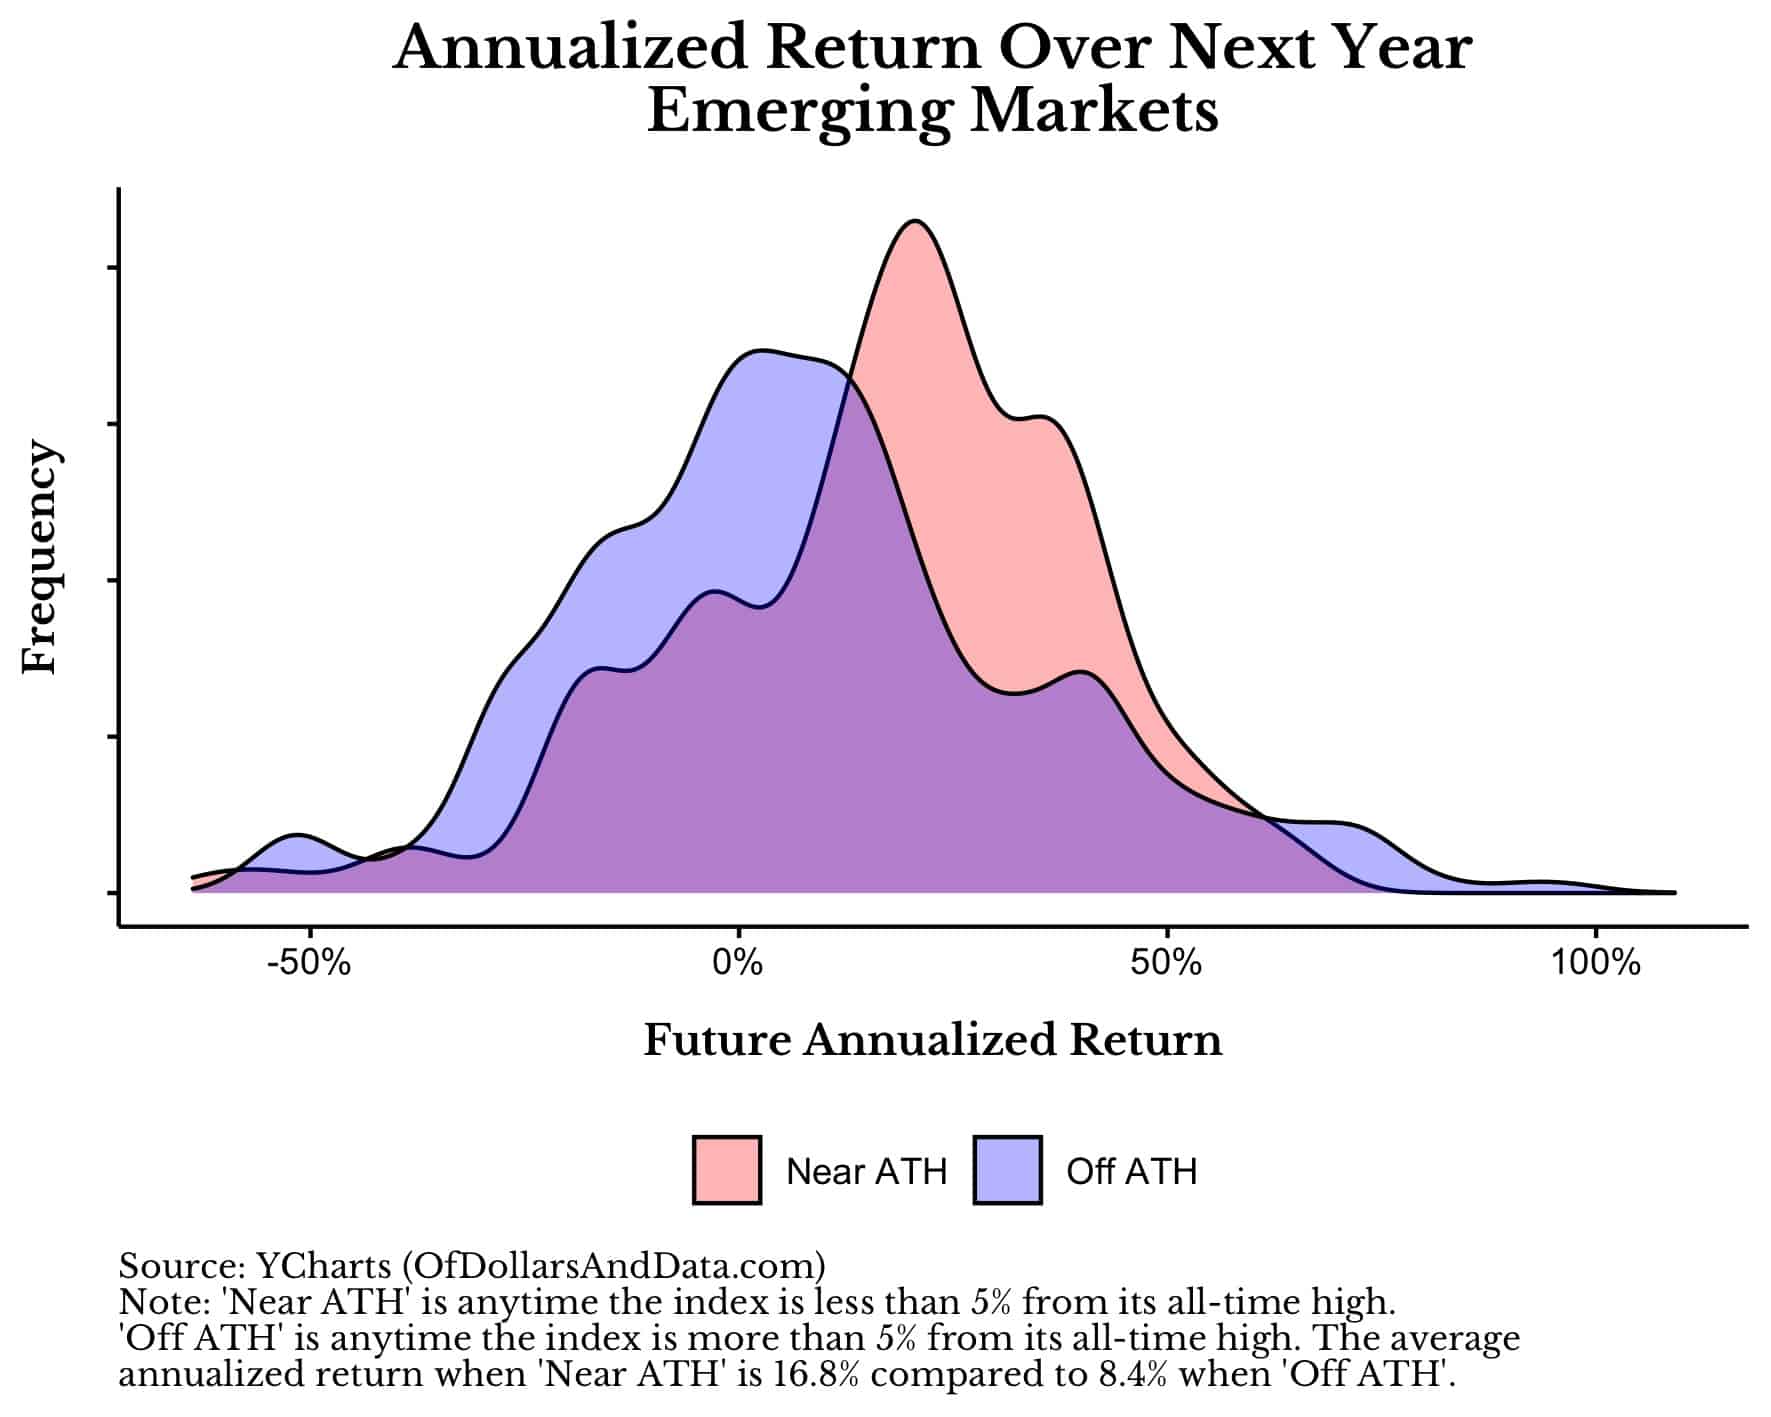
In emerging markets, the effect is even stronger since the average return following an all-time high is 16.8% compared to only 8.4% when off an all-time high:
More importantly, these effects don’t seem to persist over longer time periods. For example, when I look at investing over three years, the performance premium of investing near all-time highs in both EAFE and EM stocks fades away. While this suggests that there may be some short-run momentum plays to be had in international indices, I don’t have enough data to verify this as of yet.
Nevertheless, this data provides more evidence that investing near all-time highs is less risky than it first appears. But if you really want to see the power of investing near all-time highs, then we should turn our attention to some alternative asset classes.
What About Bitcoin & Gold?
With Bitcoin recently hitting all-time highs and Gold less than 15% off its August 2020 highs, you may be wondering whether there is any legitimacy to investing in these assets near their peaks. Fortunately, investing near all-time highs in these alternative asset classes seems to be a good bet most of the time.
For example, the plot below shows the distribution of returns over the next year when investing near all-time highs and when investing off of all-time highs for Bitcoin:
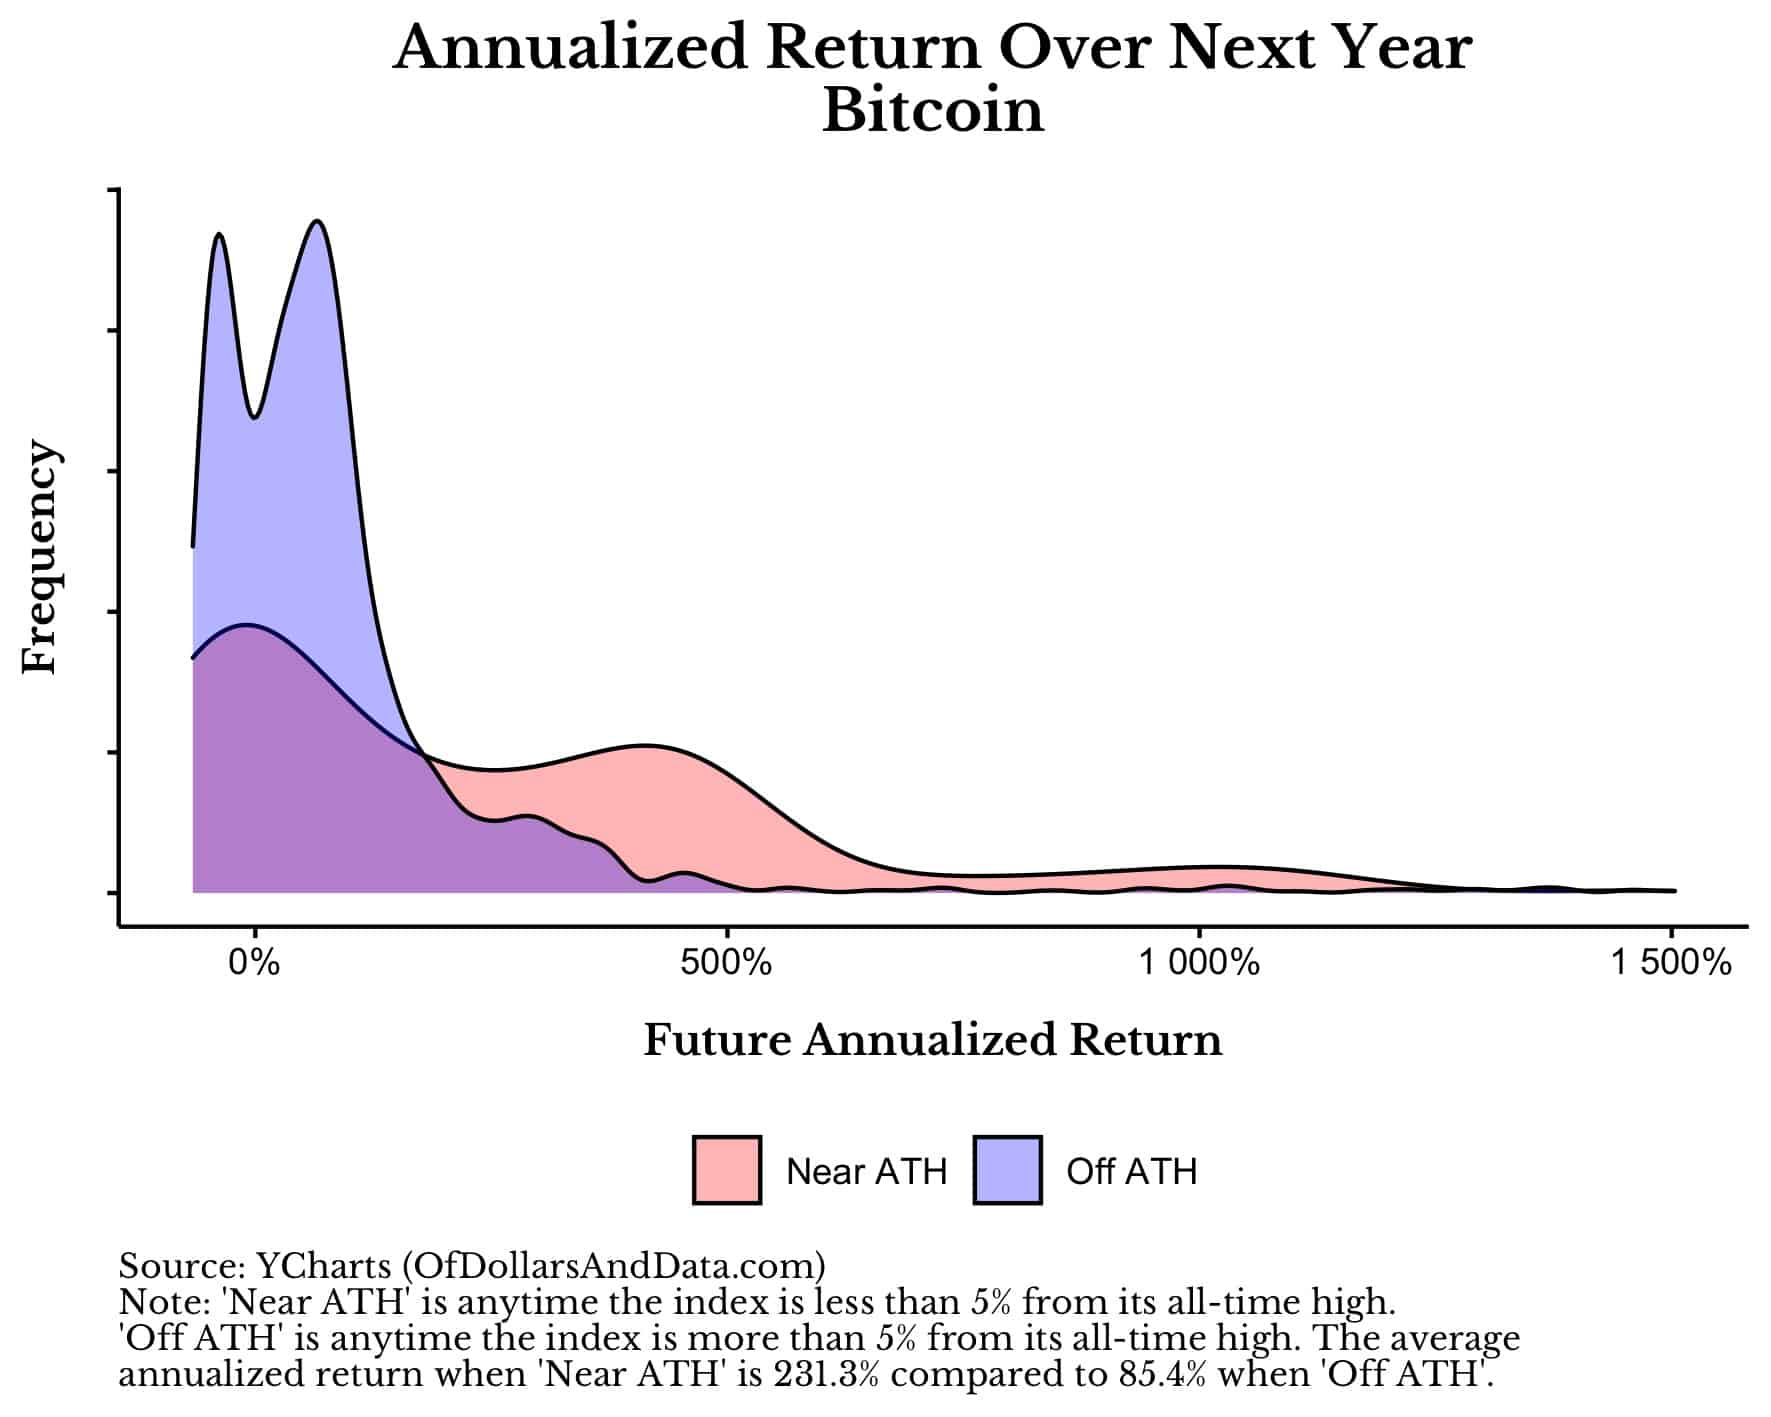
As you can see, the returns are clearly better when Bitcoin is nearer an all-time high than when it is further away from an all-time high. Of course, Bitcoin has arguably been the best performing asset class of the last decade, so it’s no wonder that this is true.
However, Bitcoin has also been an asset class that has had its share of dry spells between all-time highs, with the most recent one lasting nearly three years:
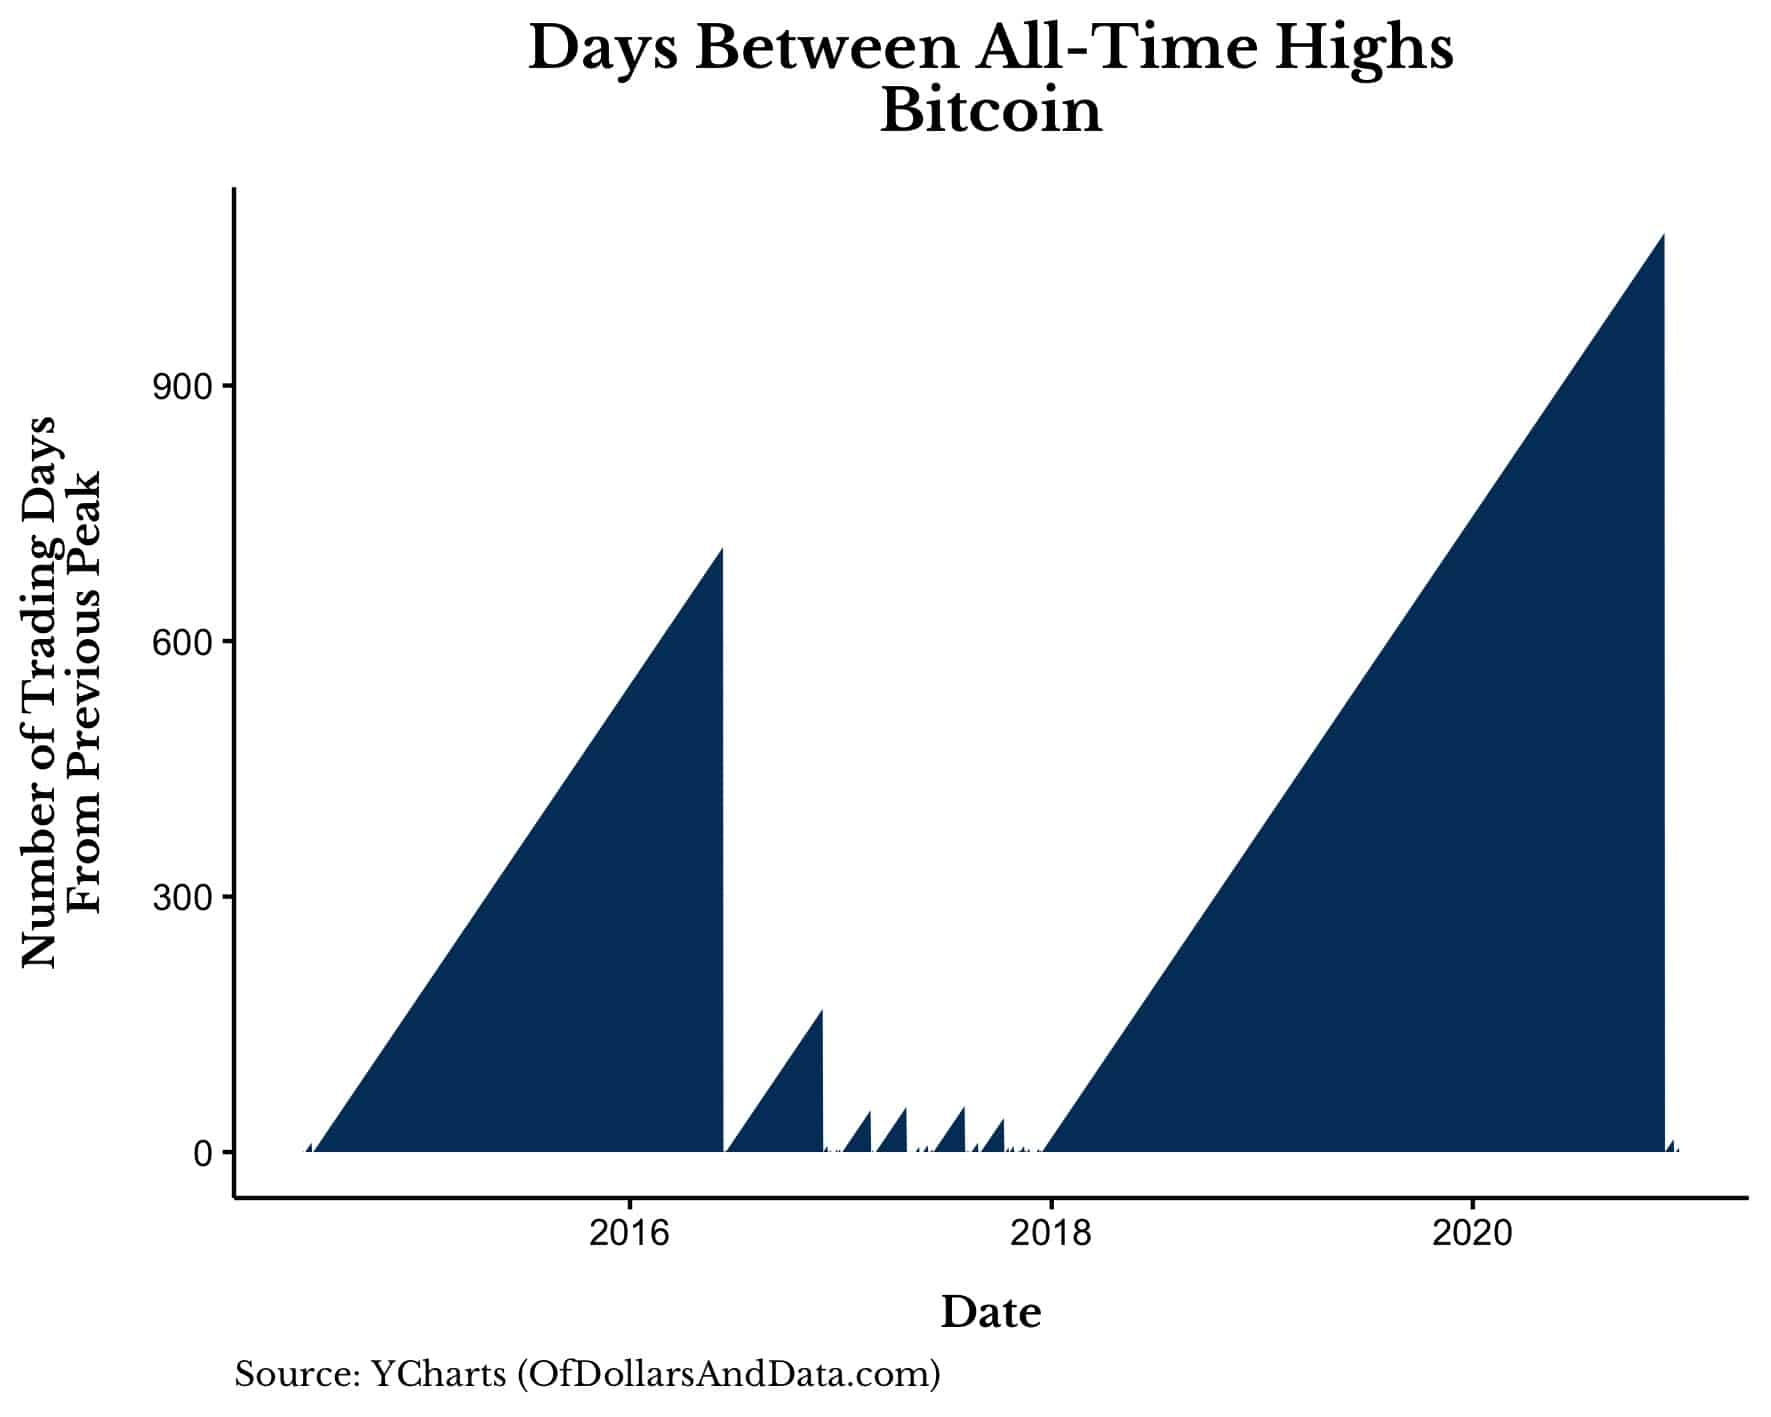
Since Bitcoin is such a young asset class, we have no idea whether investing at all-time highs will be profitable in the future, but it certainly has been in the past.
Though much older than Bitcoin, gold also seems to have run-ups in price that make investing near all-time highs a decent strategy. Using our same distribution plot of one-year future returns for gold, we can see this clearly:
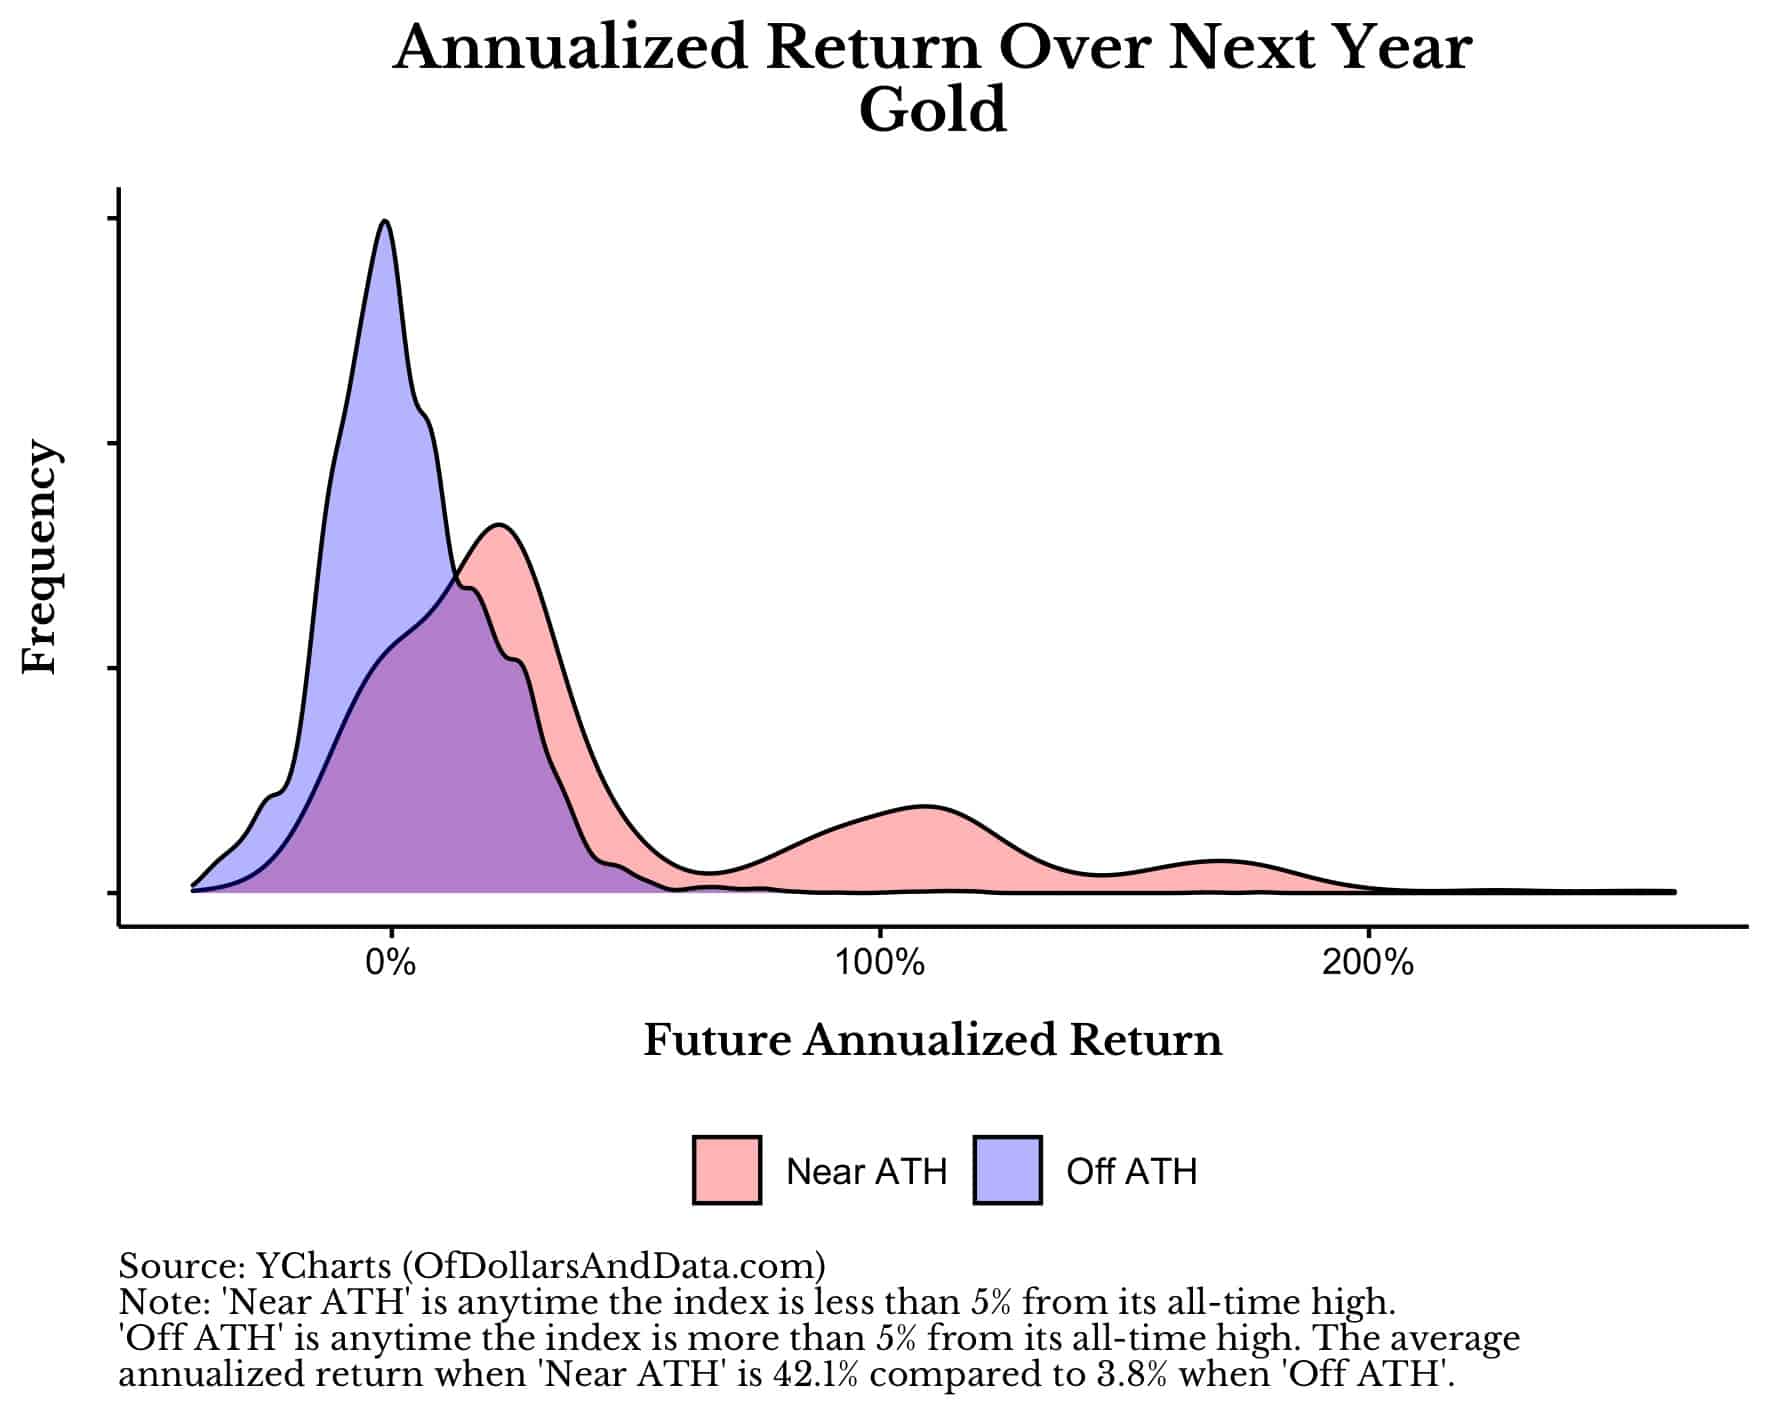
As you can see, when gold is near an all-time high it is far more likely to have a big positive return than when it is 5% (or further) away from its all-time high.
This data suggests that investing at all-time highs in alternative asset classes maybe less risky in the short run than initially imagined. Of course, if you decide to do so, be ready to sit through the long bear markets that may follow.
The Bottom Line
Regardless of which risky asset classes you have in your portfolio, as this post illustrates, buying near all-time highs should not be a cause for concern. Of course, you may get unlucky with an asset class during a particular period of time, however, if you own a diversified portfolio, the impact of such an occurrence should be minimal.
As investors our goal is to grow our wealth so that we can live the life we want. Unless you are investing your entire nest egg into one asset class at a market peak, it is unlikely that buying near an all-time high will ever prevent you from living the life you want. With that in mind, my best suggestion is to just get invested and let the chips fall where they may. After all, there is only so much in our control.
Happy investing and thank you for reading!
If you liked this post, consider signing up for my newsletter.
This is post 220. Any code I have related to this post can be found here with the same numbering: https://github.com/nmaggiulli/of-dollars-and-data

