It’s been one year since the market bottomed during the coronavirus crash on March 23, 2020. I remember that day well because it was the same day I published this blog post explaining why it can be so lucrative to buy during a crisis. Yes, publishing this on the day of the bottom was pure luck, but my bullish stance wasn’t.
Since then I have received comments from many readers about how much this post helped them when times looked the toughest. As a result, I want to revisit the prior year and some of the lessons I have learned since the bottom.
We May Never See a Better 1-Year Rally
If you had bought the S&P 500 on March 23, 2020, you would now be up by 76% (excluding dividends):
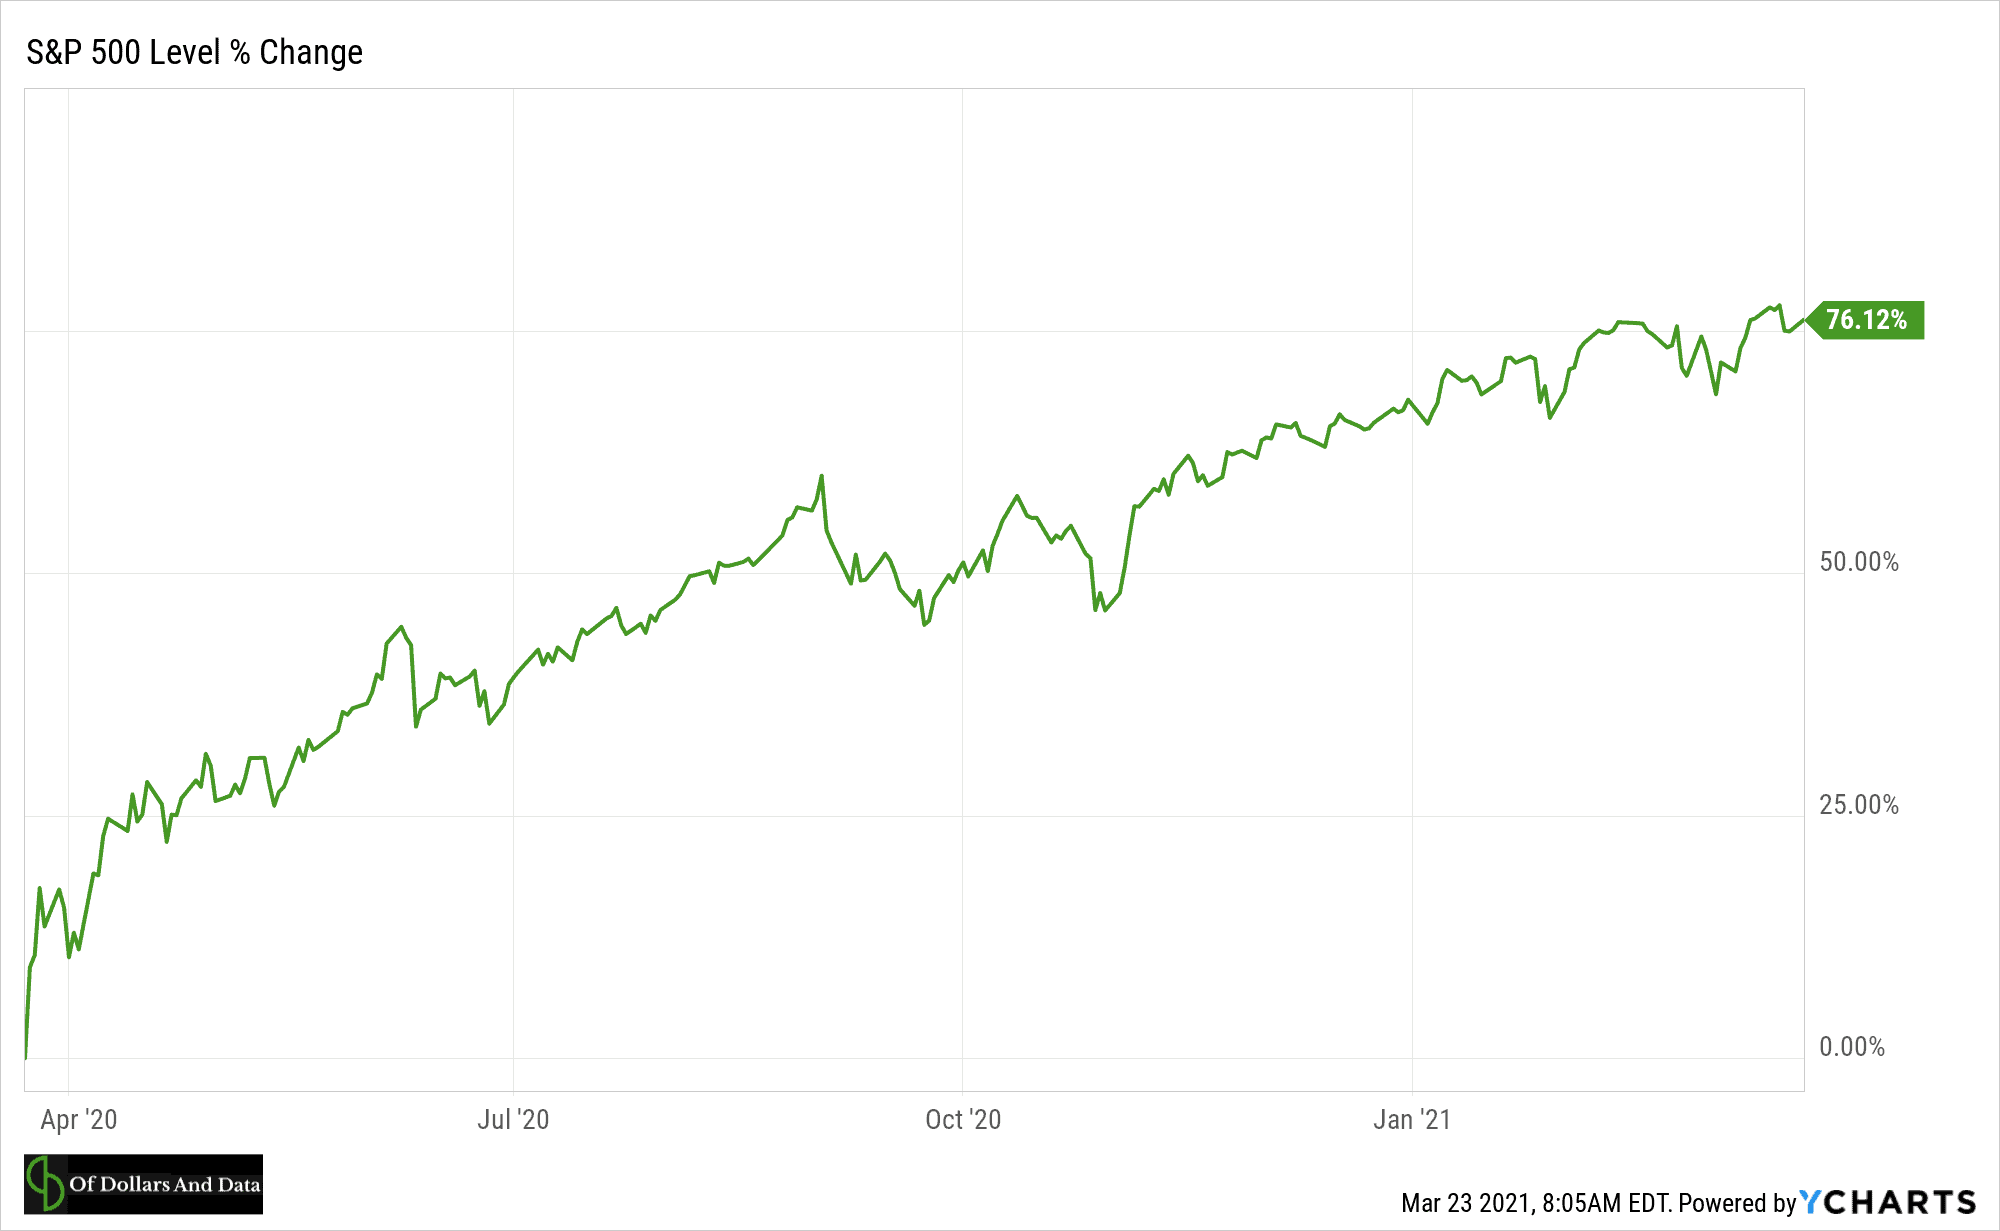
76% in a single year! Returns like that don’t come often. In fact, if you look at the distribution of 1-year returns for the Dow since 1915, you will see how much of an outlier the prior year has been:
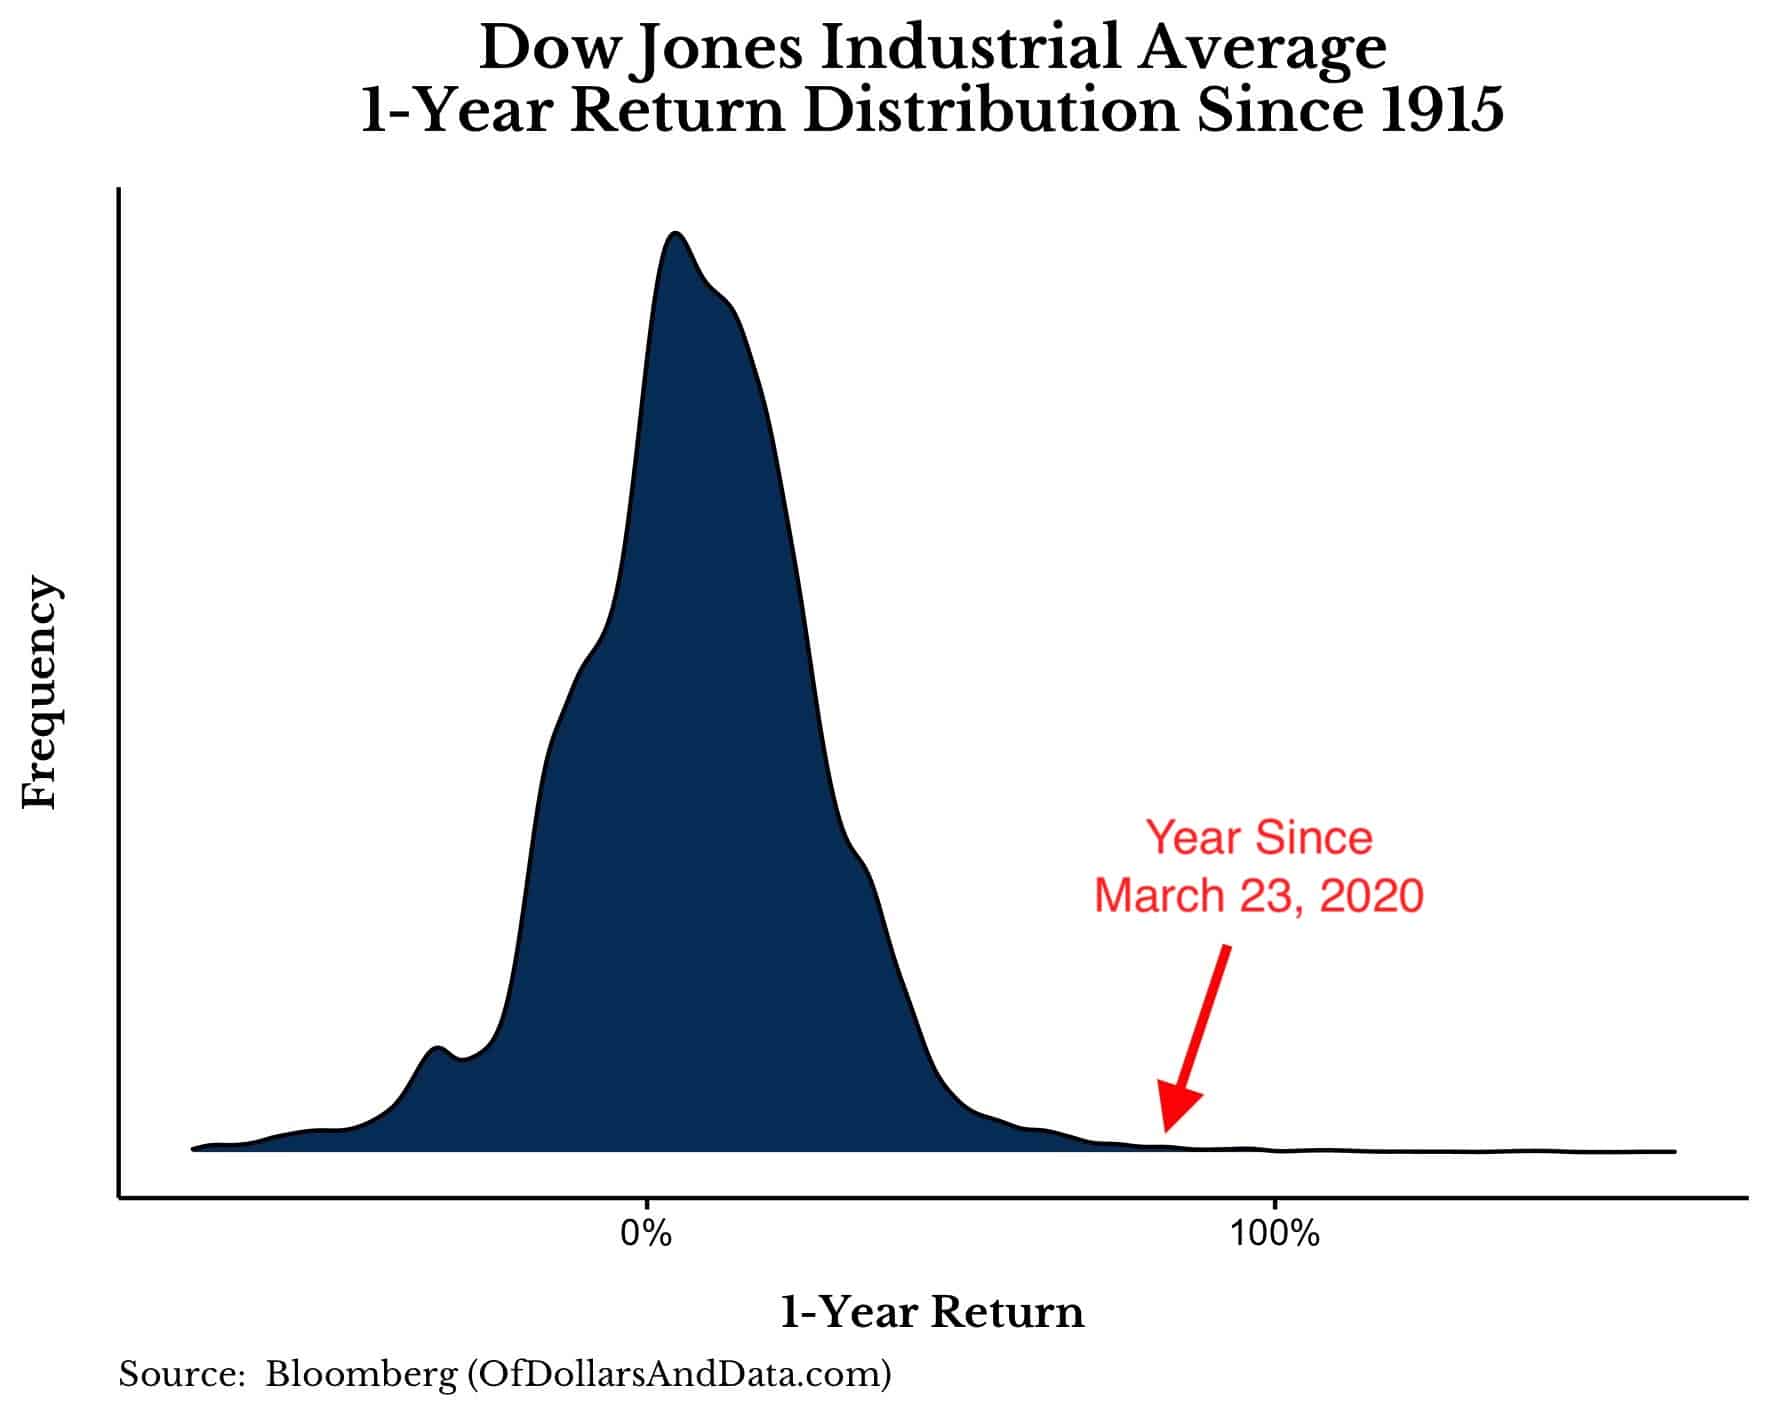
Since 1915 there have only been two periods that had higher returns over the prior year:
- July 1933
- March 1934
Both of these periods occurred during the recovery from The Great Depression.
Therefore, without a doubt March 23, 2020 was a generational buying opportunity. In fact, it may have been a lifetime buying opportunity. If these kinds of crashes (and their subsequent recoveries) continue to be as rare as they have been throughout history, then we may not see a higher 1-year return in U.S. stocks for the rest of our lives.
It seems hard to believe, but we just lived through the stock market equivalent of Halley’s comet. However, unlike Halley’s comet, whose future path is known, we have no idea when another market rally of this magnitude will occur.
It’s Easy to Feel Like an Investment Genius Right Now
Due to the strong returns over the prior year, it’s very easy to feel like an investment genius right now. As Michael Batnick recently highlighted, regardless of size or valuation decile, anyone who bought in March 2020 is up between 60%-150% as of today. With such high returns, almost everyone can feel like they saw it coming. But, I promise you that this is mostly hindsight bias.
How do I know? Because even I called (and traded) the bottom. In addition to my bullish post on March 23, 2020, I also sold all of the bonds in my retirement accounts and rebalanced into equities/REITs on the same day. I have trade confirms to prove it too:
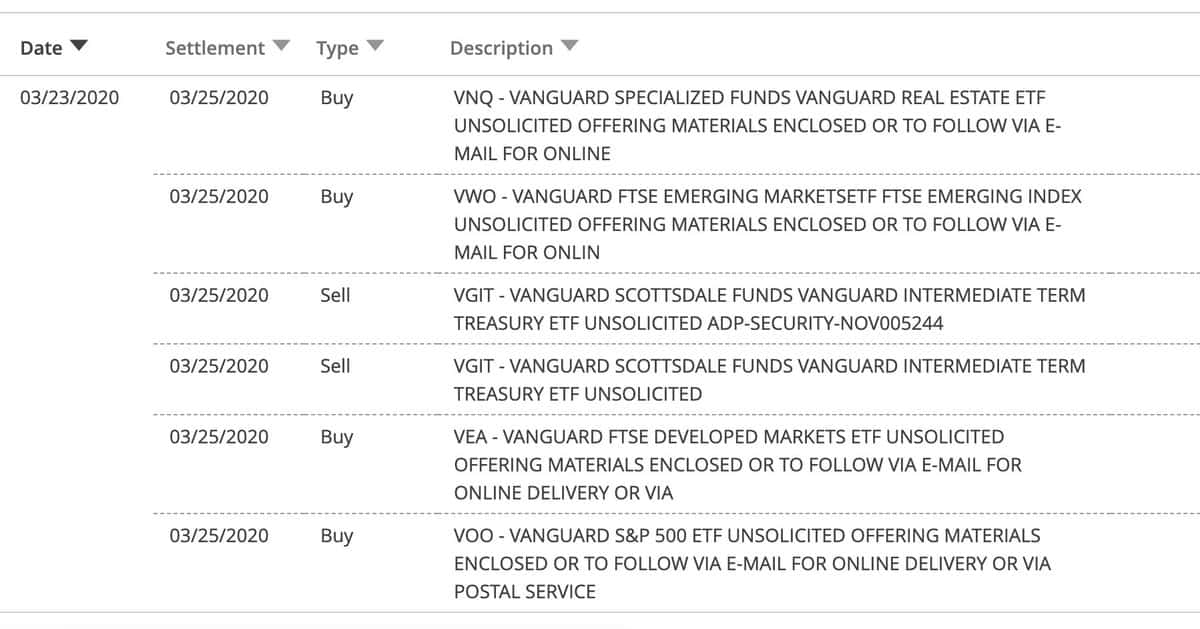
Should I sell a course on market timing? How about a book on predicting market sentiment? No thanks.
Why not capitalize on my tactical skills? Because I know they don’t exist. Trading the bottom was 99% luck. Anyone who says differently is lying to themselves. Because, at the time, no one knew what would come next. On March 24, 2020, the market could’ve easily continued its downward trajectory. But…it didn’t.
Looking back now it’s tempting to see yourself as an investment guru, but the real guru would recognize the difference between their abilities and a rising tide lifting all boats.
Most People Got the Recovery Wrong
If you needed more proof that most people have no idea what comes next, consider how well they predicted the recovery.
On March 20, 2020 (a few days before the bottom), I asked Twitter how long it would take for the S&P 500 to make new all-time highs. The majority voted for a recovery time of greater than two years:
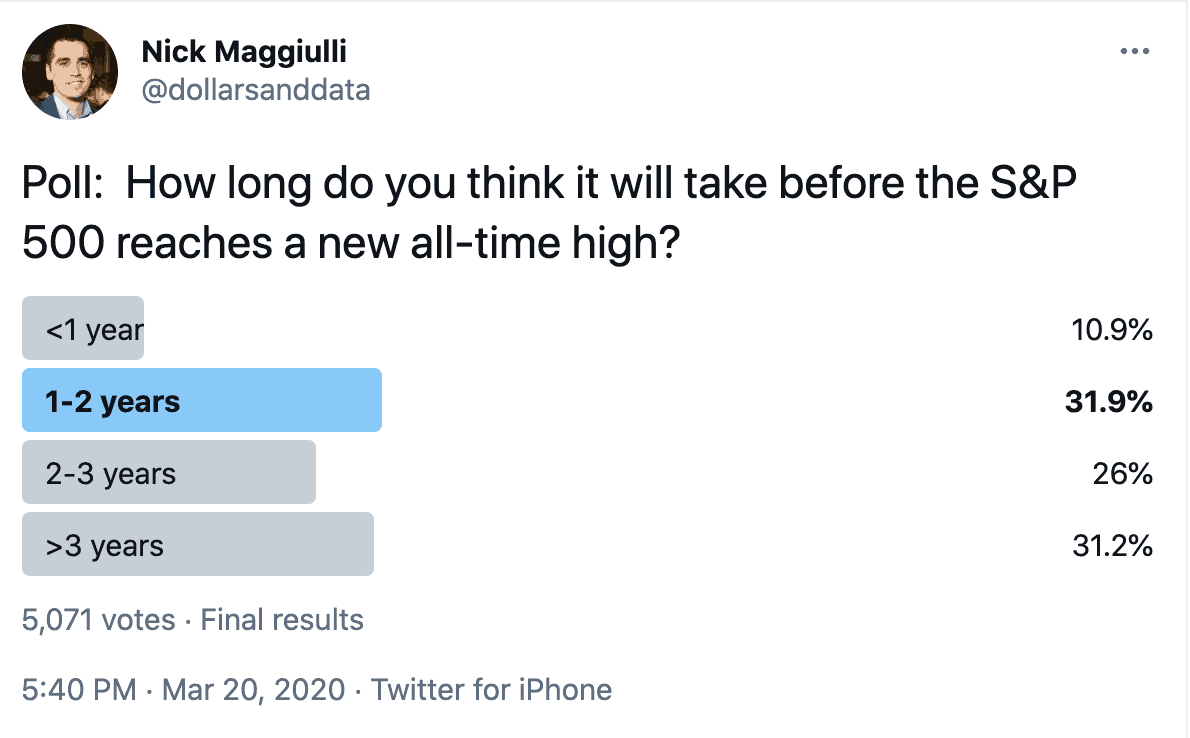
As we all know now, they were wrong. Very wrong. In fact, only 11% of my Twitter audience voted for the correct answer “<1 year”. Unfortunately, I wasn’t a part of this 11%.
Despite my bullishness at the time, I thought that the recovery would take at least a year (even in the best case scenario). But I wasn’t even close. As a surprise to almost everyone, within six months of the March 23 bottom we were hitting all-time highs once again:
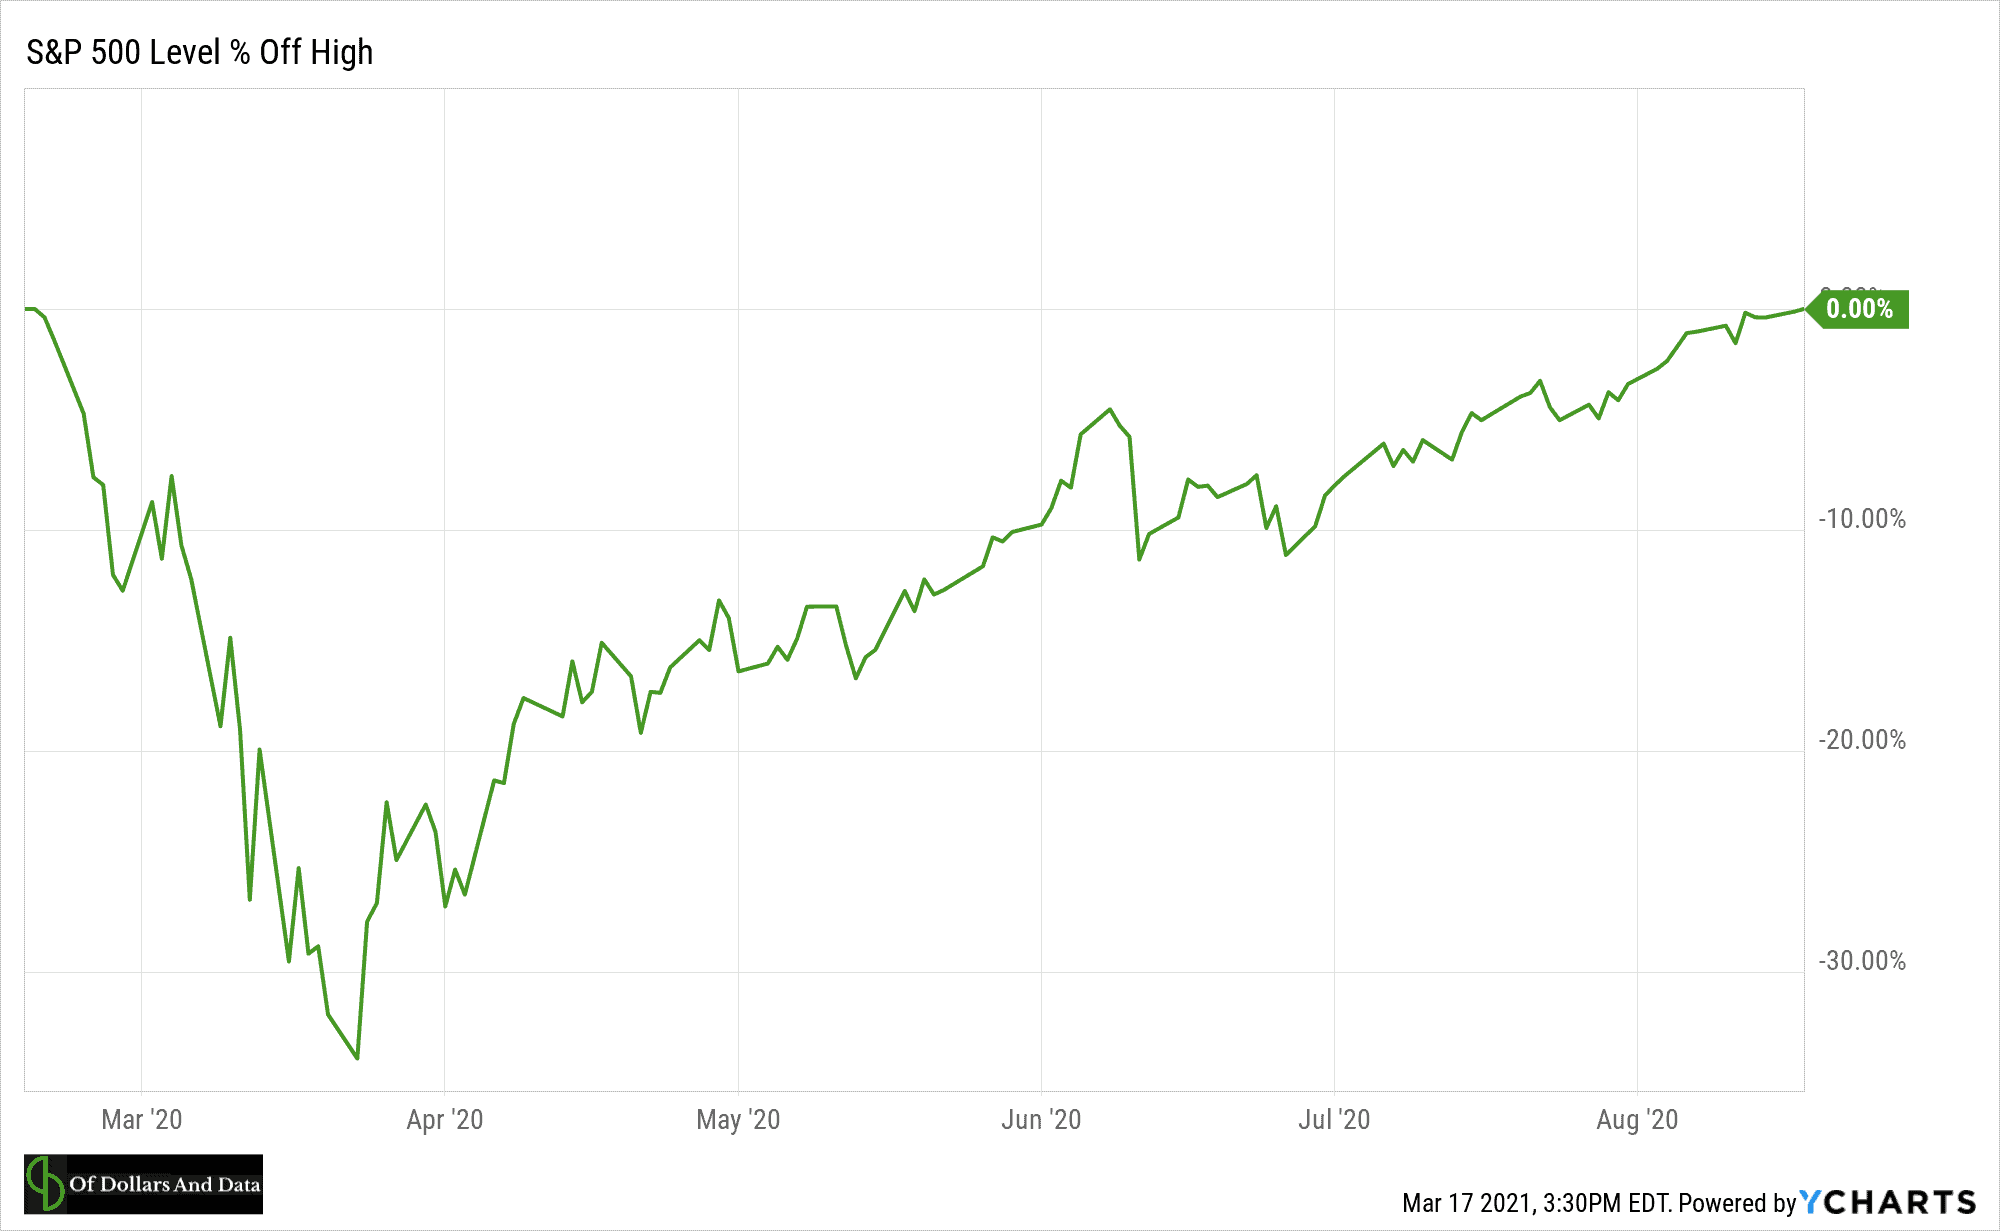
The quickness of the recovery popularized the talking point “the stock market is not the economy.” And since then, this idea has come to dominate the financial conversation. Unfortunately, the speedy recovery also seems to have given fuel to the “everything is in a bubble” theory as well.
Regardless of what you believe, the past twelve months have illustrated that predicting the future is always much harder than it seems.
The Triumph of the Optimists
Of all the things that I will take with me from the last year, it’s that the optimists usually win. Yes, there are many things wrong with the world, but the arc of history continues to bend toward progress and a better future for humanity. It’s easy to forget this when things look the bleakest, but it’s true.
For example, a few months before the bottom in March 2020, scientists came up with the COVID-19 vaccine in a matter of days. It took them just a few days to create a vaccine that is now being distributed around the world and saving millions of lives.
How can you be pessimistic in a world like this? How can you be bearish when we have gone through far worse and bounced back time and time again? The Oracle of Omaha said it best:
In the 20th century, the United States endured two world wars and other traumatic and expensive military conflicts; the Depression; a dozen or so recessions and financial panics; oil shocks; a flu epidemic; and the resignation of a disgraced president. Yet the Dow rose from 66 to 11,497.
So, what’s it gonna be? Do you want to focus on the negative and run at the first sign of panic? Or do you want to focus on the long-term trend and join the optimists?
Of course, no one knows when the next bottom will come or what will cause it, but I’m willing to bet that this future bottom will be higher than the last one. Happy investing and thank you for reading!
If you liked this post, consider signing up for my newsletter.
This is post 234. Any code I have related to this post can be found here with the same numbering: https://github.com/nmaggiulli/of-dollars-and-data

