This week I want to talk about market timing and momentum in stock prices. Though I have already described why you should just keep buying regardless of market valuations, I want to dig deeper on this point to illustrate how difficult it can be to time the market and why buying at all time highs is not always a thing to be avoided.
To start, I want to tell you about a simulation I ran to test whether it would be possible to time the market (i.e. buy low and sell high) based on the market’s valuation. In particular, I used Robert Shiller’s S&P 500 real price/dividend data and his cyclically adjusted price to earnings ratio (CAPE) as my valuation measure. My goal was to use the CAPE to determine when to buy and sell stocks. I tested a buy low/sell high strategy with various low and high CAPE values. For example, one of the many strategies I tested was:
- Buy when CAPE goes below 15 (i.e. stocks are cheap) and sell when it goes above 30 (i.e. stocks are expensive). After you sell, don’t buy again until the CAPE is below 15.
Unfortunately, I discovered that there was no consistent strategy that outperformed buy and hold over all market periods observed. In some periods a market timing strategy (like the one mentioned above) outperformed buy and hold, but in other periods it failed. For example, using the “buy at CAPE = 15, sell at CAPE = 30” strategy would have been successful in the years before the Great Depression, but it would have failed miserably during the dotcom boom of the late 1990s. Others have come to similar conclusions about using CAPE for timing the market.
While my simulation does not disprove market timing as a whole, since there are many timing strategies that are more complex than this, it does illustrate that you cannot time the market purely based on the market’s valuation. However, this begs a bigger question: What about buying near all time highs? CAPE hitting 30 may not mean anything, but maybe buying near an all time high may be indicative when to exit the market, right?
To address this, let’s consider the real monthly returns (including dividends) of the S&P 500 from 1880–2016. Below is a chart that shows this price series over time with a red dot for every time the S&P 500 reached a new all time high. Of the 1,644 monthly returns in the data, 356 were all time highs, which represents ~22% of all months. Note that I use a log scale for the y-axis:
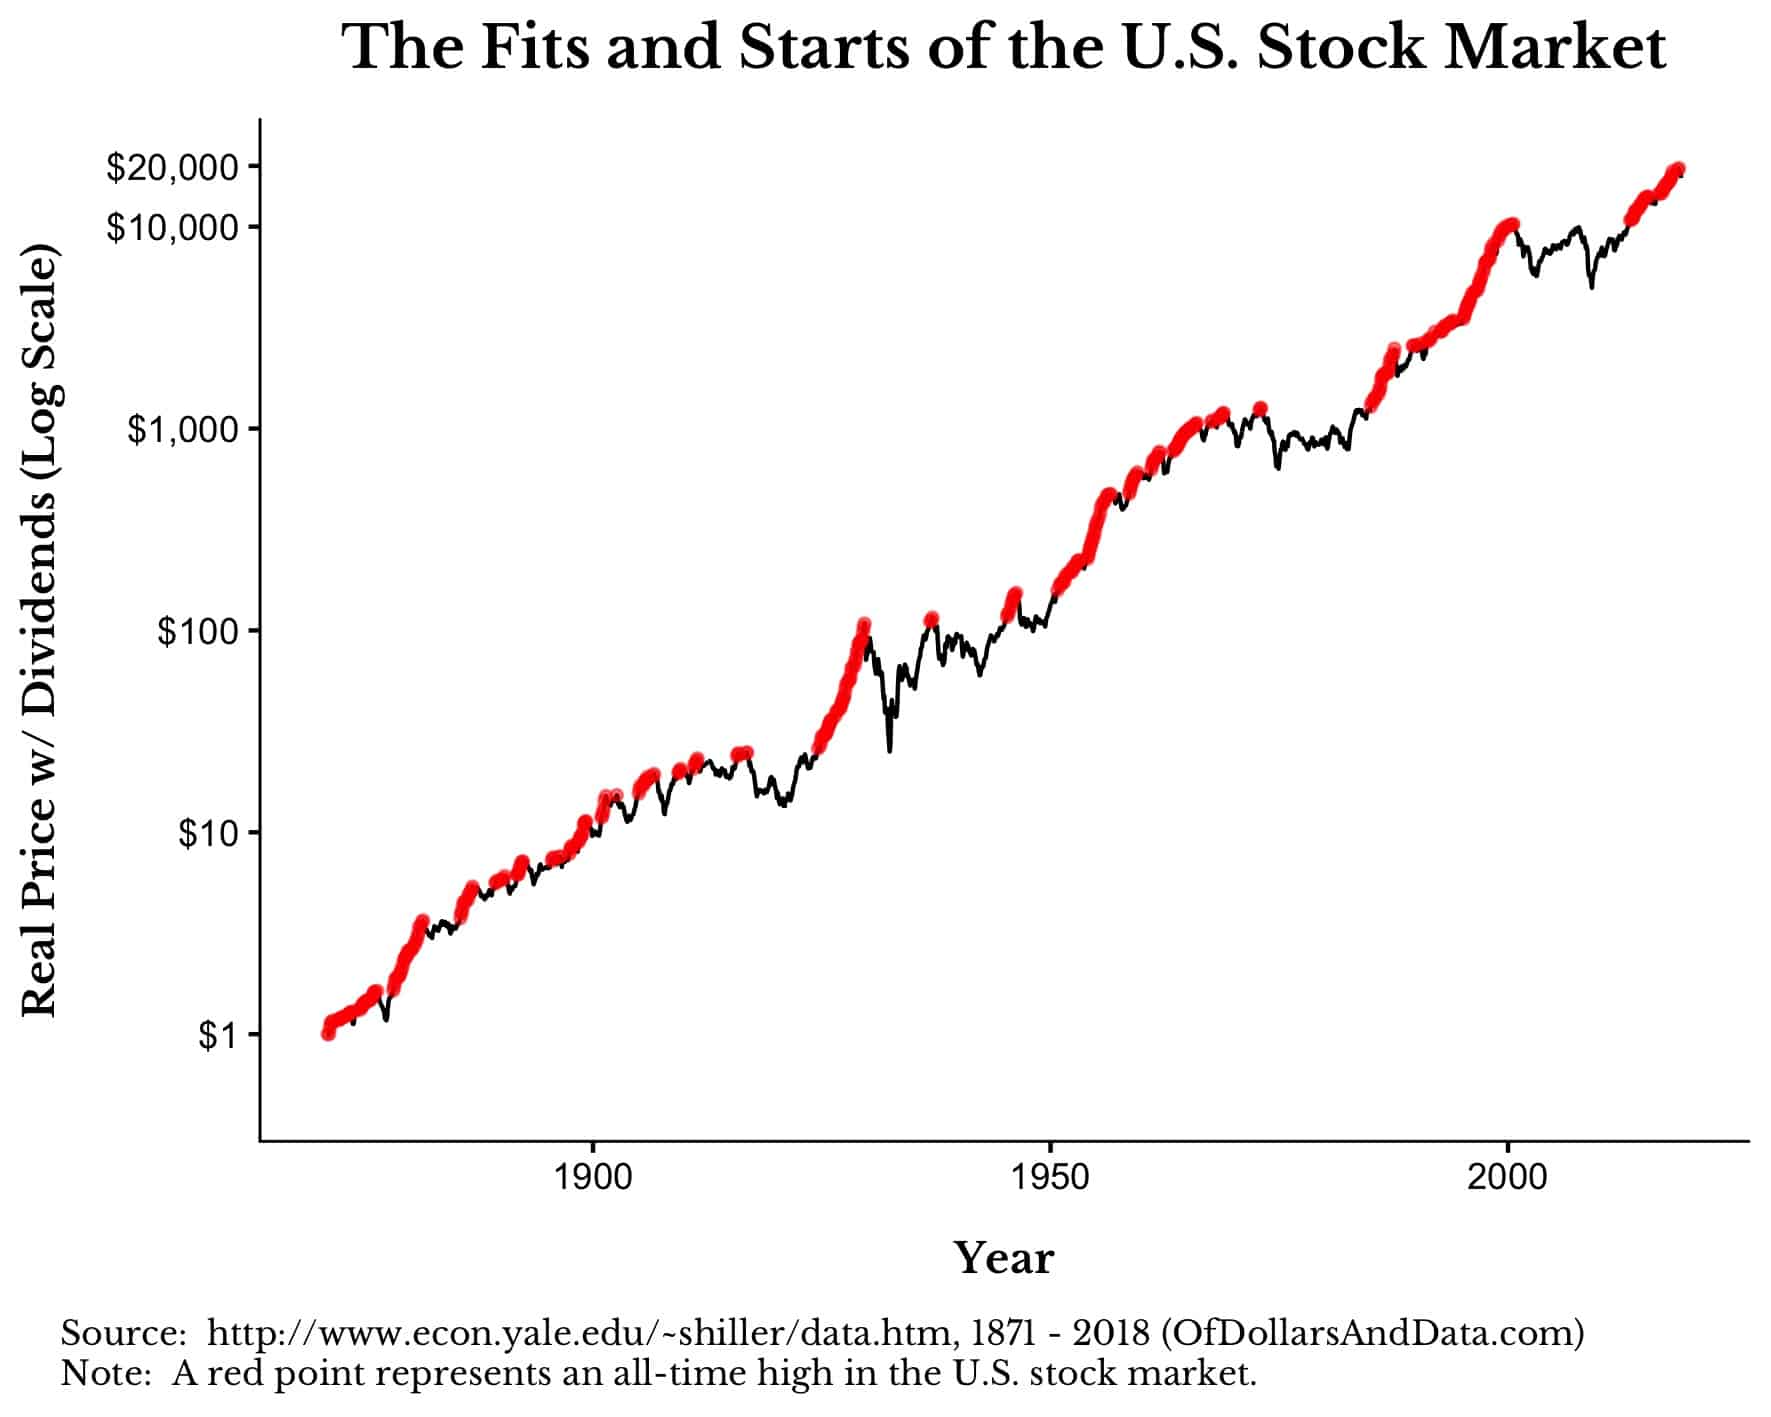
As you can see, the S&P 500 has periods of what I call “fits and starts”, or lackluster growth and then explosive growth. Michael Batnick, who runs the Irrelevant Investor, summarized the relationship between fits and starts of the S&P 500 beautifully with the following chart:
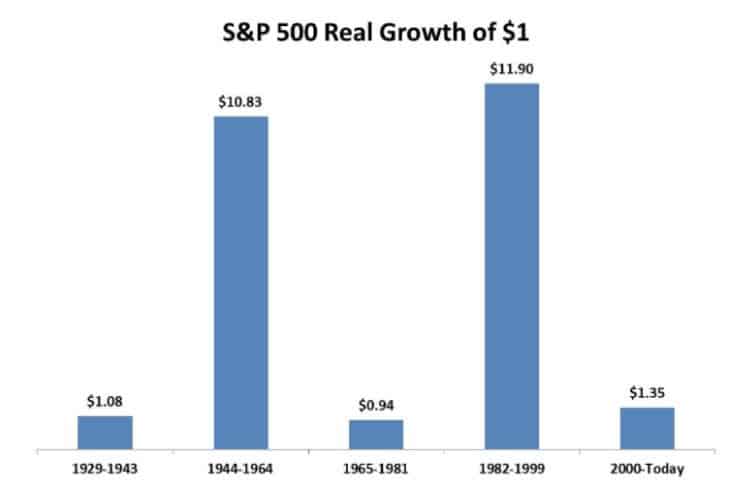
As you can see, some periods produce gains that are 10x larger than other periods of time.
Despite these fits and starts, there is an interesting relationship between all time highs in the stock market. Once you have hit an all time high, the very next month you are likely to hit another all time high. To be exact, of the 356 market peaks, ~67% of them were followed by another market peak in the next month and ~90% of them were followed by another market peak within the next 4 months.
Market peaks cannot go on forever, which is why there can be long periods of drawdowns before a new peak is reached. However, this underscores the important role that momentum plays in the stock market. If we were to plot the number of months between market peaks it would look like this:
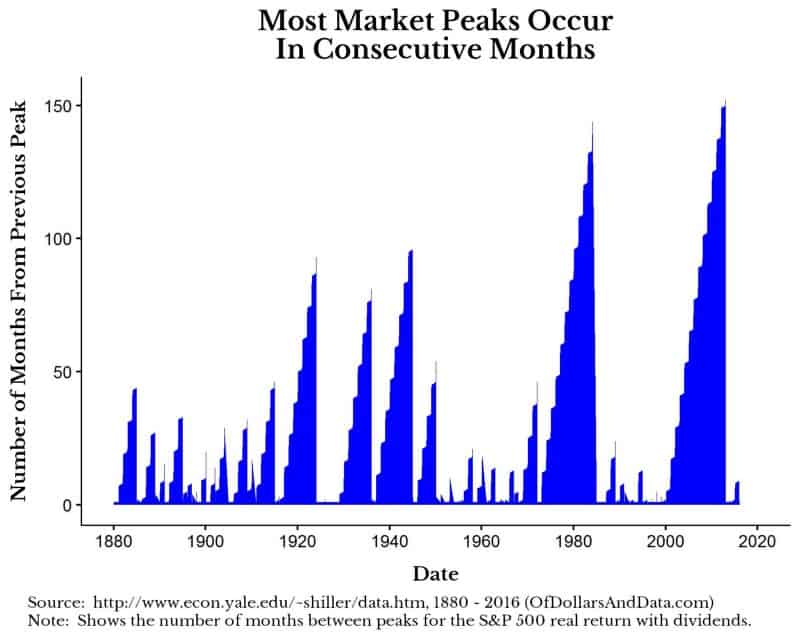
Though this chart may suggest that market peaks usually happen far apart from each other, these long periods are the exception. Most of the action is happening near the base of the y-axis where the number of months between peaks is low.
Don’t Be Afraid to Keep Buying
I understand that buying at an all time high doesn’t feel right because of the history of market crashes that have followed in numerous cases. I am here to tell you that you should just keep buying. This will only work for a limited time, but missing the upside could be more devastating to your portfolio than experiencing the downside.
One caveat with this analysis is that some markets reach all time highs and then never get back to those all time highs (i.e. we are still waiting for Japan to surpass its 1989 peak). This is a legitimate risk, but if you are following some form of dollar cost averaging, you will reduce the impact of these kinds of events. Stay the course and don’t fear the bull (or the bear that will follow). Thank you for reading!
If you liked this post, consider signing up for my newsletter.
This is post 26. Any code I have related to this post can be found here with the same numbering: https://github.com/nmaggiulli/of-dollars-and-data

