Last Tuesday, as the S&P 500 closed down nearly 19% from its February highs, my portfolio was only down around 8%. What’s my secret?
Did I pick the right stocks?
Did I avoid the right sectors?
Did I time the market and get out early?
None of the above. My secret is…I’m diversified. I own risk assets other than U.S. stocks and currently have a good portion in U.S. Treasury bills (since I’m saving for a house). As the saying goes, “Concentrate to get rich, diversify to stay rich.”
I’ve always had a problem with this phrase though. Because, for most people, it isn’t true. If you define “rich” as becoming a billionaire, then, yes, the phrase is valid. Getting to the three comma club without concentration is nearly impossible.
However, if you define rich as “having enough money to live an enjoyable life,” then you don’t need concentration at all. In fact, you can get rich enough through diversification alone.
But diversification isn’t as easy as it seems. While it felt good to outperform the market by about 11%, I technically paid for this privilege. How so?
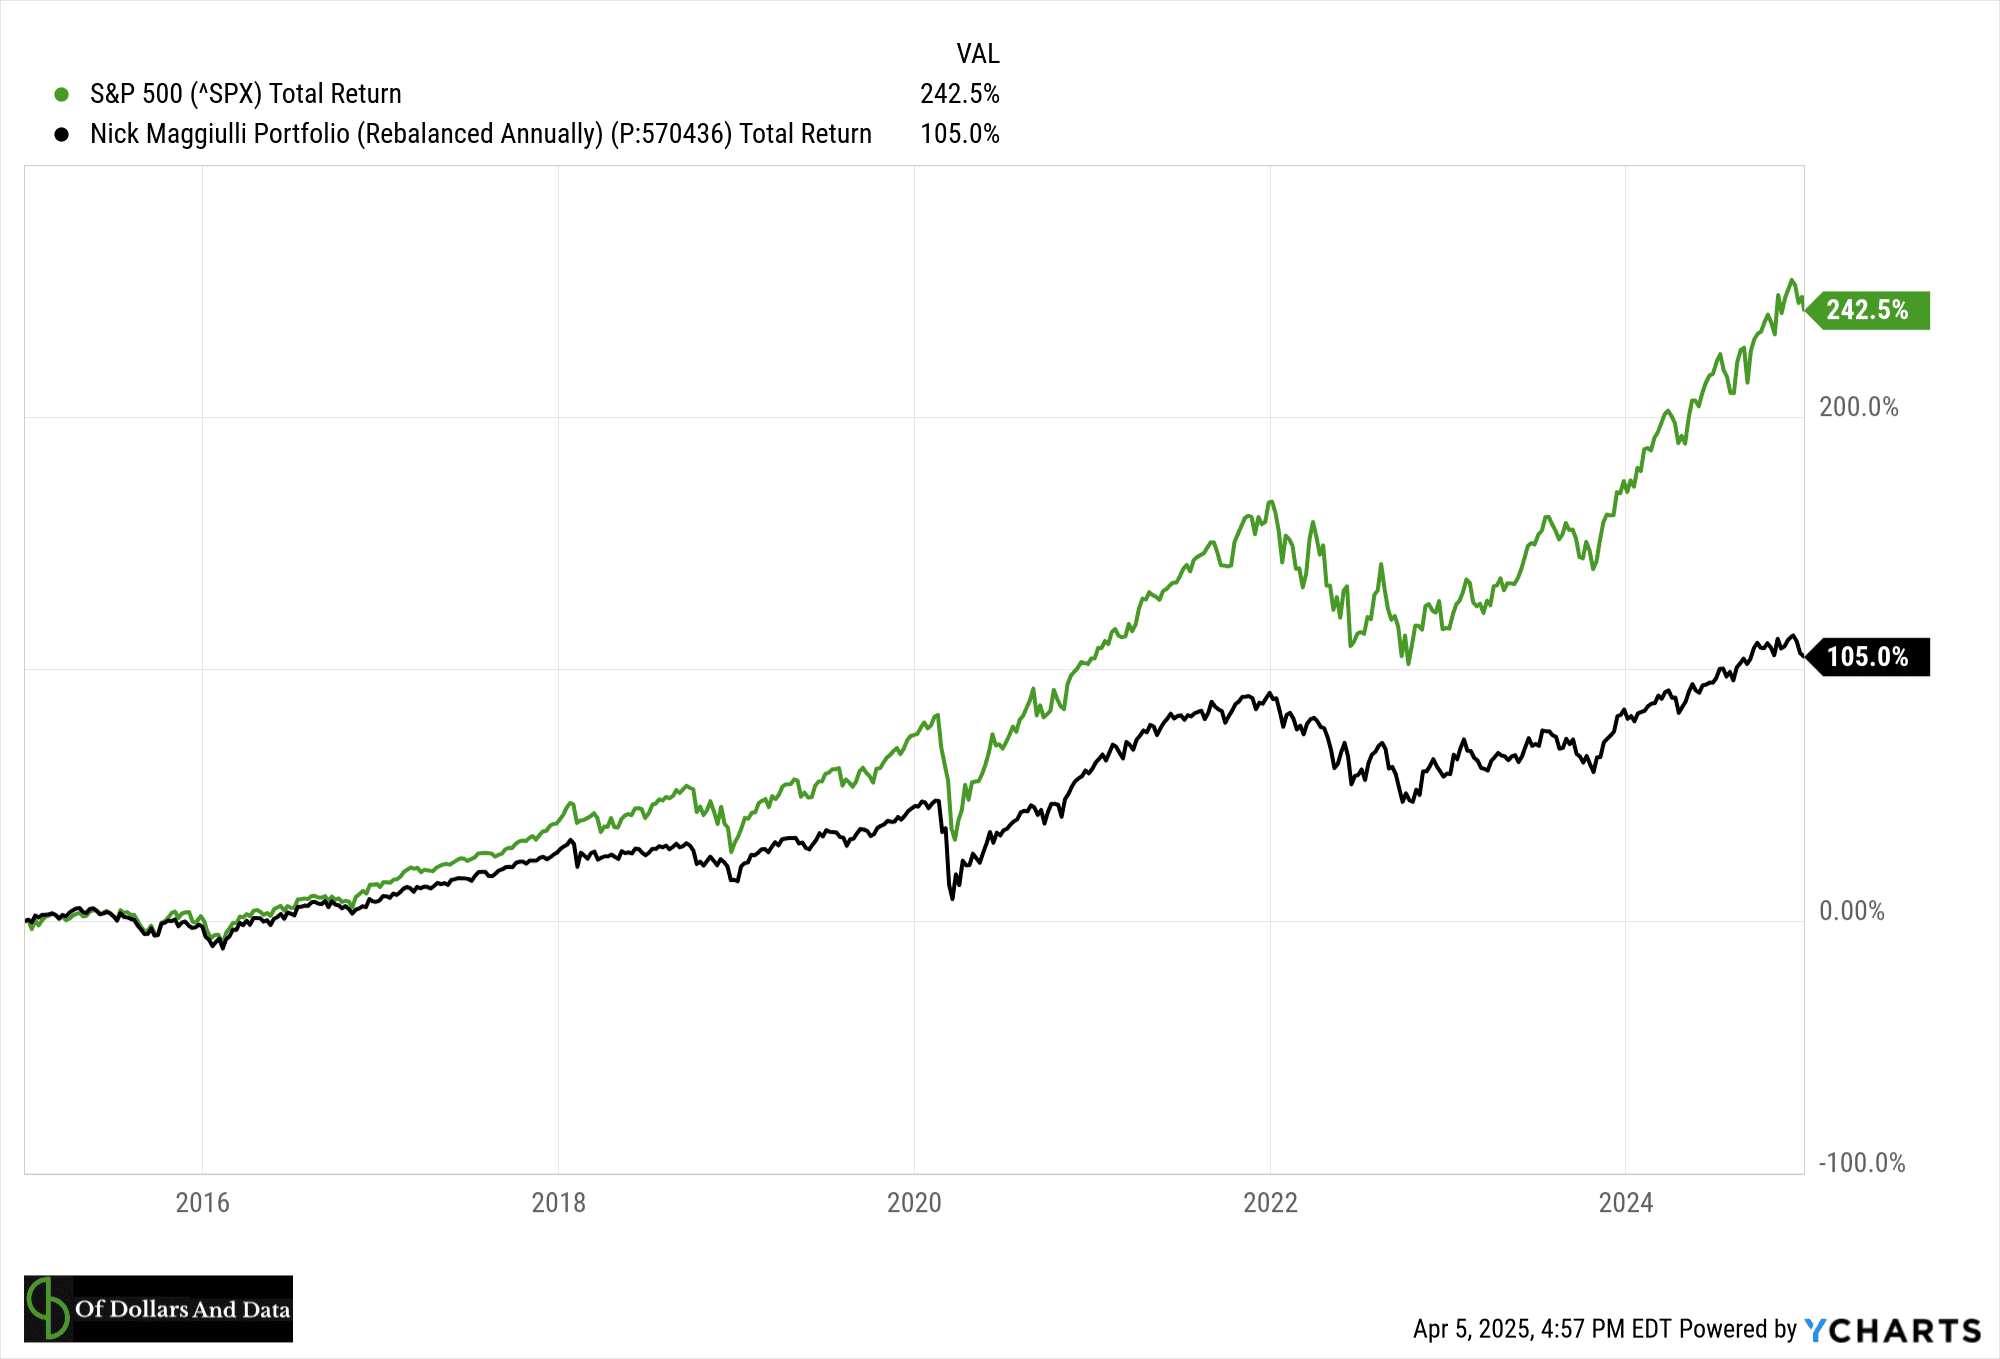
I’ve been underperforming the S&P 500 for years. The chart below is a rough approximation of how my portfolio (“Nick Maggiulli Portfolio”) has performed related to the S&P 500 through the end of 2024:
As you can see, it hasn’t been pretty. This is why my recent outperformance (vs. the S&P 500) doesn’t feel special in the grand scheme of things. Because I know that I would’ve made far more money by being 100% in the S&P 500 over the last decade. Even with the recent selloff, I’m nowhere close to closing this gap in performance.
What caused this gap in the first place? My ownership of international stocks, short-term U.S. bonds, and a handful of other asset classes that basically all underperformed the S&P 500.
But here’s the rub—this underperformance is a feature of every diversified portfolio. By definition, having a diversified portfolio guarantees that you won’t have all of your money in your top performing asset. You’ll always be underperforming something.
With this in mind, let’s look at how a diversified portfolio performed historically and how this applies to our future performance.
How Diversification Performs
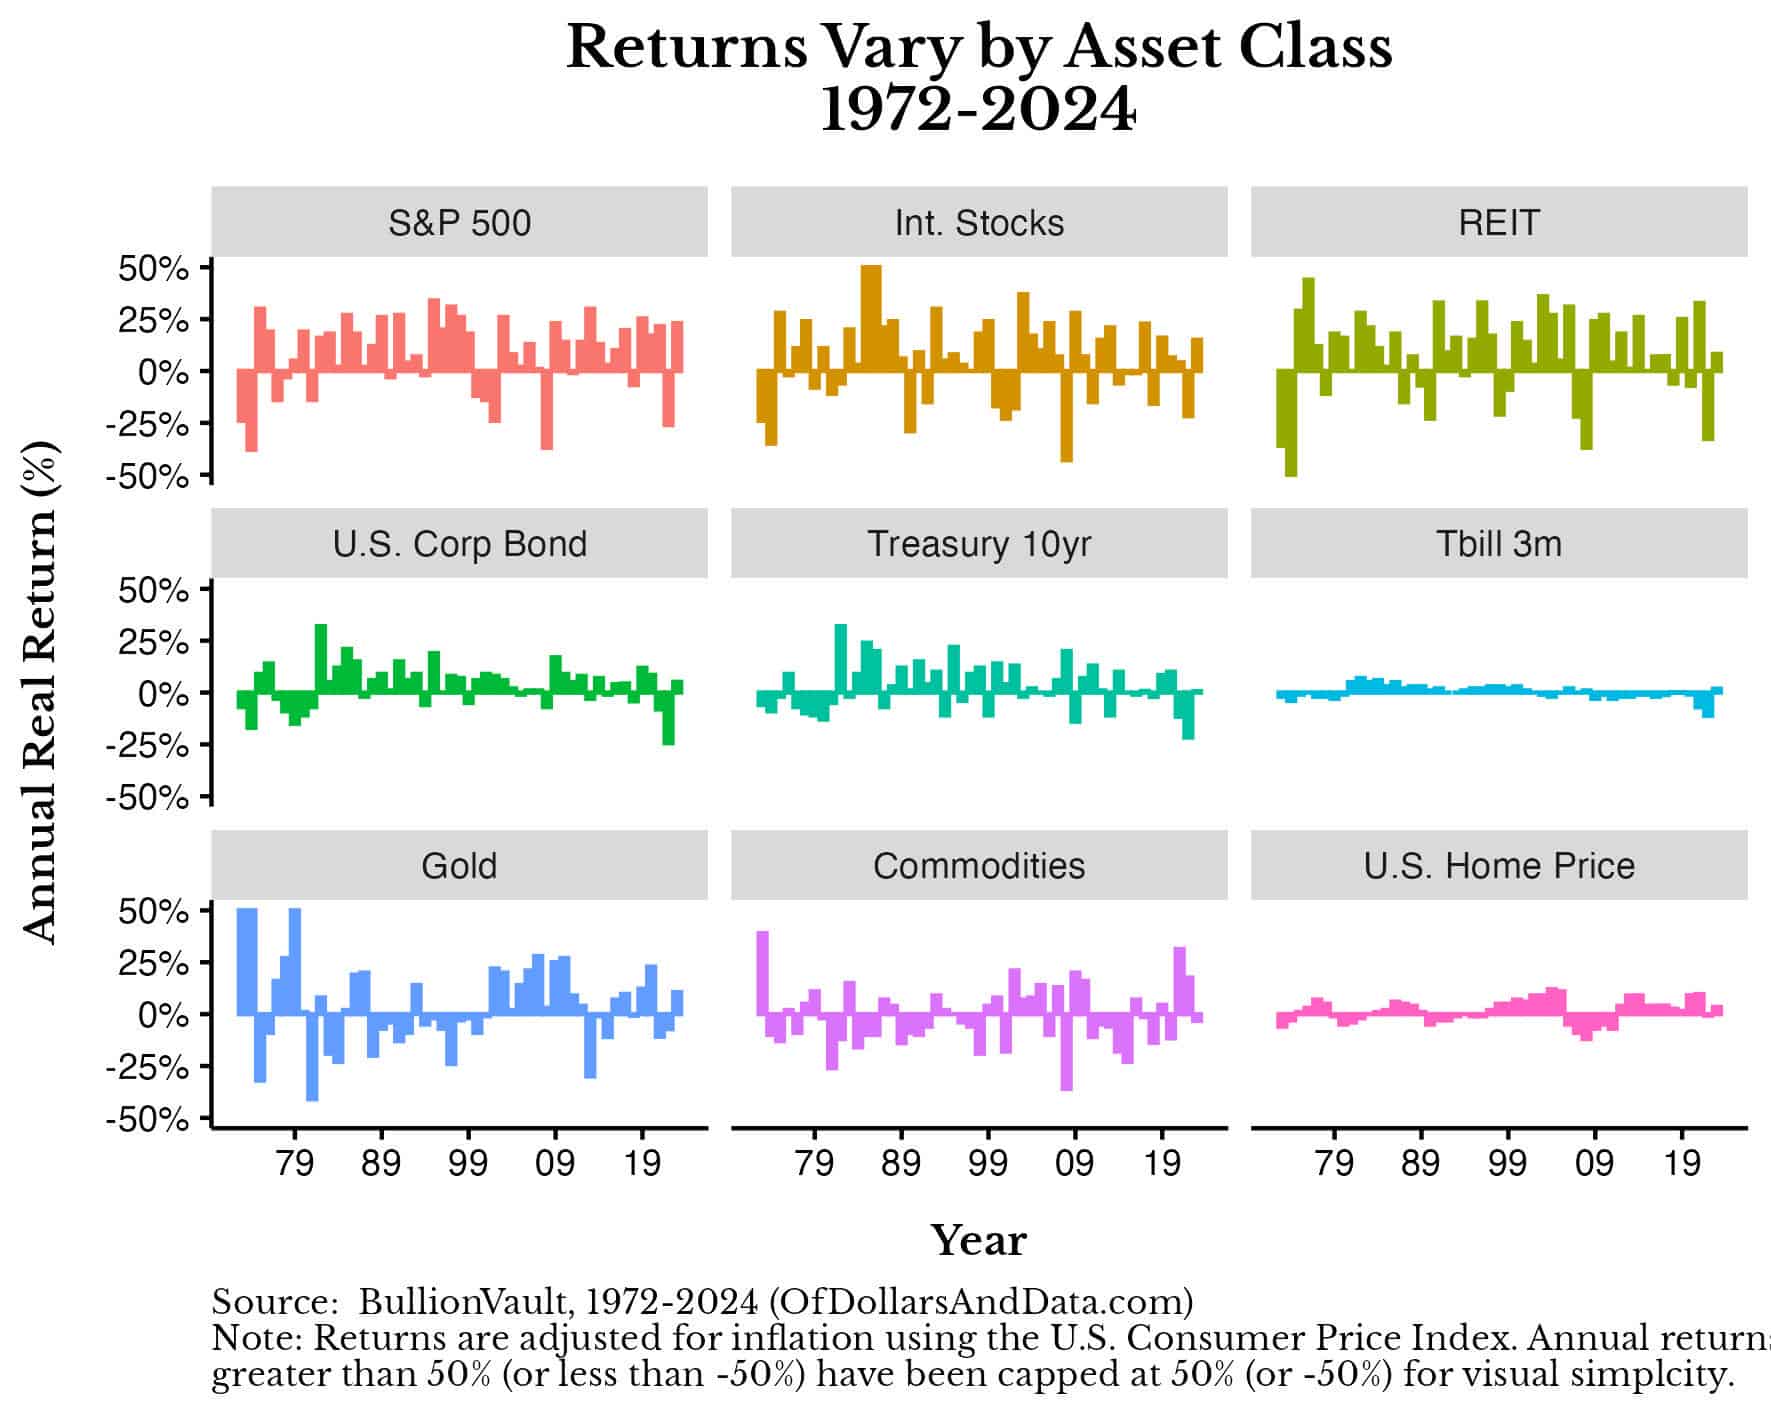
If we look at the historical returns for various asset classes (U.S. stocks, Int. Stocks, U.S. REITs, U.S. Corporate Bonds, 10-Year U.S. Treasuries, Gold, Commodities, and U.S. Homes) from 1972-2024, we can see that they vary quite a bit:
Some asset classes are volatile (e.g., Gold and REITs) while others aren’t (e.g., 3-month Treasury Bills and U.S. Homes). But it’s the combination of these assets that produces intriguing results.
For example, we can use an optimizer to solve for the combination of assets (above) that produces the portfolio with the highest return per unit risk. This is formally known as the optimal portfolio and it represents the highest return-per-unit-risk portfolio for a given time period and set of asset classes. Of course, the optimal portfolio is not knowable in real time, but it can be solved for after the fact.
Using the historical data for the asset classes above, the optimal portfolio (“Optimal Portfolio”) from 1972-2024 was:
- 37% U.S. Home
- 27% U.S. Stocks
- 17% Gold
- 16% 10-Year U.S. Treasuries
- 3% U.S. REITs
This portfolio had an average inflation-adjusted return of 4.5% per year with a standard deviation of 6.6%. Compare this to the S&P 500, which had an average inflation-adjusted return of 8.4% with a standard deviation of 17.7% over this same time period. This means that the Optimal Portfolio had about half of the average annual return of the S&P 500, but with only 37% of the risk! This is what makes it appealing.
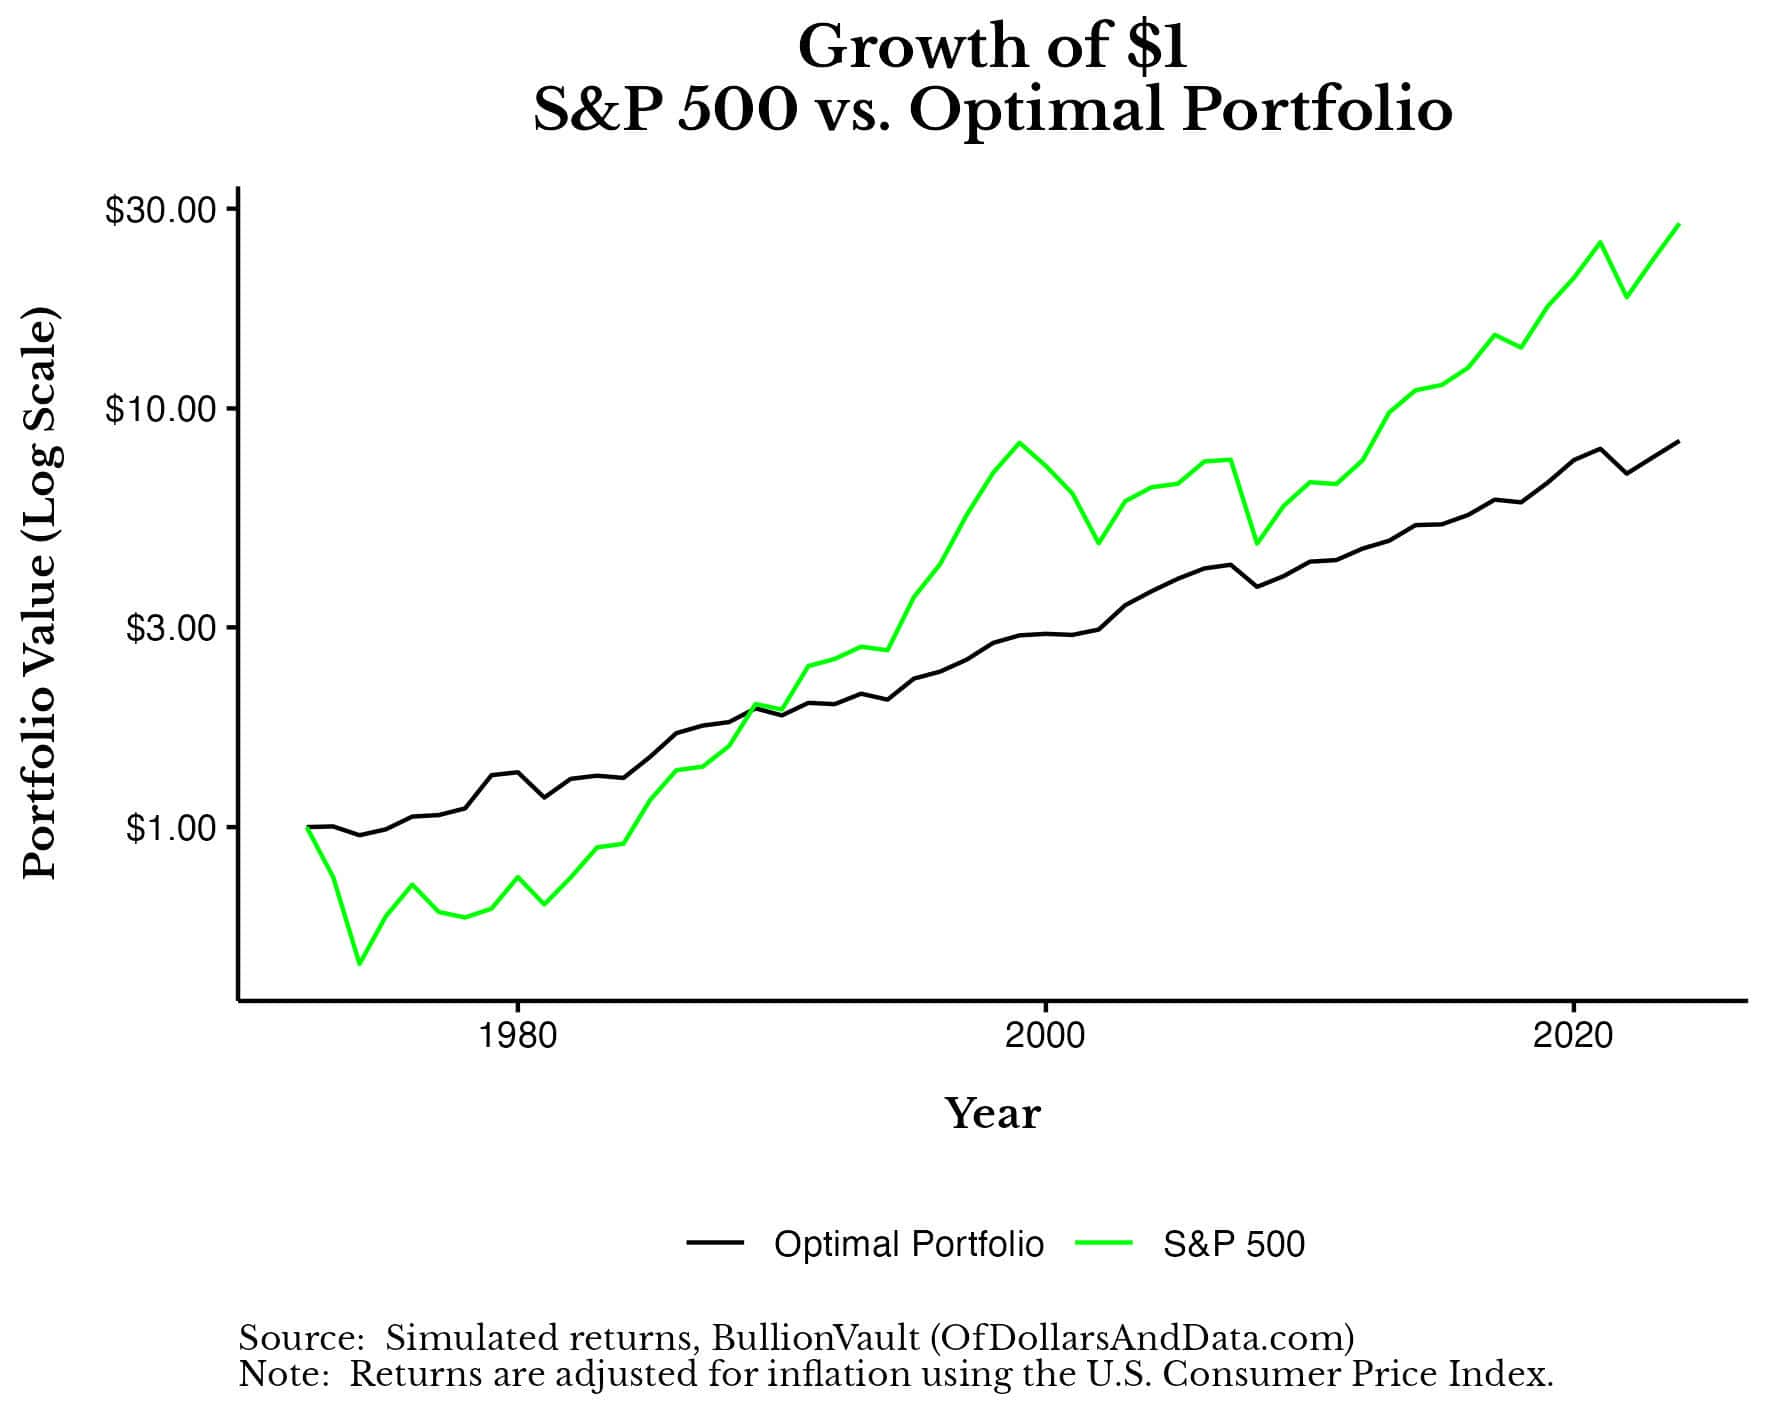
You can see this more clearly when examining the growth of $1 invested in the S&P 500 and the Optimal Portfolio from 1972-2024. Note that the y-axis is a log scale which allows us to better visualize the fluctuation in value of each strategy over time:
As you can see, though the Optimal Portfolio underperformed the S&P 500, it did so with far less overall volatility (as expected).
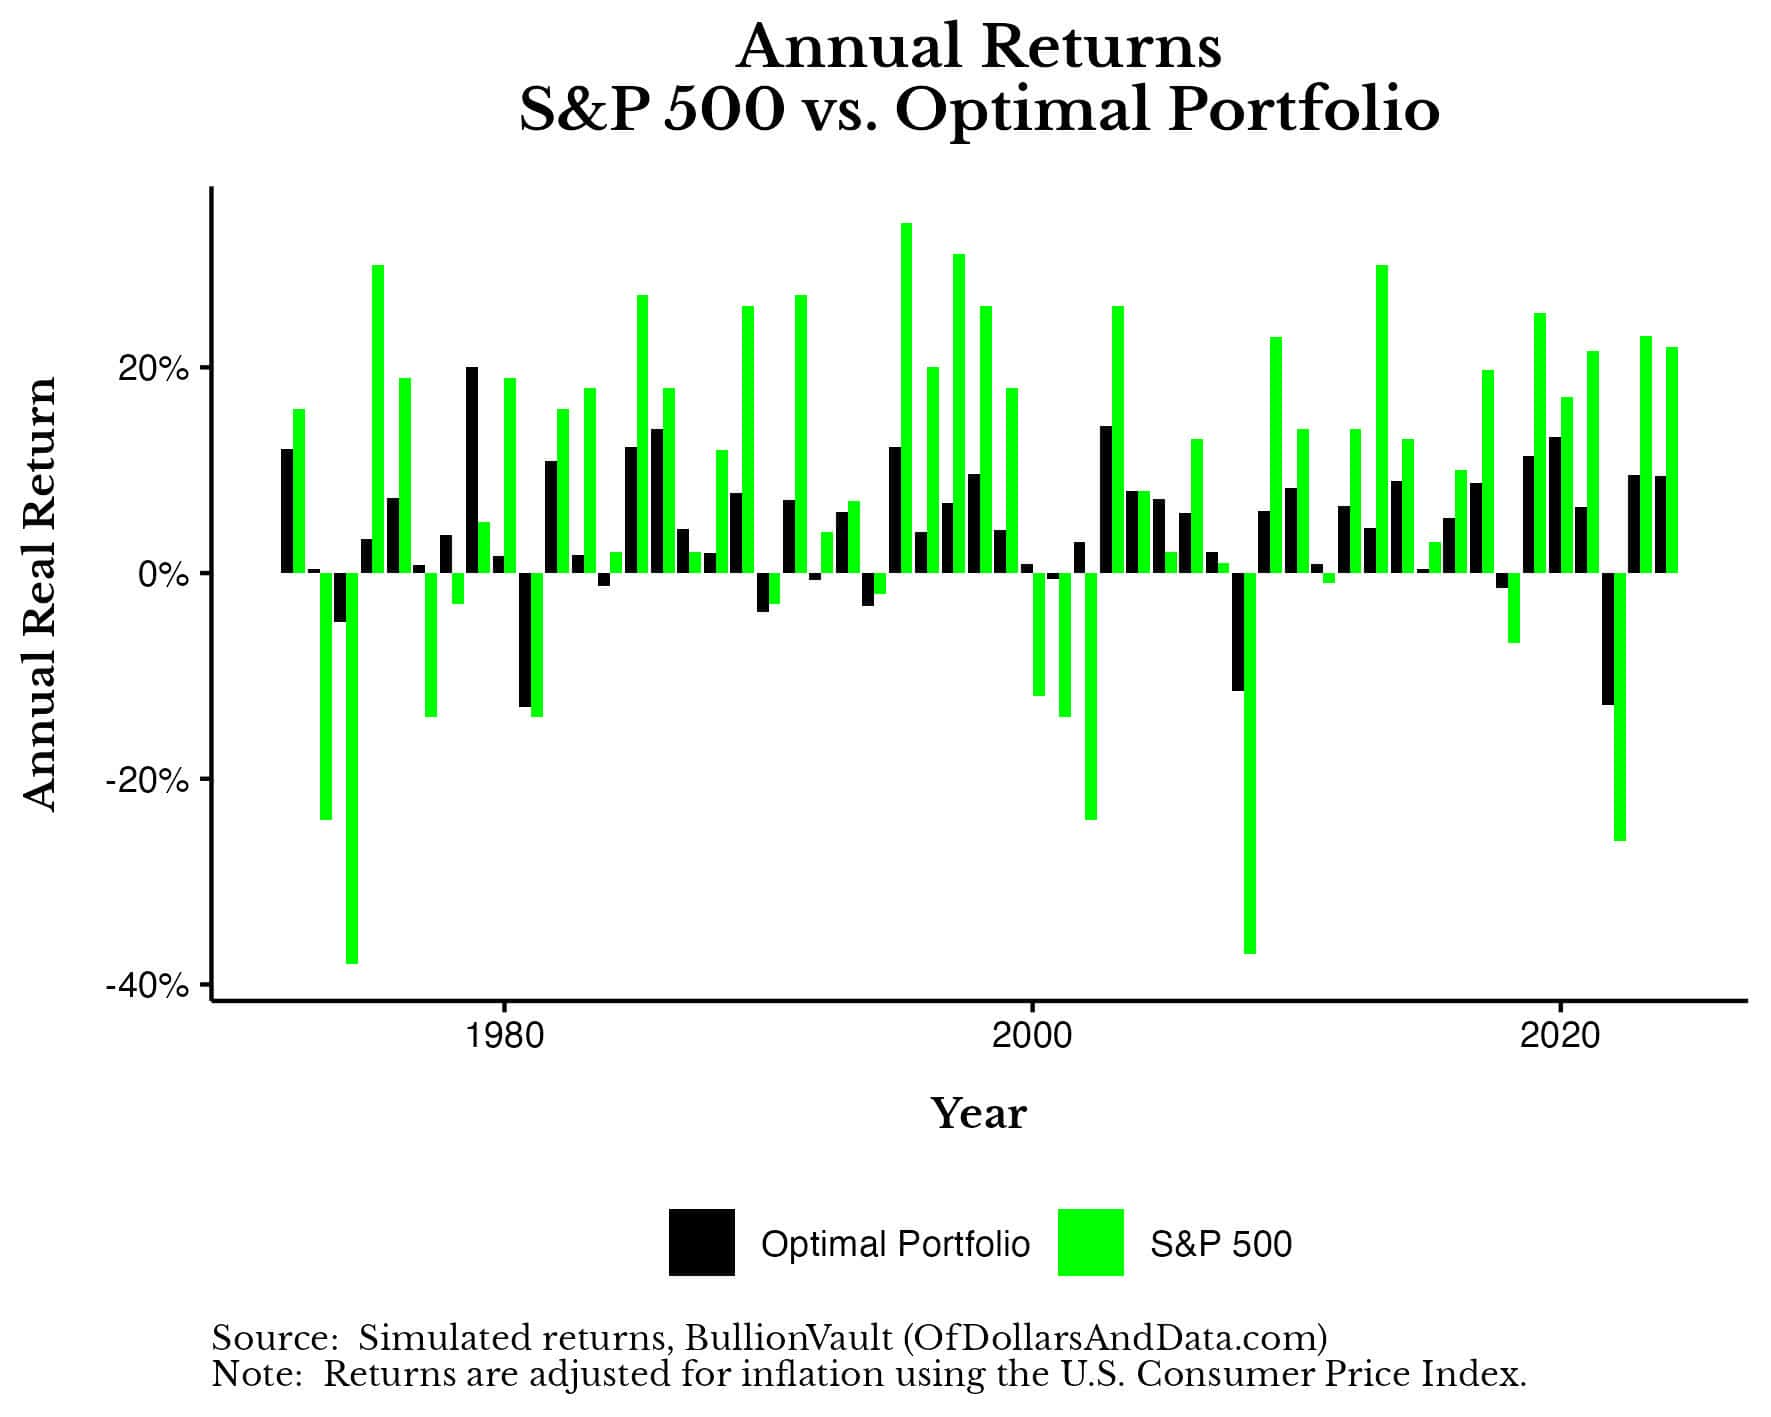
But this doesn’t imply that the Optimal Portfolio is perfect. Not at all. In fact, it still loses money in about 25% of all years:
Think about this. Even when you have the best portfolio possible for a given time period (i.e., the Optimal Portfolio), you should still expect to lose money about once every four years (on average). That might seem crazy but it’s true.
But underperformance and occasionally losing money are just the tip of the iceberg. The real mental challenge of holding a diversified portfolio is watching some of your asset classes underperform almost every year. Using the five asset classes from the Optimal Portfolio above, I’ve plotted the number of asset classes (out of five) that lost money in every year from 1972-2024:
As you can see, losing money somewhere in your portfolio is the norm. There were only 7 years (out of 53) where none of the assets in the Optimal Portfolio lost money. This goes to show that underperformance and losing money in some part of your portfolio are to be expected when you are diversified.
Now that we’ve looked at how diversification performs in the best case scenario, let’s wrap things up by looking at the benefits of diversification and the price we must pay to get them.
The Bottom Line (The Price of Peace)
Diversification isn’t about return, it’s about risk. It’s about smoothing out the financial ride over your lifetime. You know this already. That’s the easy part.
The hard part is sticking with it even as you underperform in most years. As Brian Portnoy brilliantly stated, “Diversification means always having to say you’re sorry.”
And it’s true. Most of the time you will feel sorry that you didn’t do as well as your best asset class. You’ll feel sorry that one (or more) of your positions lost money. And so forth.
But this is to be expected. This is what we pay for the benefits of diversification. This is the price of peace.
But, don’t you think it’s worth the cost? Wouldn’t you prefer frequent paper cuts over an infrequent amputation? I know I would. That’s what diversification gets you.
If you weren’t diversified going into this downturn, there’s not much you can do now to undo the damage. However, there’s a lot you can do to prevent such a mistake from occurring again in the future.
Until then…happy investing and thank you for reading!
If you liked this post, consider signing up for my newsletter.
This is post 446. Any code I have related to this post can be found here with the same numbering: https://github.com/nmaggiulli/of-dollars-and-data


