There is a great line by Donald Rumsfeld about the knowledge of knowledge(paraphrasing, emphasis mine):
There are known knowns; things we know we know. There are known unknowns; things we know we do not know. But there are also unknown unknowns — things we don’t know we don’t know.
In investing, its the unknown unknowns that get people in the most trouble. More specifically, I want to discuss how unknown unknowns can cause diversification to fail and how you can use this information to prepare for the next crisis.
To start, let’s talk about diversification.
Investopedia defines diversification in the following way (emphasis mine):
Diversification is a risk management technique that mixes a wide variety of investments within a portfolio.
Diversification strives to smooth out unsystematic risk events in a portfolio so the positive performance of some investments neutralizes the negative performance of others. Therefore, the benefits of diversification hold only if the securities in the portfolio are not perfectly correlated.
This last sentence is what I have a problem with. It’s not that this last sentence isn’t true, but that it is hard to determine whether it is true beforehand.
After an event occurs, it is easy to tell whether you were diversified, but doing so before an event is not as easy.
To examine this, let’s walk through an example using the Bullion Vault U.S. Asset Performance data. This data contains the annual real (i.e. inflation adjusted) returns on 9 different asset classes from 1976–2016.
To start, I have plotted the real return rank for international stocks (left) and the S&P 500 (right). You will see that in some years international stocks performed better (i.e. higher rank) than all other assets and in some years the S&P 500 performed better, but not always at the same time:
By buying both the S&P 500 and international stocks, you would have technically increased your diversification. However, to get a better understanding of your true level of diversification you need to calculate the correlations between the assets you own.
The correlation will tell you when one asset goes up (or down) in price whether another asset goes up (or down) in price. Assets that move together are said to be positively correlated and those that move in different directions are negatively correlated. To visualize correlations, I created a network plot of 8 of the 9 different assets (sorry commodities). Each circle in the network represents one asset.
The lines between the circles correspond to the correlation of real returns between the assets over the period listed. Note the following information:
- Red lines = stronger positive correlations (they move together)
- Blue lines = stronger negative correlations (they move in opposite directions)
- No lines = low to no correlation (i.e. the correlation is between -0.5 and 0.5)
- Thicker lines correspond to larger correlations (i.e. closer to 1 or -1).
For this first network plot, let’s look at the time in the years before the financial crisis of 2008 (i.e. this is a sample of information that investors could have had before the financial crisis):
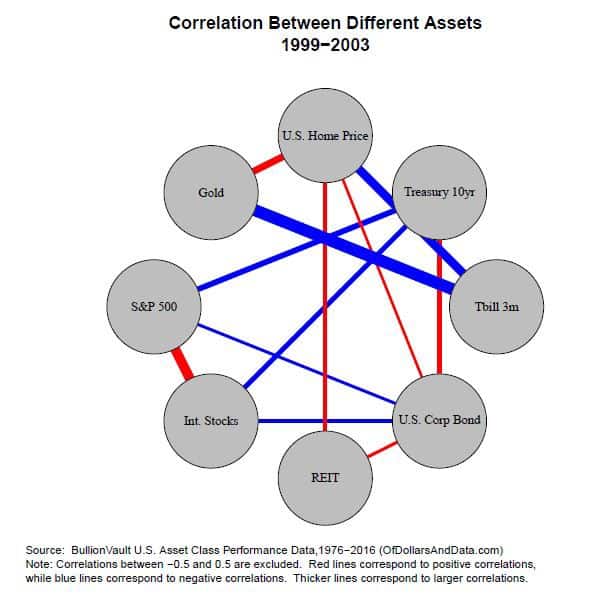
As you can see, the S&P 500 had a positive correlation with international stocks, a low correlation with REITs, 3m T-bills, Gold, and U.S. homes, and a negative correlation to U.S. corporate bonds and 10 year Treasury bonds.
This means that, an investor could have come to the conclusion to have a portfolio that included the S&P 500, REITs, Gold, U.S. Corporate bonds, and 10 year Treasury bonds.
This portfolio would not have a high correlation between its assets (as of 2003) and would be diversified.
Let’s now fast forward to the financial crisis. If we look at the 5 year correlation covering the 2007–2011 period, we see a far different picture:
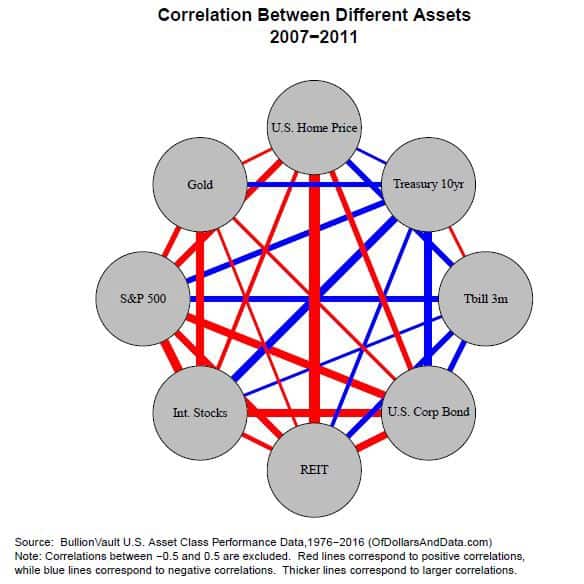
This is where certain kinds of diversification, though usually helpful, would have failed.
As you can see, every asset besides 3m T-bills and 10 year Treasury bonds became positively correlated at the same time.
Our hypothetical investor in 2003 would have only had safety in their 10 year Treasury bonds while all other assets lost value in the crisis. The problem is that correlations trend to 1 during panics.
When all hell breaks loose, anything that is risky tends to lose value as investors flee to safe assets. This is not necessarily a new idea, but one that many investors ignore.
A perfect example of this is told in When Genius Failed: The Rise and Fall of Long-Term Capital Management (LTCM). LTCM was a fund put together by 2 Nobel prize winning economists and handful of successful bond traders on the premise of making leveraged bets on bond spreads in many different markets around the world.
Their computer models showed that they were diversified because they had exposure to many individual markets that they assumed were uncorrelated with one another. However, when a crisis struck international markets in late 1998, the correlations between their many bets went to 1 and they lost almost all of their capital in a matter of weeks.
How to Prepare for the Next Crisis
We don’t know what the future holds, but there are ways to prepare yourself for whatever the investment world throws at you:
- Always make sure to have at least 10–20% of your net worth in riskless assets, even if you are young. I suggest holding much more than 20% in riskless assets as you age, but this is completely up to you and your risk preferences.
If you are a millennial you might be thinking, “haven’t U.S. bonds never outperformed U.S. stocks over any 30 year period? Therefore, why should I own any bonds while I am young?”
That is correct, but there is nothing guaranteeing that stocks will outperform bonds over the next 30 years. Even if short term bonds underperform stocks, having safe assets during downturns will provide more psychological comfort than the additional gains of owning more stocks.
Or, as I once read on the Bogleheads forum:
Stocks let us eat well while bonds let us sleep well
- Risk is a concept that is linked to time. Things that seem less risky now, may not be less risky later. I would consider U.S. Treasury bonds/bills riskless, as would most other investors, but what if we are wrong?
This could be an unknown unknown. Though short term U.S. Treasury bills are riskless to me, the post apocalypse community may think otherwise. They hedge this risk by owning canned goods and hidden underground shelters.
I am not saying that you should do this, but realize that risk is relative to what time period you are looking over. In the next week, U.S. T-bills are riskless, but over the next century, not so much.
I understand the irony of my recommendations above. How can I tell you to buy riskless assets when I cannot say with 100% certainty what is riskless? This is a problem that no one can get around (i.e. the unknown unknown), but this doesn’t mean we can’t make reasonable assumptions and buy U.S. treasury bonds/bills, which have historically been a safe bet.
There are many other unknown unknowns I wish I could tell you to look out for, but then again how would I know? How would anyone know? Thank you for reading!
If you liked this post, consider signing up for my newsletter.
This is post 22. Any code I have related to this post can be found here with the same numbering: https://github.com/nmaggiulli/of-dollars-and-data

