Last week the yield curve inverted for the first time since August 2019. For the uninitiated, a yield curve inversion occurs when the interest rate paid on short-term debt exceeds the interest rate paid on long-term debt of the same quality. Typically, this occurs when 2-Year U.S. Treasuries are paying more than 10-Year U.S. Treasuries.
Why do investors care when the yield curve inverts? Because yield curve inversions have been a pretty reliable indicator of a coming recession. The chart below plots the 10-Year U.S. Treasury rate minus 2-Year U.S. Treasury rate (in blue) along with when the U.S. was in a recession (in gray):
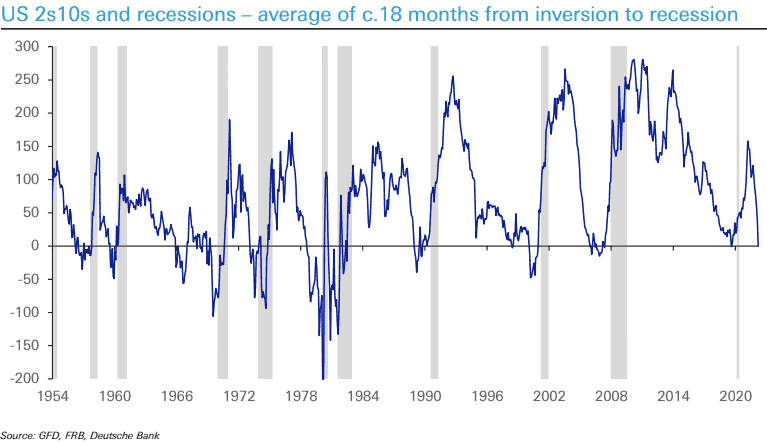
As you can see, nearly every time the yield curve has inverted (i.e. the blue line has gone below zero), a recession has followed within the next few years.
But just because a recession may occur within the next 12-24 months, does that mean that U.S. stocks will underperform? Let’s dig in.
Do Stocks Perform Worse Following a Yield Curve Inversion?
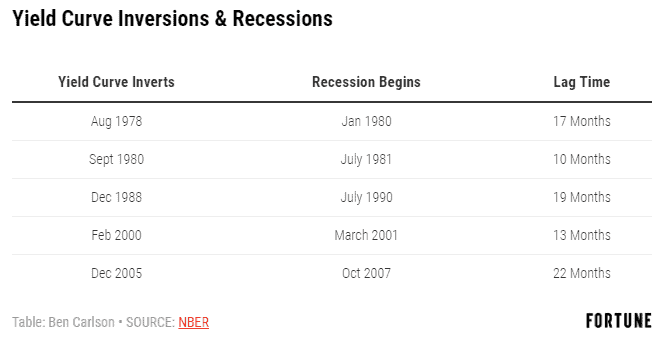
Since 1978 there have been 6 inversions of the yield curve (excluding the one from last week). Ben Carlson wrote a great article on this, which lists 5 of these inversions and when the U.S. economy went into recession afterwards:
Given this information you might be wondering how U.S. stocks perform after a yield curve inversion. Long story short, not great.
If we look at the one-year performance of the U.S. stock market following a yield curve inversion, we can see that U.S. stocks didn’t do as well following an inversion (red) as they normally do (gray):
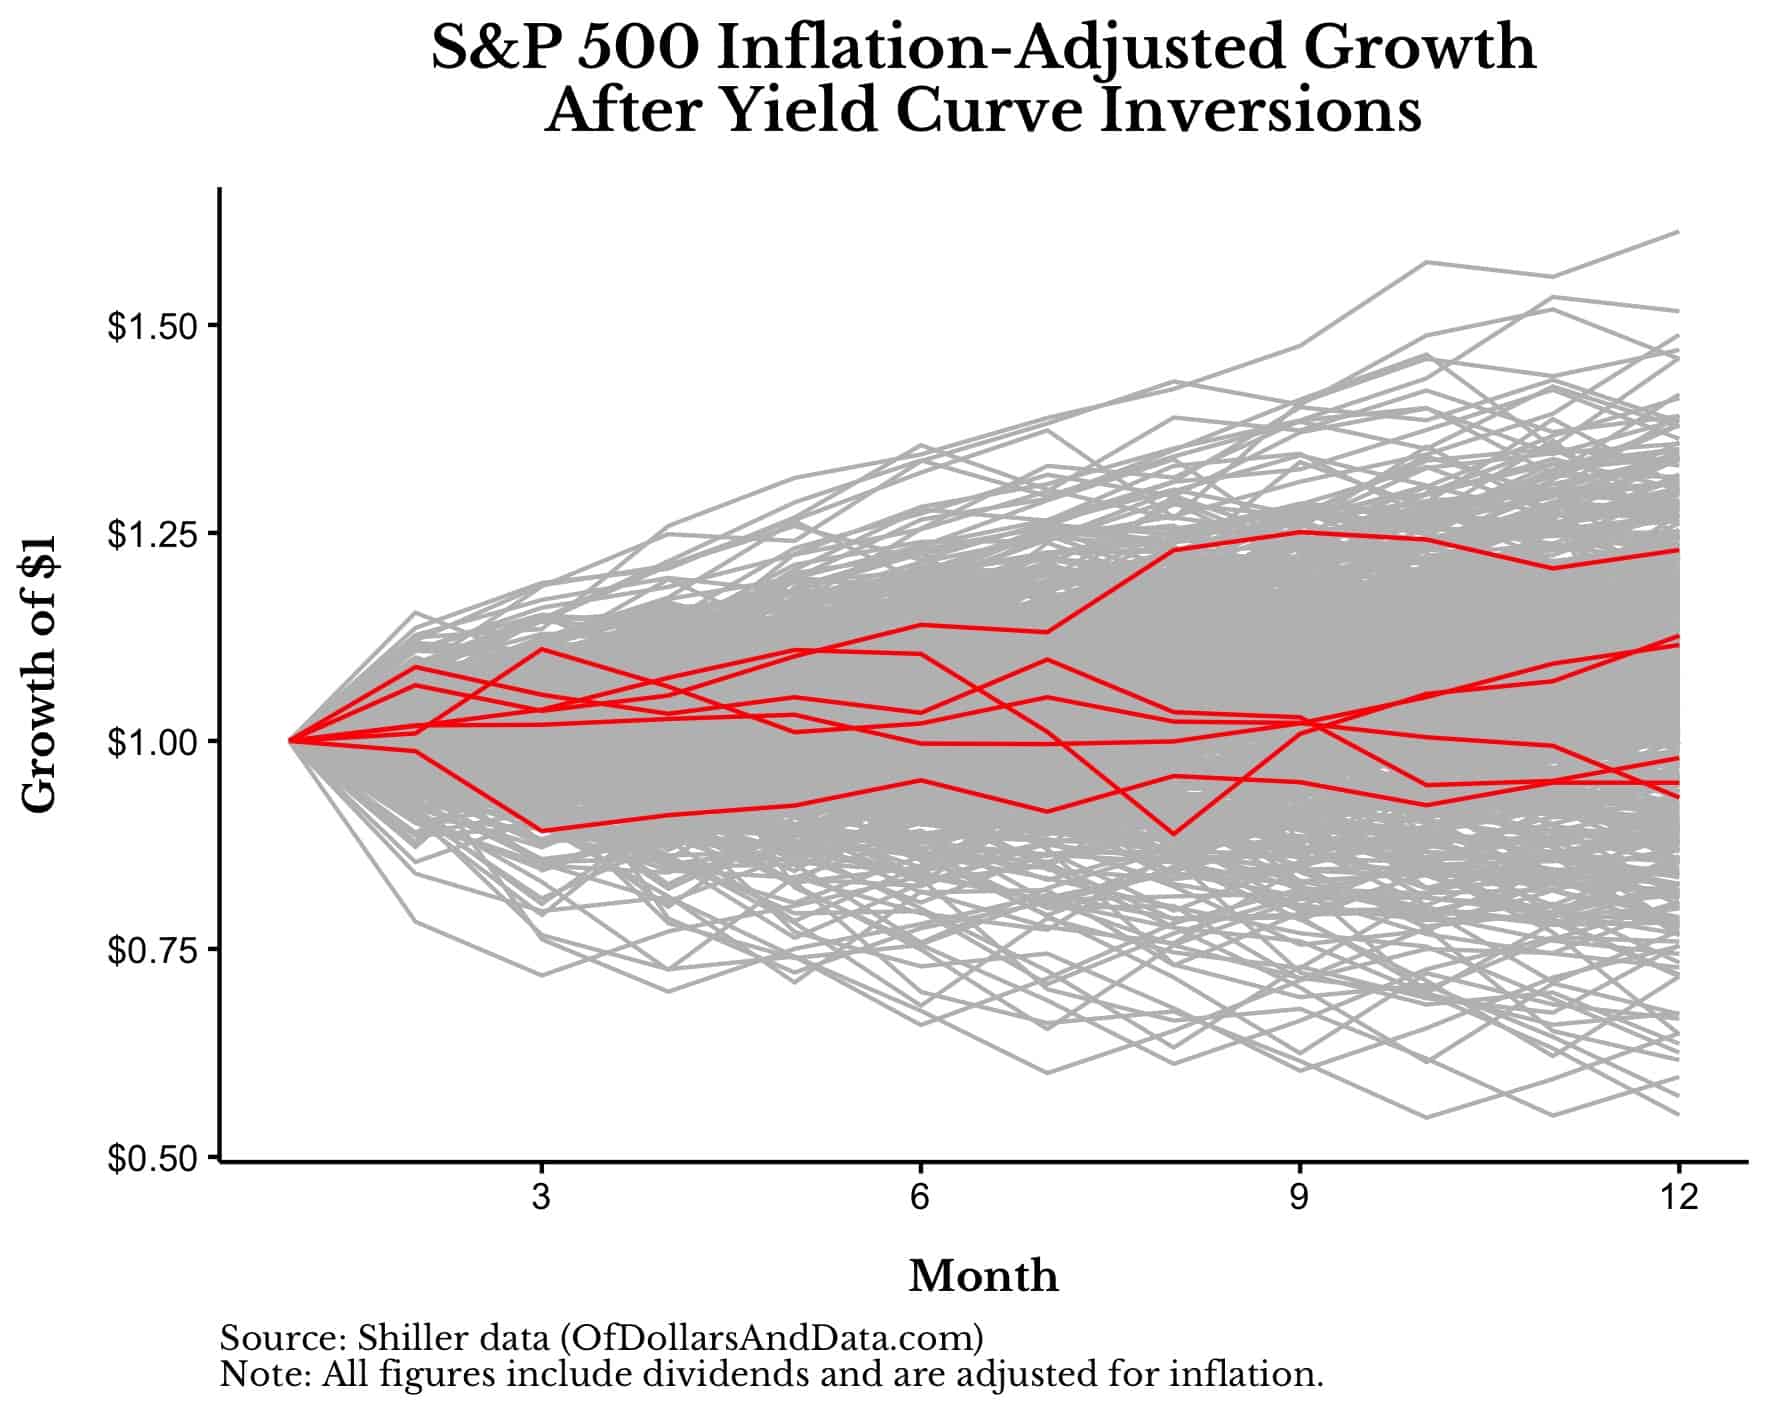
In particular, after a yield curve inversion, the median inflation-adjusted total return of U.S. stocks was 4.7% compared to 9.0% during all other one year periods. Of course, the number of yield curve inversions is low (N = 6), yet the point stands.
Unfortunately, even if we extend this analysis to go beyond one year, it doesn’t get much better. For example, in the two years immediately after an inversion occurred, the median return on U.S. stocks was 4% annually compared to 8% annually in all other two year periods. This suggests that a yield curve inversion is a decent indicator of a coming slowdown in market growth.
But what if we look over a longer time horizon? Does that change anything? Sort of, but not by much.
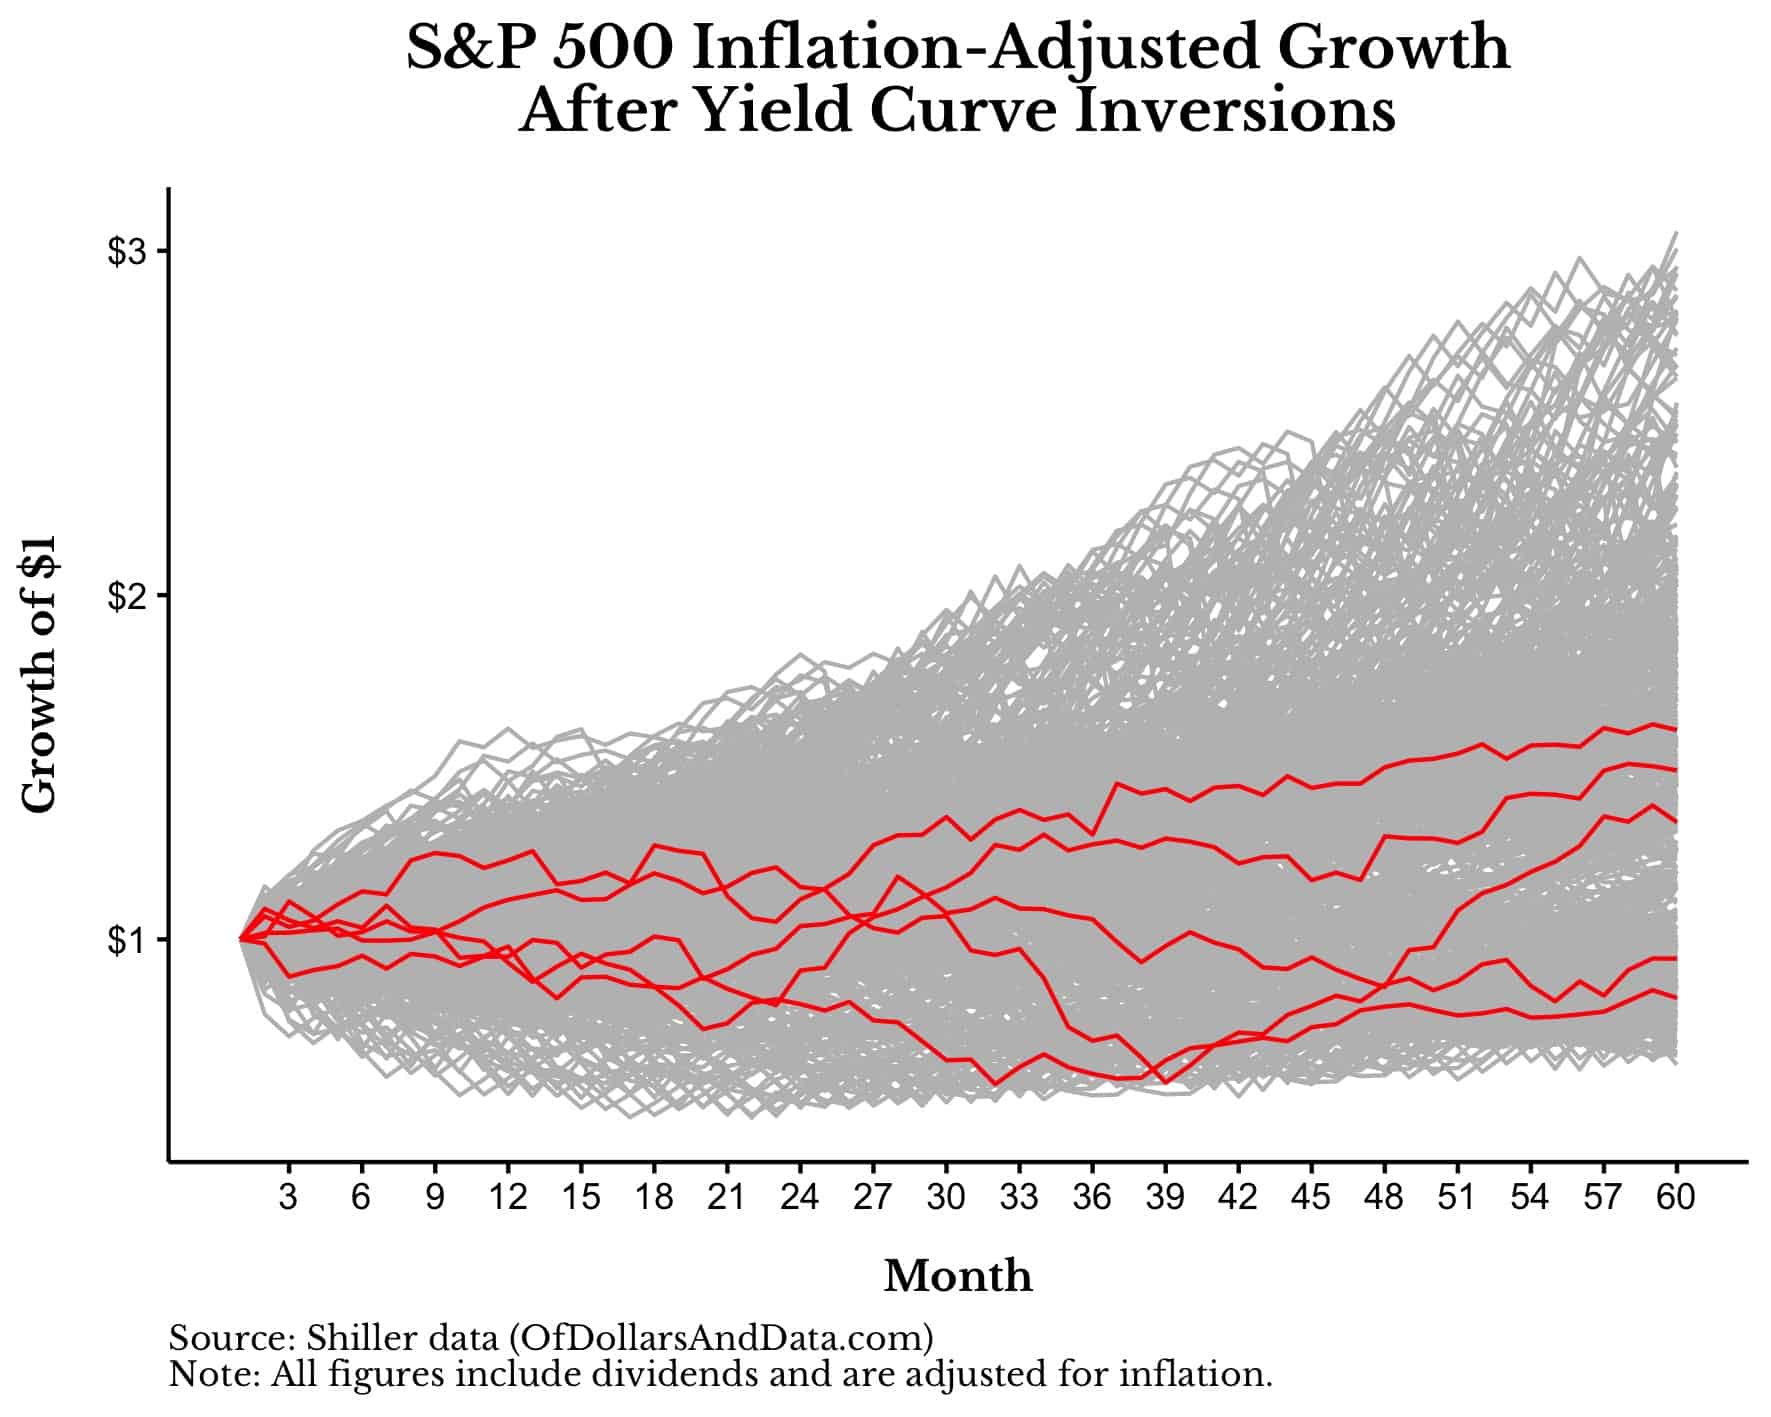
In the five years immediately after a yield curve inversion, the median inflation-adjusted total return on U.S. stocks was 6% annually compared to 8% annually in all other five year periods. As you can see in the chart below, yield curve inversions aren’t great for U.S. stocks even over a five year period:
After seeing data like this it might seem like a no brainer that investors should abandon U.S. stocks every time after the yield curve inverts. But it’s not that simple.
One counterpoint is that yield curve inversions may no longer be a useful indicator. For example, the yield curve last inverted in August 2019, yet U.S. stocks are up 68% since. If you had moved to cash at that time you would have missed out on a lot of upside.
The second issue with trying to make tactical changes based on the yield curve is that, there may not be any better alternatives.
When the Yield Curve Inverts, Move to Bonds…Right?
Given the data above, it is clear that, generally, U.S. stocks perform worse following a yield curve inversion than most other historical periods. Therefore, the obvious thing to do following an inversion is to sell out of your U.S. stocks and move to U.S. bonds, right?
Not so fast.
Though the data suggests that U.S. stocks will underperform their historical averages following a yield curve inversion, it also suggests that U.S. Treasury bonds are likely to underperform U.S. stocks after an inversion as well.
Going back to 1970, in the year after a yield curve inversion, U.S. stocks had a median inflation-adjusted total return of 4.7% while 5-Year U.S. Treasuries had a median inflation-adjusted return of 4%. Even if we were to extend this analysis to look over two or five years, we would find that 5-Year Treasuries still underperform U.S. stocks following a yield curve inversion.
But don’t just take my word for it. Consider what Eugene Fama and Kennth French concluded in a paper from July 2019:
We find no evidence that inverted yield curves predict stocks will underperform Treasury bills for forecast periods of one, two, three, and five years.
Given this information, what’s an investor to do?
Nothing.
Absolutely nothing.
The market gods have punished us and we can’t do anything about it. We can’t move to bonds because, as the data above suggests, U.S. Treasuries are likely to grow even more slowly than stocks in the intervening period. We can’t move to cash because cash won’t grow at all. So we just have to accept it.
On the other hand, it is possible that the yield curve inversion is no longer a useful indicator. As I mentioned above, stocks are up over 60% following the most recent inversion in August 2019. If that ends up being true, moving to bonds or cash are likely to be an even worse choice.
So the only real course of action is…inaction. Ignore it. Go on about your life and let markets do what they are going to do. I know how unsatisfying this answer is given the coming slowdown that is likely to occur. But, unless you have another way to generate high returns during such a slowdown, you are out of luck. We all are.
But that’s how markets work sometimes. The rising tide lifts all boats and then the falling tide reveals who has been swimming naked. Don’t get caught naked. Stay the course, Just Keep Buying, and let the chips fall where they may.
Thank you for reading!
If you liked this post, consider signing up for my newsletter.
This is post 288. Any code I have related to this post can be found here with the same numbering: https://github.com/nmaggiulli/of-dollars-and-data

