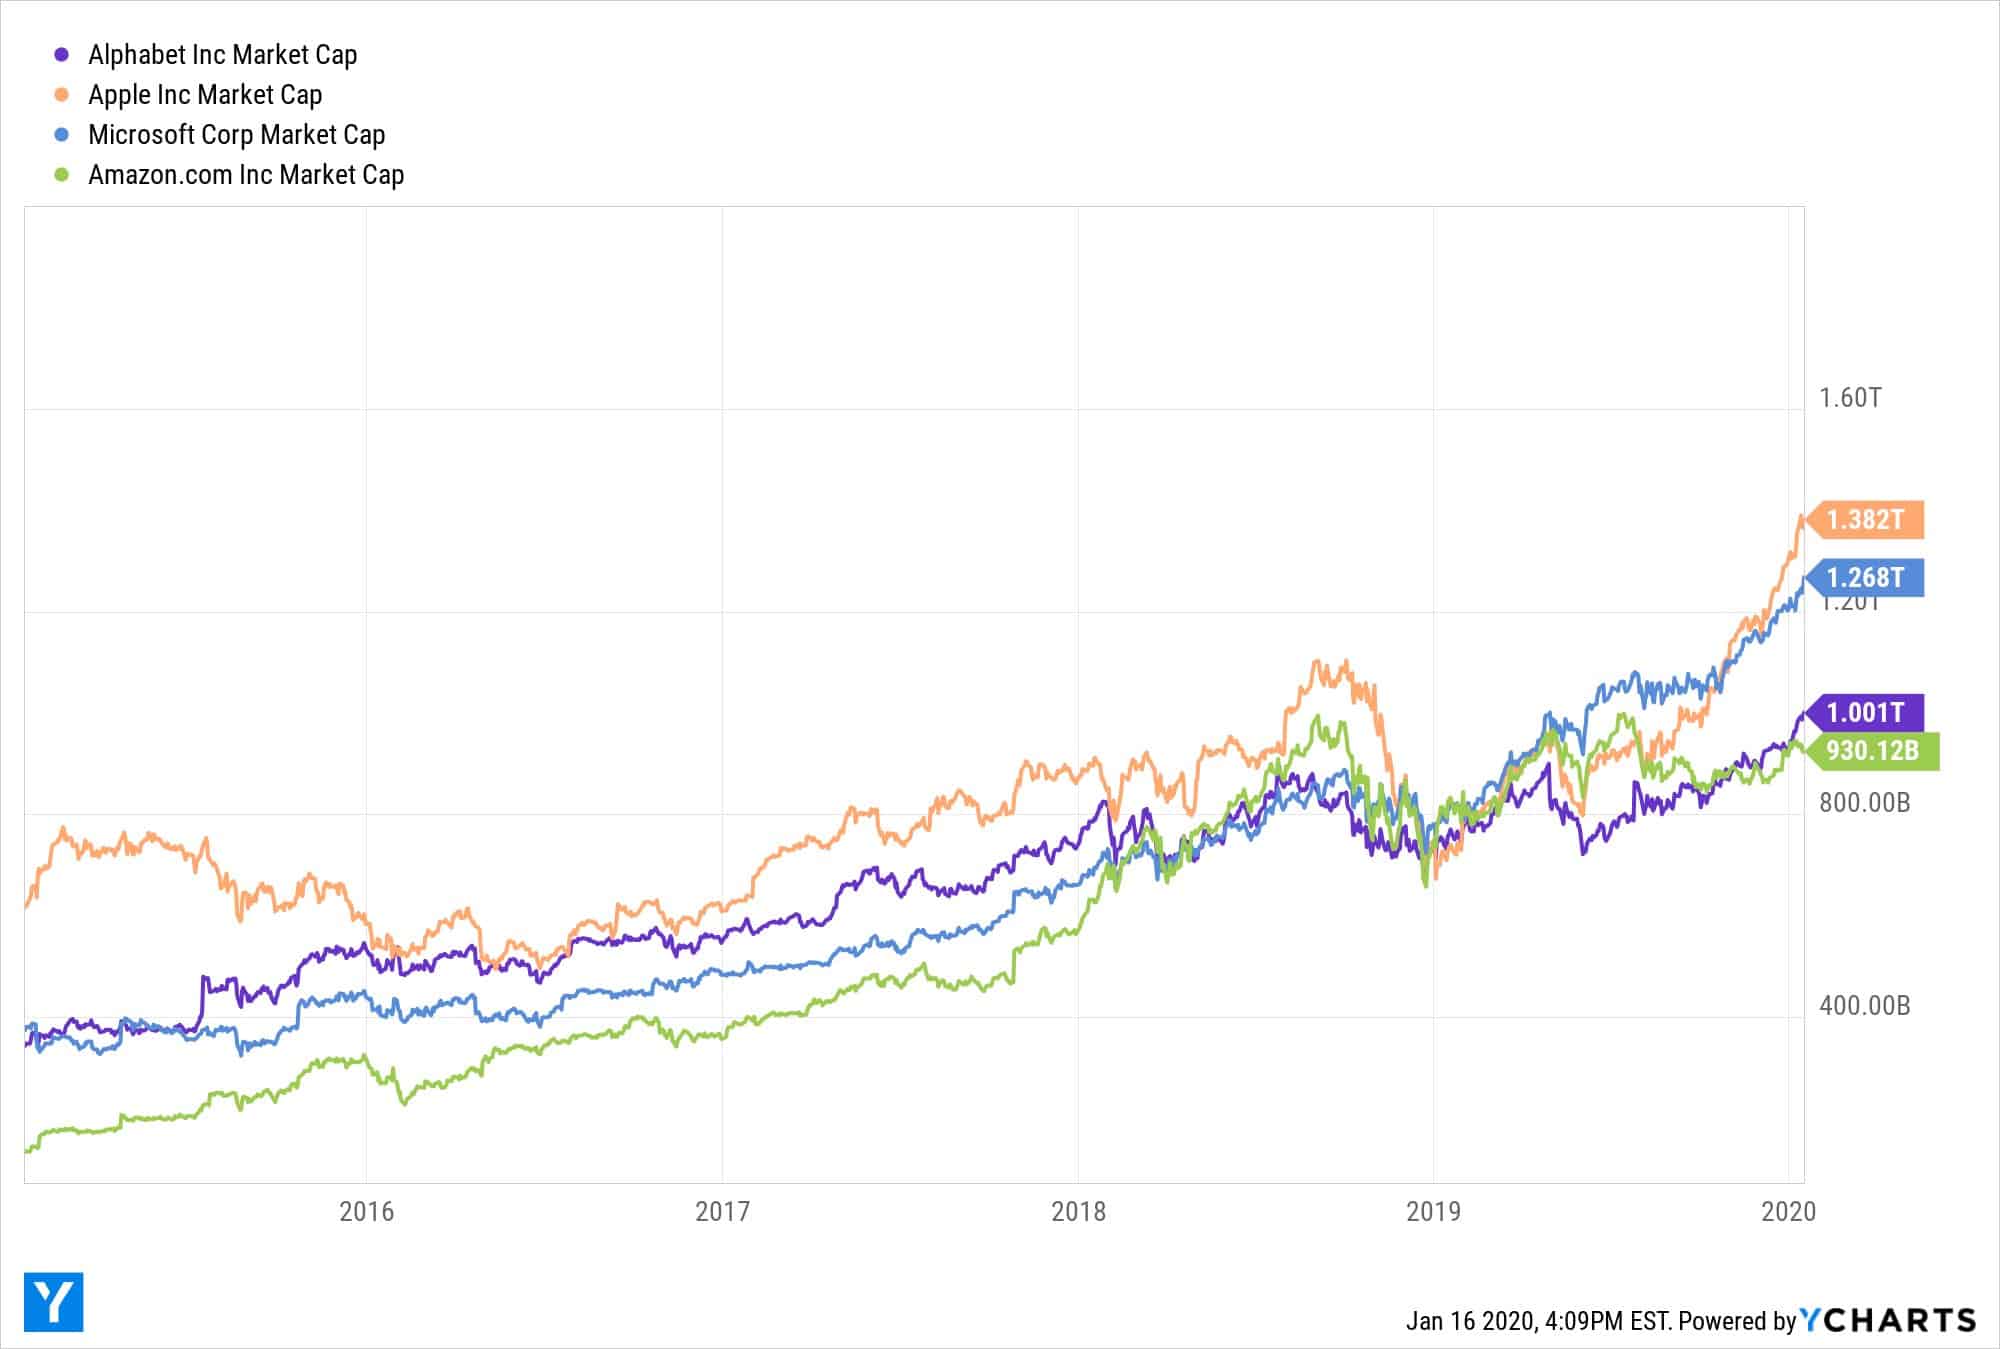
Last week, Alphabet Inc. (Google’s parent company) surpassed $1 trillion in value for the first time ever. Following the likes of Apple, Amazon, and Microsoft, Alphabet becomes only the 4th U.S. company in history to join the four comma club (note: Amazon has since been demoted to the almost four comma club):
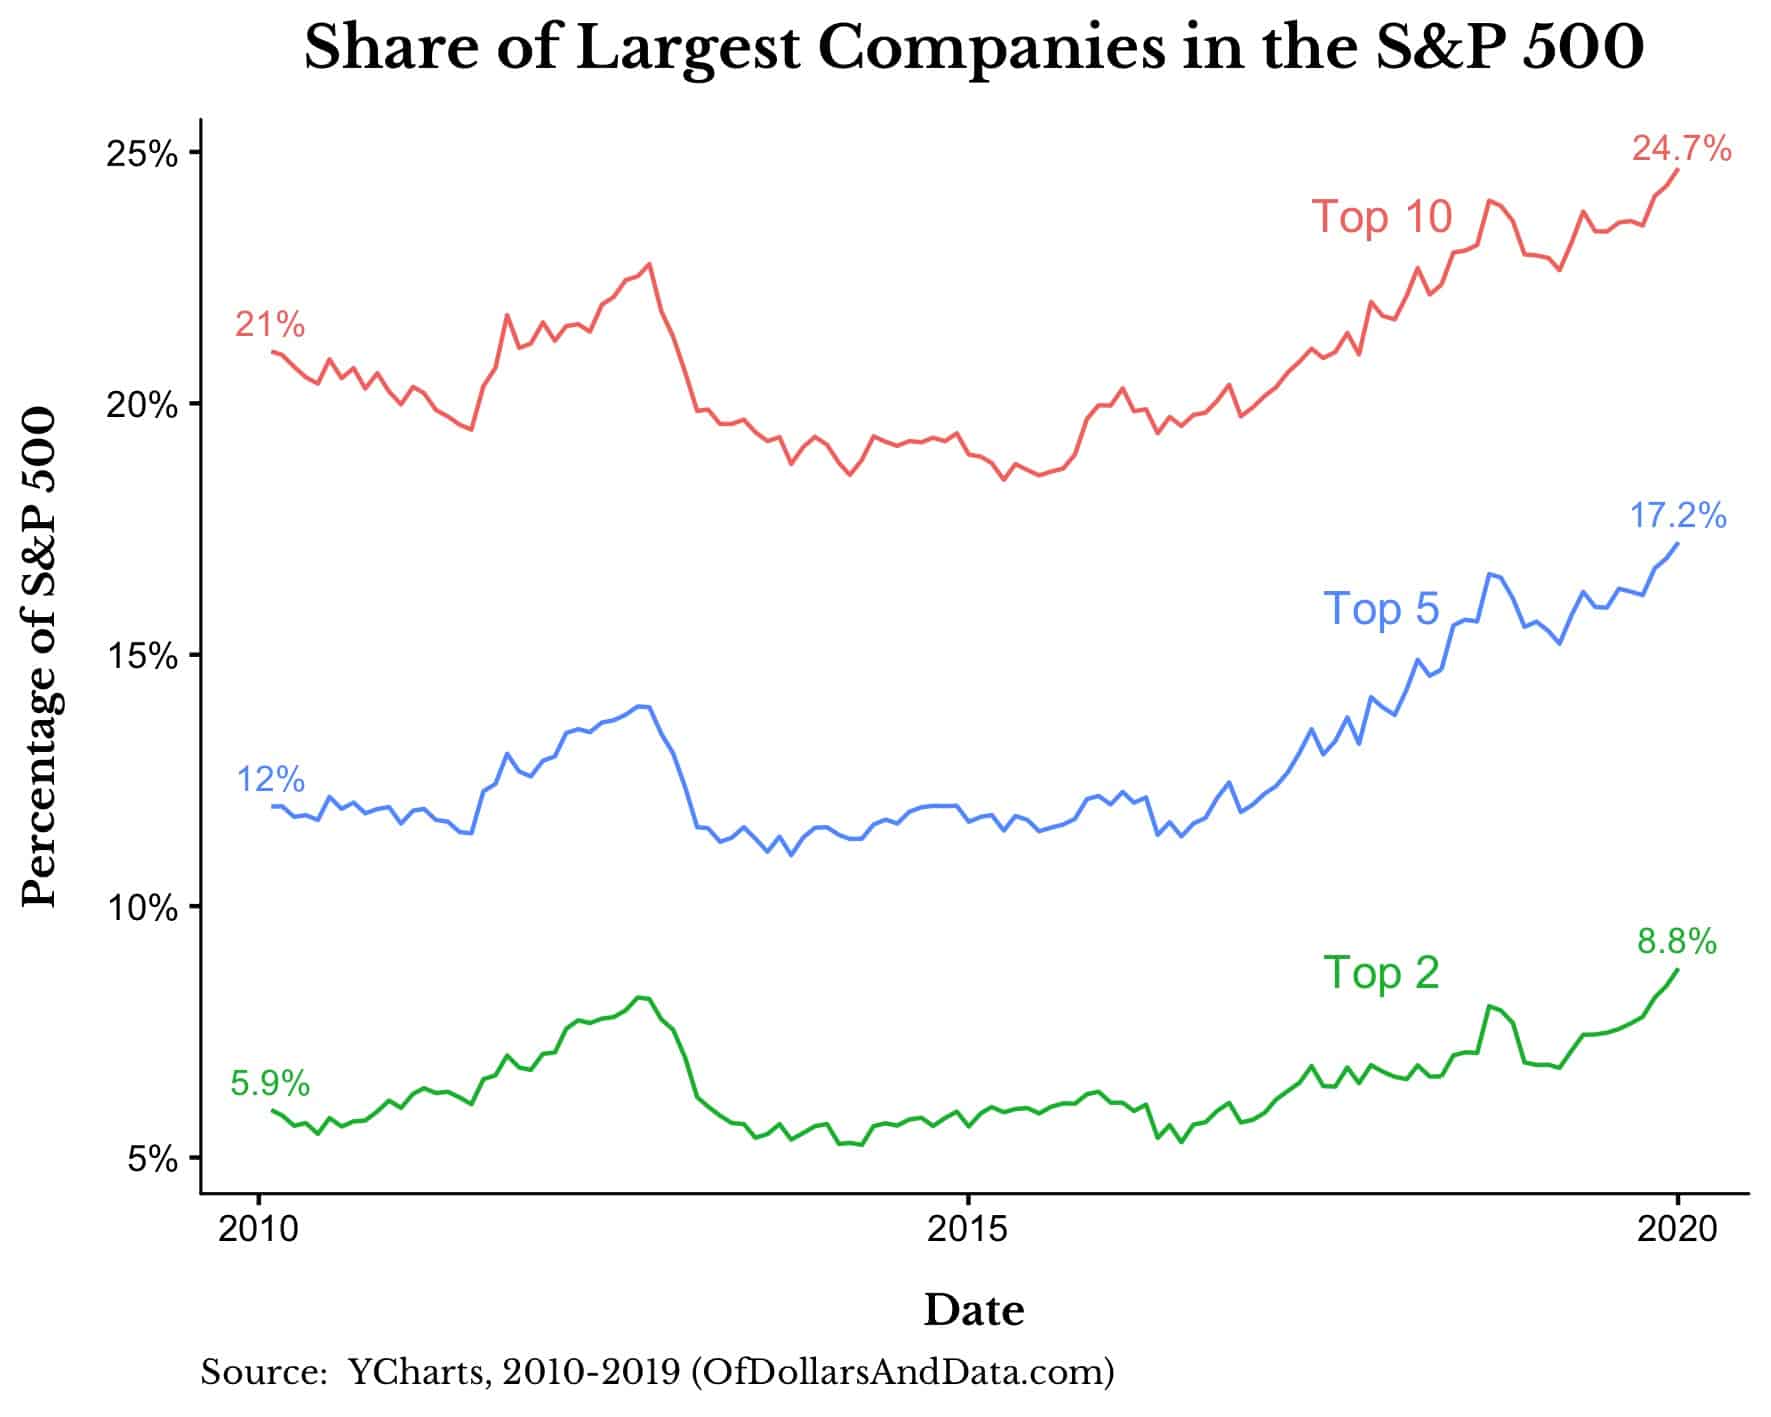
What makes the growth among these companies even more remarkable is that it has been happening at a faster rate than the rest of the stock market. For example, if you look at the share of the largest 2, 5, or 10 companies in the S&P 500 since 2010, you can see this trend emerge quite recently:
Now, I understand that the biggest companies aren’t the same year to year, but if you look at the top 10 companies in the S&P 500 from 2010 to 2019 you may notice a pattern [Note: the blue bars are Facebook, Apple, Amazon, Microsoft, and Google (“FAAMG”) and the numbers listed below are in billions of dollars]:
We can plot the share of the S&P 500 represented by these FAAMG stocks since 2010 to get a clearer picture of their overall growth within the S&P 500:
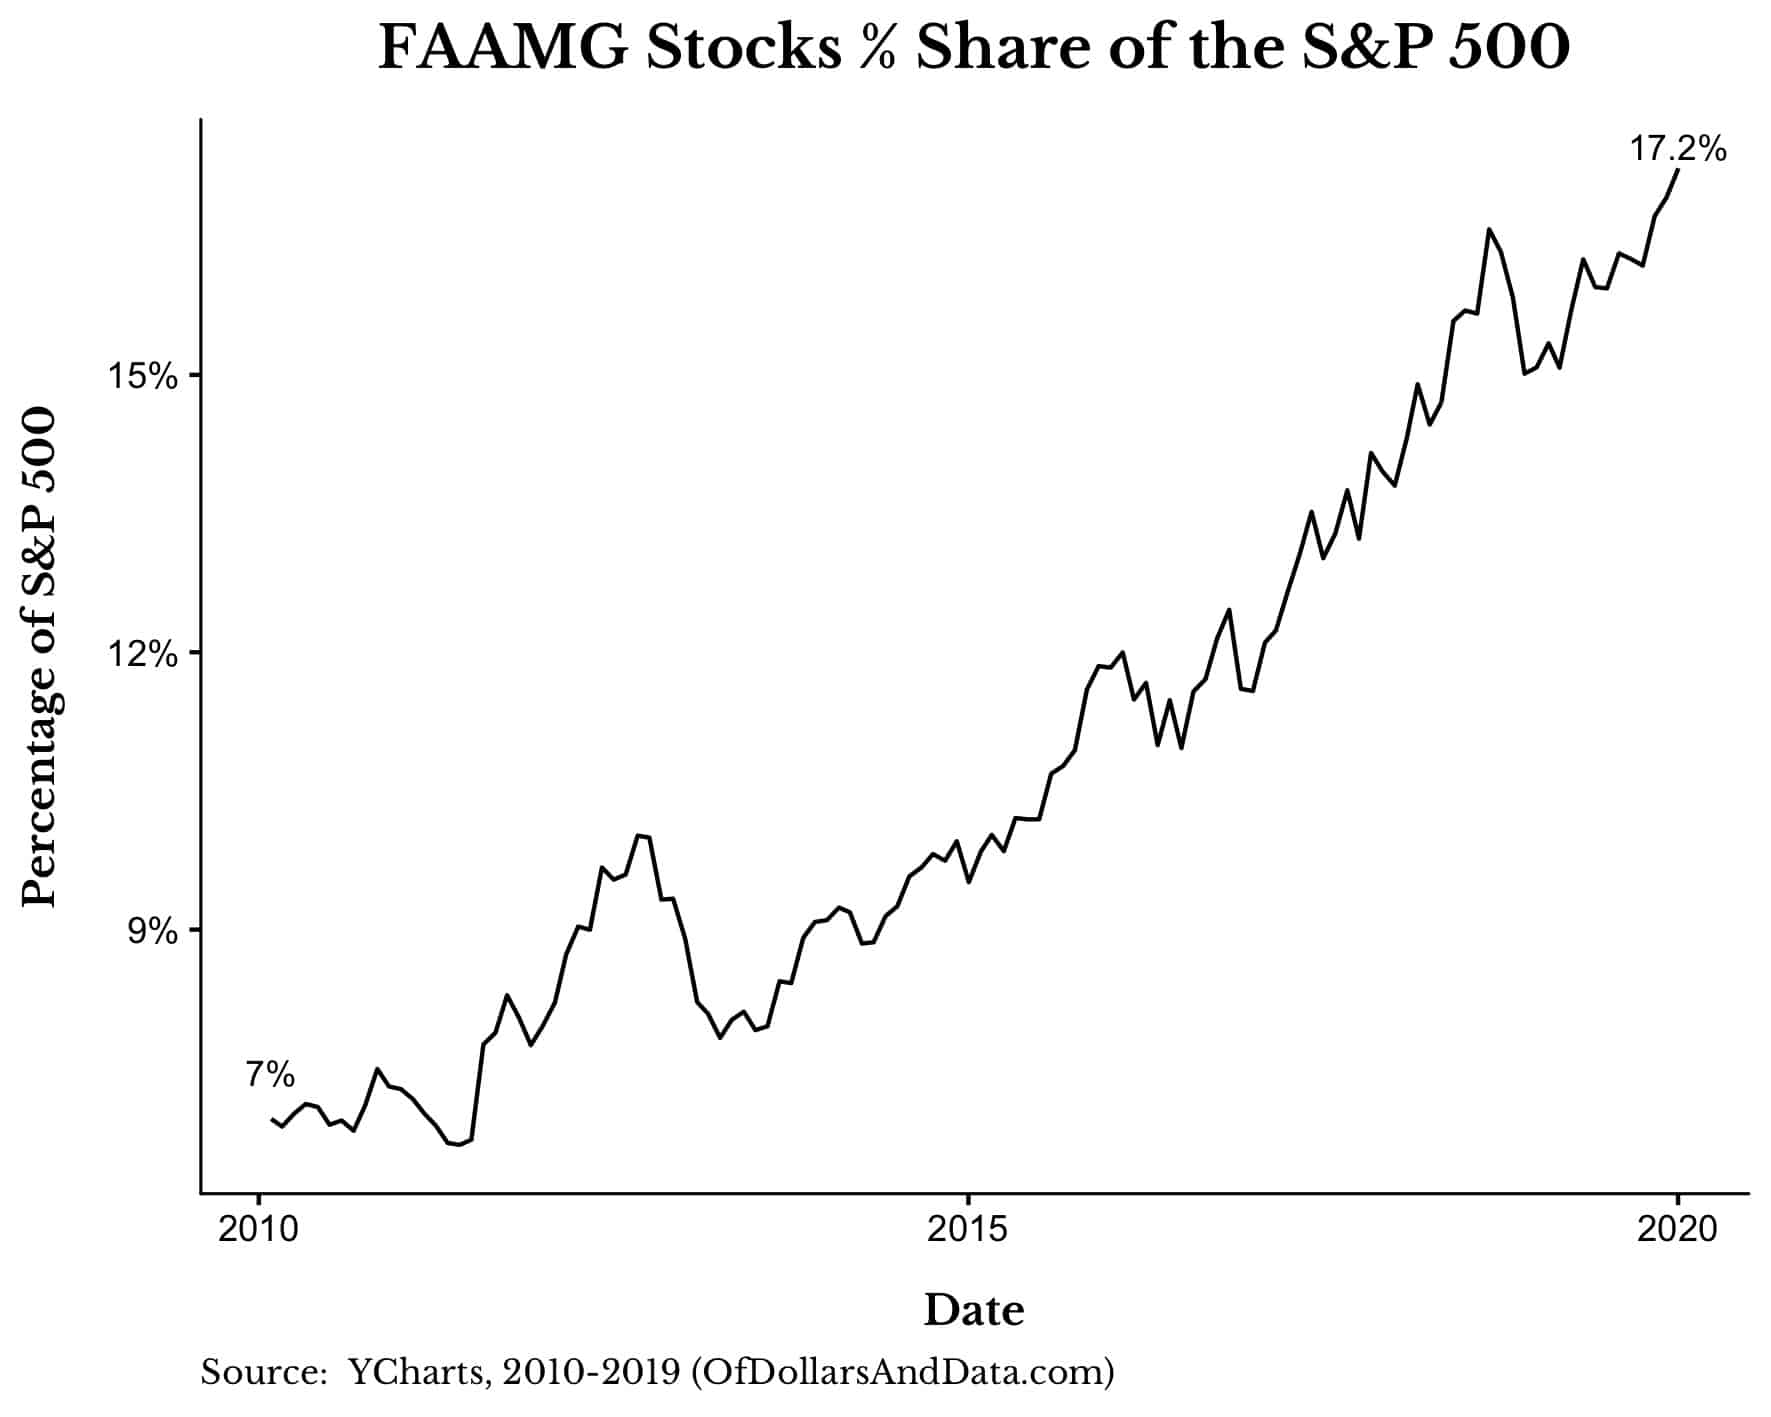
As you can see, over the last decade the FAAMG stocks have increased their share of the S&P 500 from 7% to 17%. These tech giants, which used to be valued at $650 billion in 2010, are now worth nearly $5 trillion, or 7.6x more. Over this same time period, the S&P 500 increased in value from $9 trillion to $29 trillion, or only 3.1x more.
With trends like this you start to wonder whether big tech has gotten too big. Should these companies be regulated or broken up? Has Marc Andreessen’s bold 2011 prediction come true? Is software eating the world?
This is not a new narrative, but one I have started to notice more and more, especially within financial circles. For example, the most recent piece from Research Affiliates lists “technological revolution” as one of the possible reasons why value stocks have underperformed growth stocks for such an extended period of time. They state:
In the last decade, we have witnessed the emergence of the vast digital sector, which has driven many longstanding brick-and-mortar companies out of business. The recent success stories of the FANMAG stocks are captivating. These US-based tech companies are collectively vastly profitable. The combined capitalization of the FANMAG stocks was US$5.07 trillion at yearend 2019, exceeding the capitalization of every stock market in the world except for those of the United States and Japan. This narrative suggests that in the presence of technological revolution the disruptive new technological leaders can drive outsized monopolistic profits, while the old brick-and-mortar value companies are choked into irrelevance.
Based on what I’ve seen happening in the labor market over the last 5 years, I would have to come to a similar conclusion. For example, nearly all of the people from the first company I ever worked for ended up being poached by a big tech company. Facebook, Google, Amazon, Apple, and Uber were the places to go, and all of the smartest people I knew were going there. These companies have increased their MBA hiring drastically in recent years and are generally becoming more difficult to compete with in the labor market. If you don’t believe me, just consider how the median employee compensation at Facebook is $240,000 a year.
What does it mean for a society when many of the most technically-skilled people end up at a handful of companies? And what does it mean if these companies continue to get larger and amass more resources which they then use to attract top talent to get larger and attract more resources…? More importantly, what does it mean when these companies’ actions are continually validated by investors through increased valuations? It sure feels like this time (or should I say climb?) is different….or is it?
A year and a half ago, Michael Batnick wrote about this issue when comparing the FAAMG stocks to the biggest companies during the late ’90s tech bubble. What he found was that though the growth of the FAAMG stocks seems high now, that growth isn’t outrageous when compared to what happened during the DotCom Bubble. And if we go back even further in time, we see that the share of the top 5 companies in the S&P 500 used to be much higher than it is currently (from Standard and Poor’s):
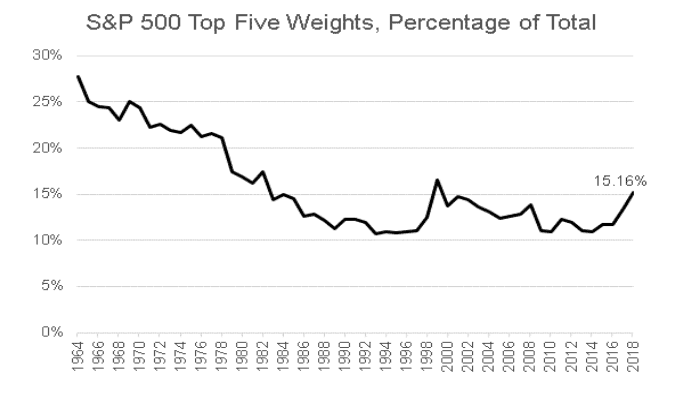
Today’s top 5 share of 17% seems average over this time period.
You might be wondering which companies were so large relative to the market in the 1960s and 1970s? As the table below from Research Affiliates illustrates, the answer is AT&T, General Motors, IBM, and Exxon:
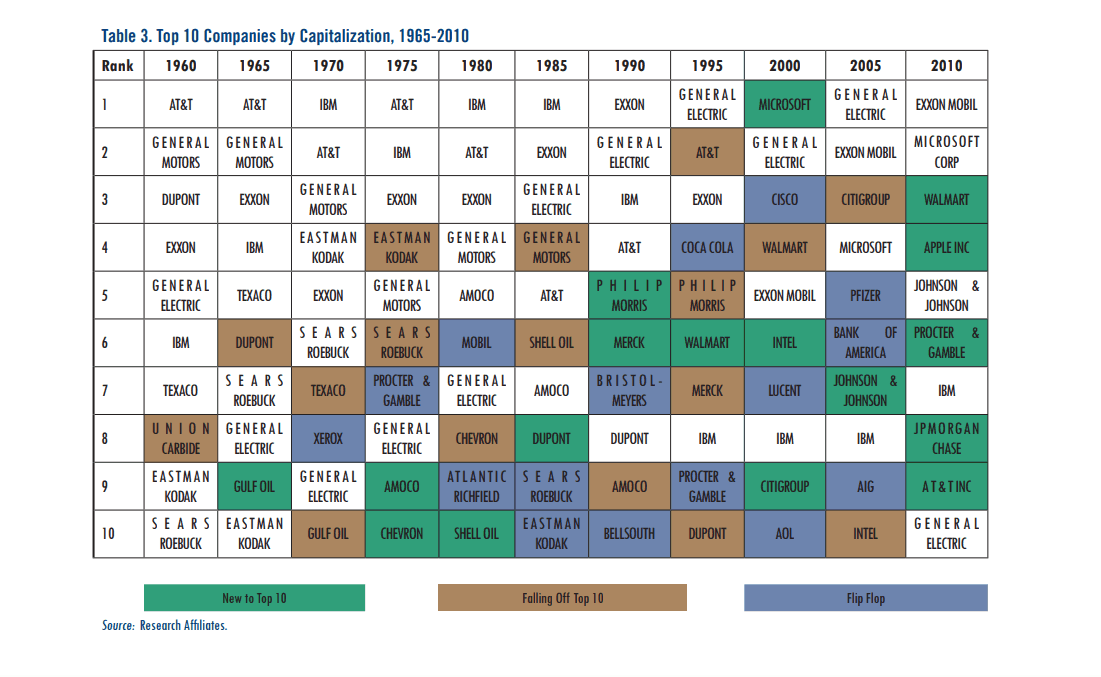
And while these four companies were on top half a century ago, today their combined market value is about $200 billion less than Amazon’s. This just goes to show that market dominance will eventually fade…
Nothing Lasts Forever
While I agree that big tech is eating the stock market, this isn’t something we should be alarmed about. This is just the nature of capital markets. Industries that dominated in one era (i.e. railroads) are supplanted by those in another era (i.e. gasoline/motor vehicles). This happens over and over again and will continue to happen in the future. It’s Joseph Schumpeter’s creative destruction ad infinitum.
And while I understand the sentiment behind believing in a FAAMG-dominated future, I am also a student of market history. And market history tells me that there have been many times when one company or another looked unstoppable. Right now, the FAAMGs are those companies.
But, in the future, they most certainly won’t be. Maybe it will happen in the next year, maybe in the next decade, or maybe in the next century. I don’t know. But, I do know that nothing lasts forever. As Geoffrey West noted in Scale: The Universal Laws of Life, Growth, and Death in Organisms, Cities, and Companies:
Of the 28,853 companies that have traded on U.S. markets since 1950, 22,469 (78 percent) have died by 2009.
And, more specifically he found that:
The risk of a company’s dying does not depend on its age or size.
Even the biggest companies will one day be on their way out. We all are, act accordingly.
Thank you for reading.
If you liked this post, consider signing up for my newsletter.
This is post 159. Any code I have related to this post can be found here with the same numbering: https://github.com/nmaggiulli/of-dollars-and-data

