This week I want to talk about compound interest, fractals, and how you can use them to make yourself rich. Before we get into the compound interest part of things, let’s first take a dive into fractals.
A fractal is a geometric object that displays symmetry at different scales (or levels of magnification). Therefore, if you were to visually zoom in on a fractal, you would see a pattern that was similar to the original (larger) object. The Sierpinski Triangle above is one of the most straightforward ways to explain fractals as the outside triangular pattern repeats infinitely within itself.
The thing about fractals is that they are found almost everywhere in nature. Trees, coastlines, veins, and many other natural objects display fractal properties. One of my favorite fractals is Romanesco Broccoli:

So, you might be wondering:
How can fractals make me rich?
Fractals themselves will not do anything for you, but understanding compound interest and how it behaves fractally can make you rich. To get started let’s consider a thought experiment.
Let’s say you decide to invest $100 and you have the ability to get a 10% annual rate of return. At the end of 1 year you will have your $100 in principal and an additional $10 in interest. Nothing special.
However, as you continue to compound your money, the process starts to behave fractally. How? In year 2, when your $100 once again gives you $10 in interest, now your $10 in interest from year 1 will throw off $1 in interest as well. The $10 has begun to behave like the $100 did in year 1.
You can imagine the relationship between the $10 and its $1 in interest like the $100 and its $10 in interest. And this process continues in year 3 when the $1 in interest from year 2 throws off $0.10 in interest, and so on.
The beauty of compound interest is that it continues to behave fractally with each piece of interest eventually earning its own interest. Money begets money and you get rich.
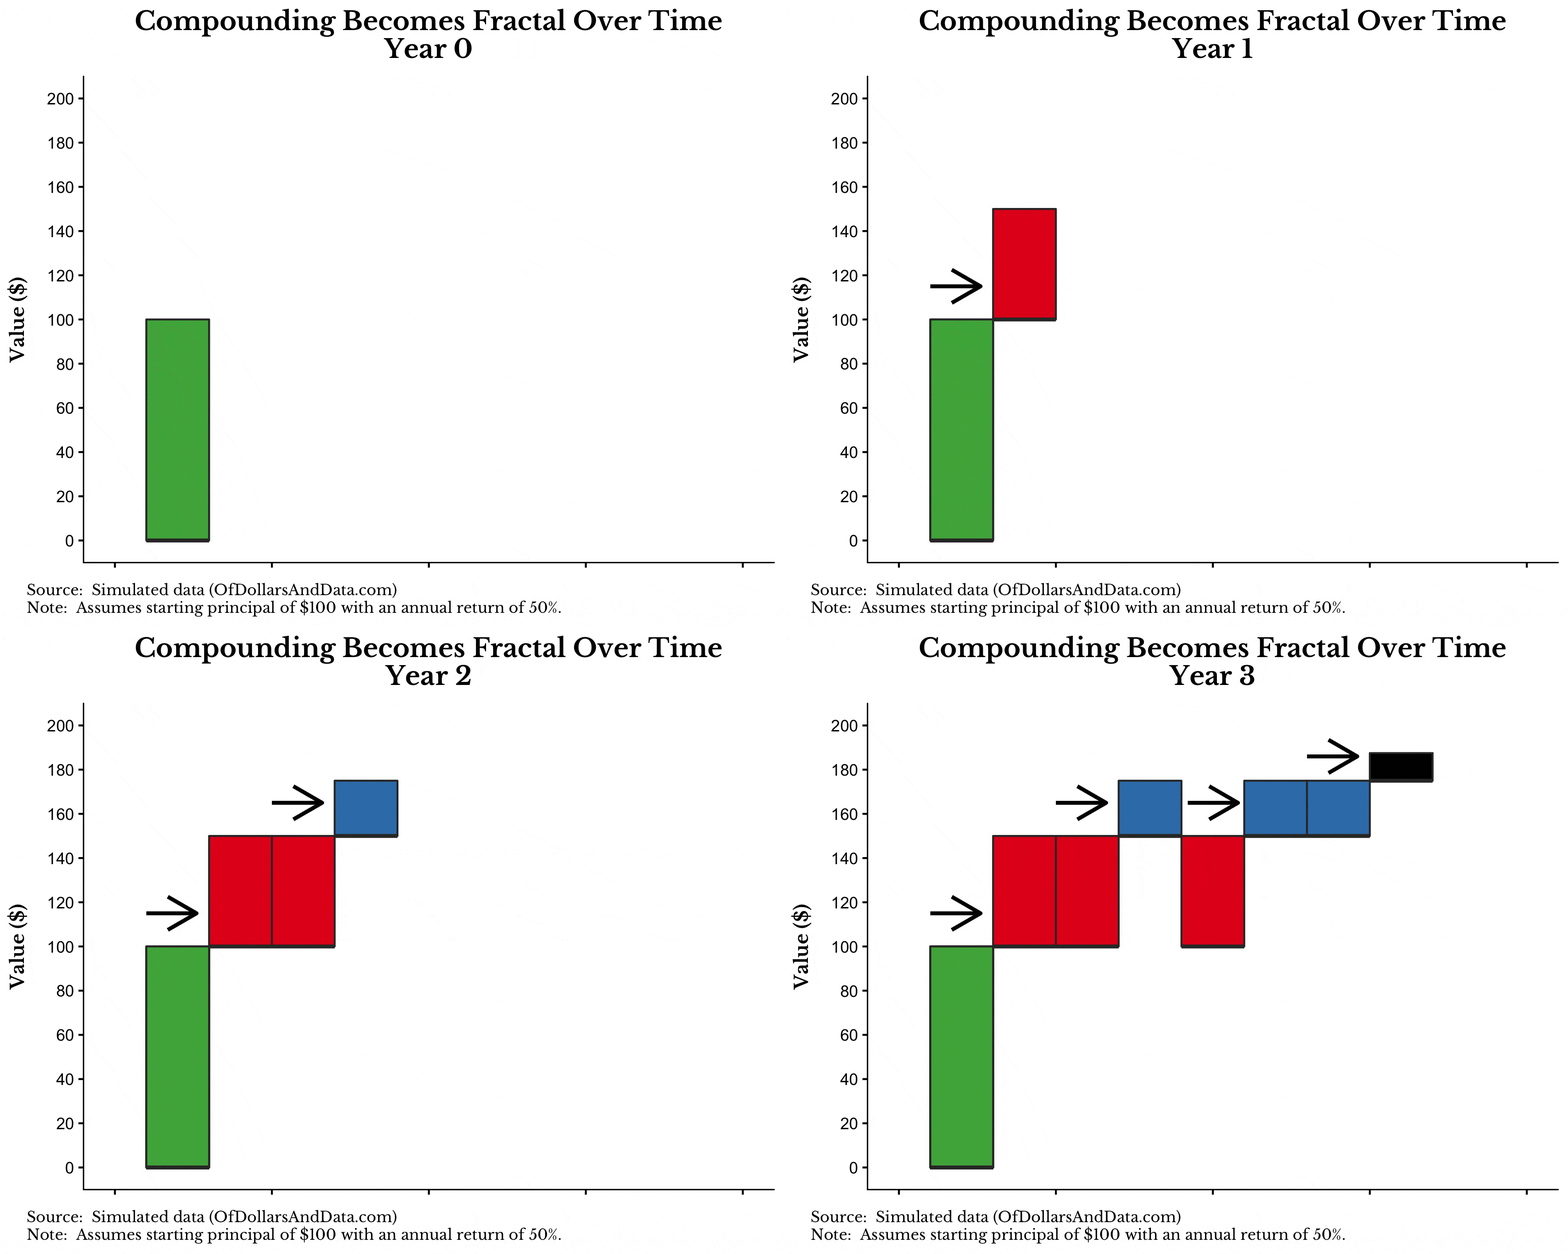
To visualize this, consider the following graphic I put together to illustrate the fractal nature of compound interest. Note that I used a 50% annual return to make this easier to visualize, but the effect is the same.
What you will notice in the graphic below is that as the years progress, the original principal of $100 (green bar) earns interest (red bar) each year. In addition, the interest from year 1 (red bar) starts generating interest in year 2 (blue bar). And finally, the interest from year 2 (blue bar) will generate interest in year 3 (black bar):

What’s amazing about this process is how it starts to grow so quickly. I only did this over 3 periods, but if I continued to expand it, the visualization would get very large in no time.
If you are still missing how this is fractal, consider the relationship in year 1 between the green and red bar. This relationship also appears in year 2 between the red and blue bars (on a smaller scale). And the process repeats itself in year 3, etc.
If you are still skeptical of the power of fractals, consider the following: It is alleged that Albert Einstein was asked what is the most powerful force in the universe and he replied, “Compound interest.”
The True Power of Fractals
The true power of fractals lies in the fact that their complexity comes from a few simple actions done over and over again. This is the power and beauty of nature. A clump of cells, with enough division, becomes a human being.
This is also true for your financial life. By doing a few simple actions over and over again, you will ensure your path to wealth. Think about it: save, invest, rebalance periodically and you are set. This is why my most popular post is still Just Keep Buying One simple action done many times leads to powerful results.
That aside, I want to leave you with a great story about the inventor of the fractal, Benoit B. Mandlebrot. Mandlebrot is responsible for the most famous fractal of all time, the Mandlebrot set, which he first visualized using computers in the late 1970s. In addition, in The Misbehavior of Financial Markets, Mandlebrot wrote a scathing critique of financial markets and their reliance on the normal distribution for pricing securities.
However, the most amazing example of his brilliance was his middle name. Though there is no record suggesting he had a middle name at birth, he decided to adopt the middle initial of “B” at some point in life. No one knows what the “B.” stood for, but theories suggest that it stood for “Benoit B. Mandlebrot.”
Yes, even his name was fractal! If you are interested in learning more about fractals, check out The Fractal Geometry of Nature by Mandlebrot. Thank you for reading!
If you liked this post, consider signing up for my newsletter.
This is post 30. Any code I have related to this post can be found here with the same numbering: https://github.com/nmaggiulli/of-dollars-and-data

