With the S&P 500 down 5.6% over the last week (and now 8.6% off its September highs), a lot of focus has turned toward the U.S. presidential election and how it might further affect the stock market. MarketWatch recently reported that market volatility tends to surge in the weeks prior to an election.
However, is this story true? And what should you do about it if it is?
To test whether market volatility increases around election day, I looked at the rolling 30-day (i.e. 20 trading session) volatility of the S&P 500 since 1950. I broke the data into presidential election years (i.e. 1952, 1956, …, 2016) and non-election years and then took the average volatility across these groups for each day in the year. I excluded 2020 from this analysis initially since we don’t have a full year’s worth of trading data for 2020.
If the consensus around volatility and elections was right, then I should see some sort of volatility spike as election day approached. Lo and behold, this is exactly what I found:
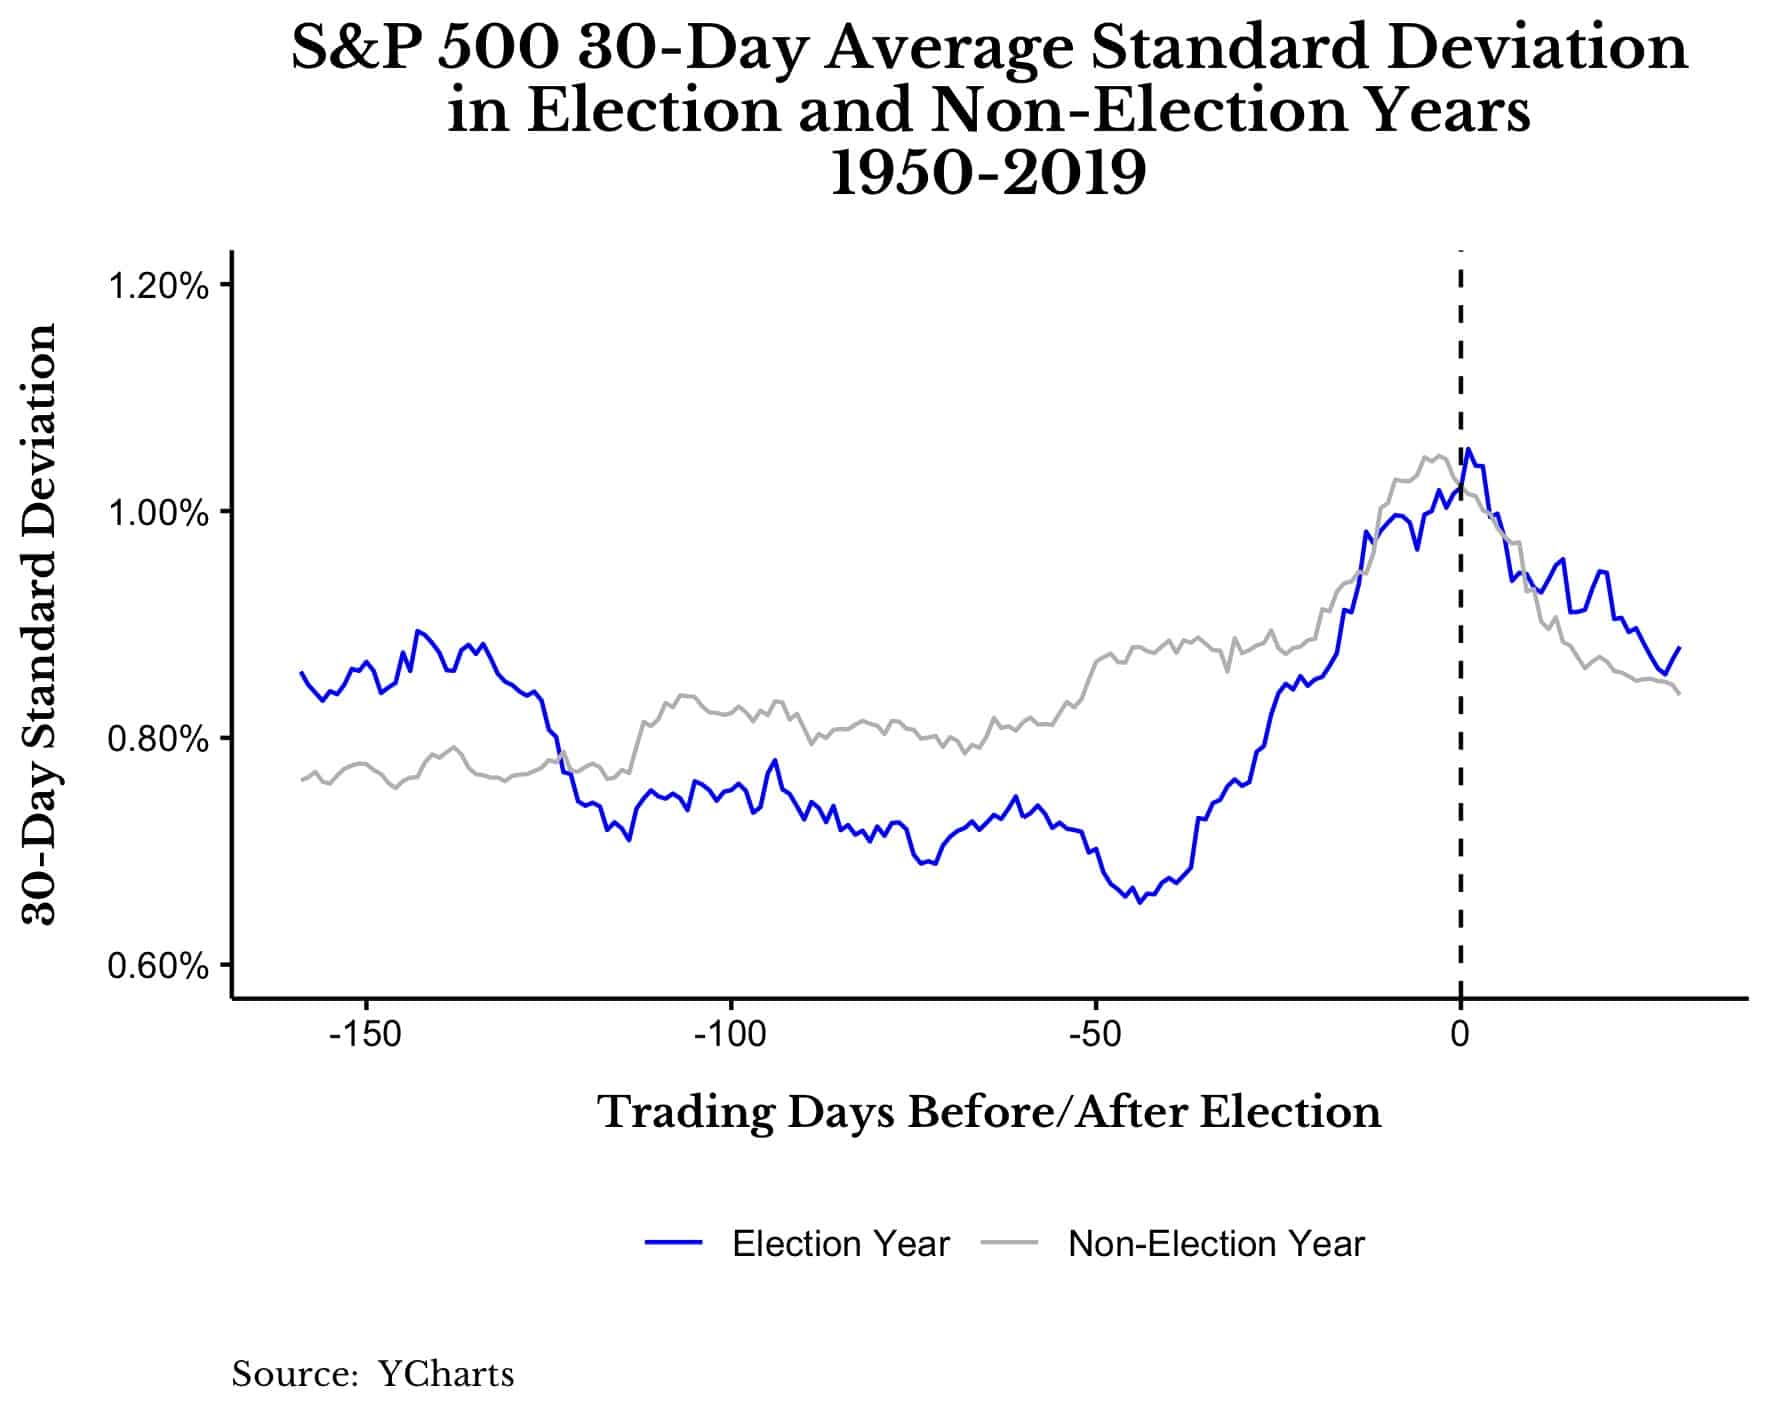
Whether you are in a presidential election year or not, average volatility tends to spike as you near election day (i.e. early November). More importantly, the difference between average 20-session volatility on election days and average 20-session volatility on all non-election days was almost statistically significant at the 90% confidence level (p-value = 0.11).
Though this seems intriguing on the surface, it left me with some unanswered questions. For example, why does the volatility increase in years that don’t have a presidential election? Yes, I understand that non-presidential elections occur, but that’s not what I was expecting. Though the data supported the narrative that “markets are more volatile around election day,” I wanted to dig deeper.
Therefore, I decided to add the 2020 data to the chart (as an election year) to see if it changed anything. This is where the story started to break down:
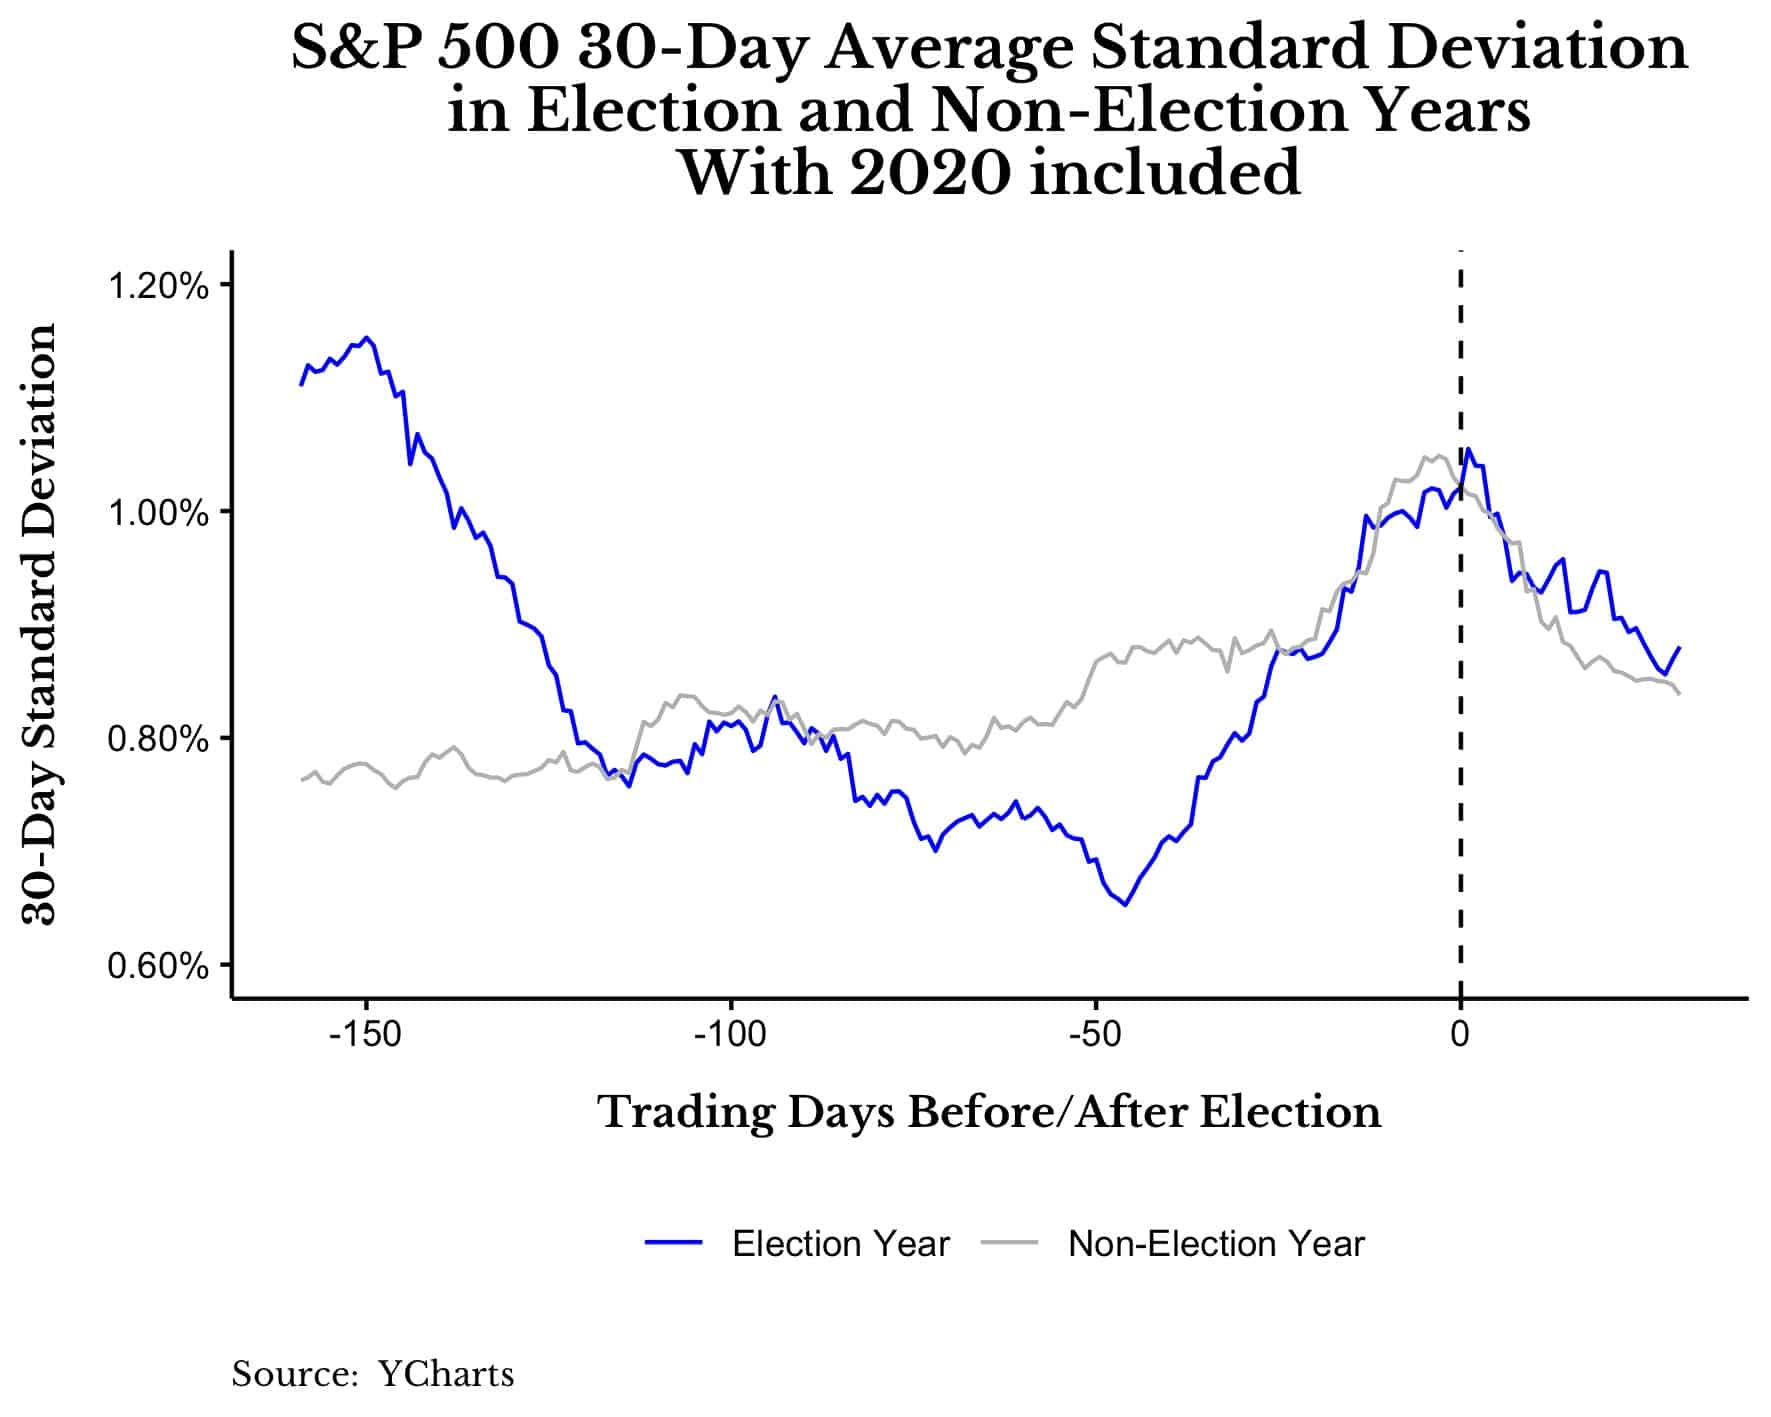
As soon as I saw this I realized that the average volatility was being driven by outliers. That high volatility period you see in the blue line around 150 days before election day is being influenced mostly by March/April 2020. And if 2020 can change the average volatility across all election years by that much, then other outlier years did as well.
To test this, I re-ran the same chart (including 2020), but I removed 1987, a year famous for its extreme October volatility. After removing 1987, I saw that the average volatility in non-election years wasn’t as pronounced leading up to election day (i.e. the gray line moved downward):
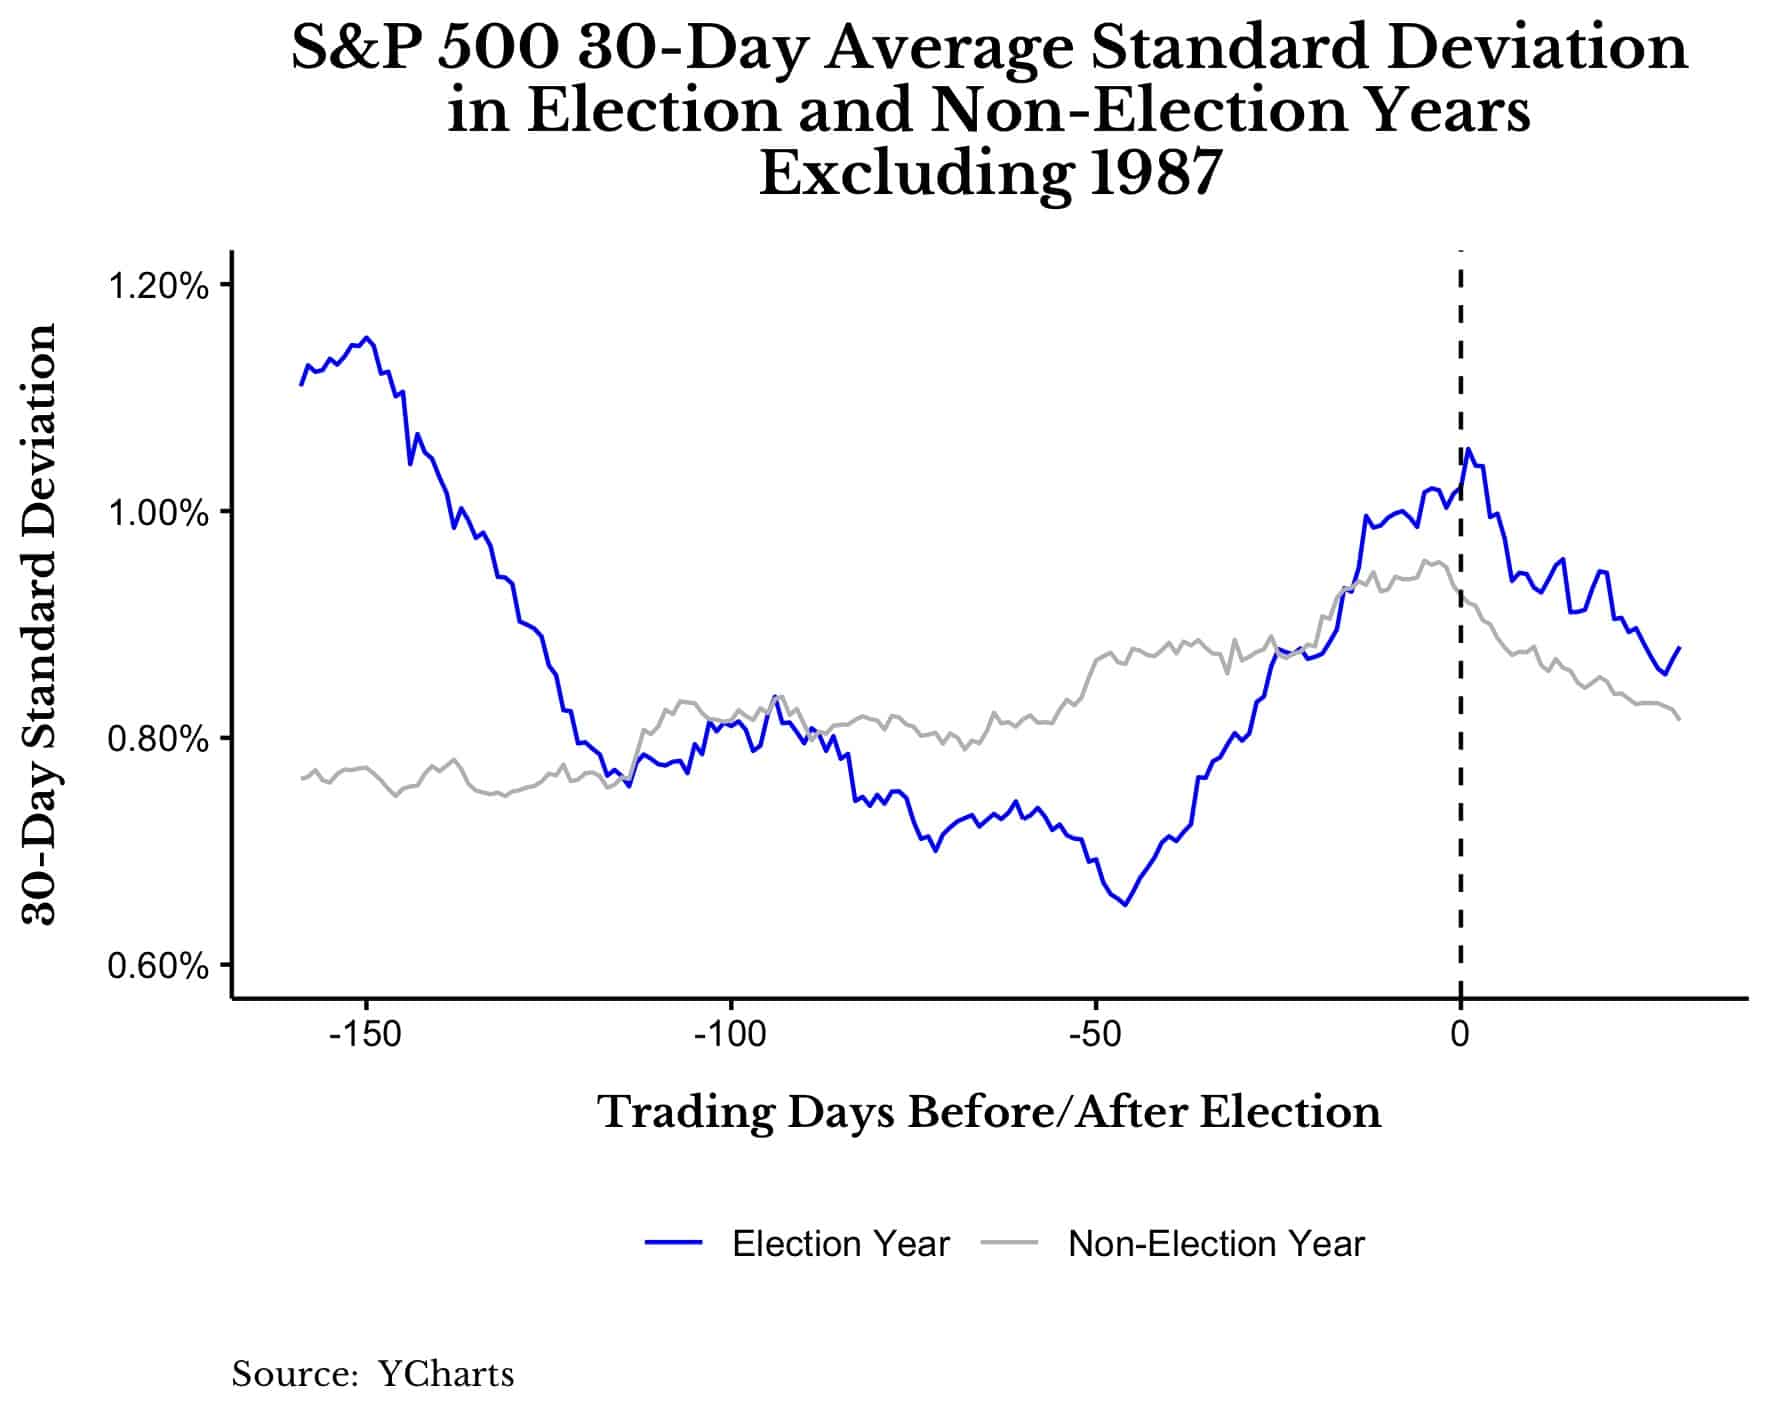
In addition, when I tested the difference in average volatility without 1987, the difference wasn’t significant at all. The p-value shot up to 0.5, a level that suggests that any difference is pure happenstance.
Now the solution to this problem seemed crystal clear—remove the outliers and test the theory again. Therefore, I switched to using the median rolling volatility instead of the average rolling volatility, but this didn’t make the “story” any clearer:
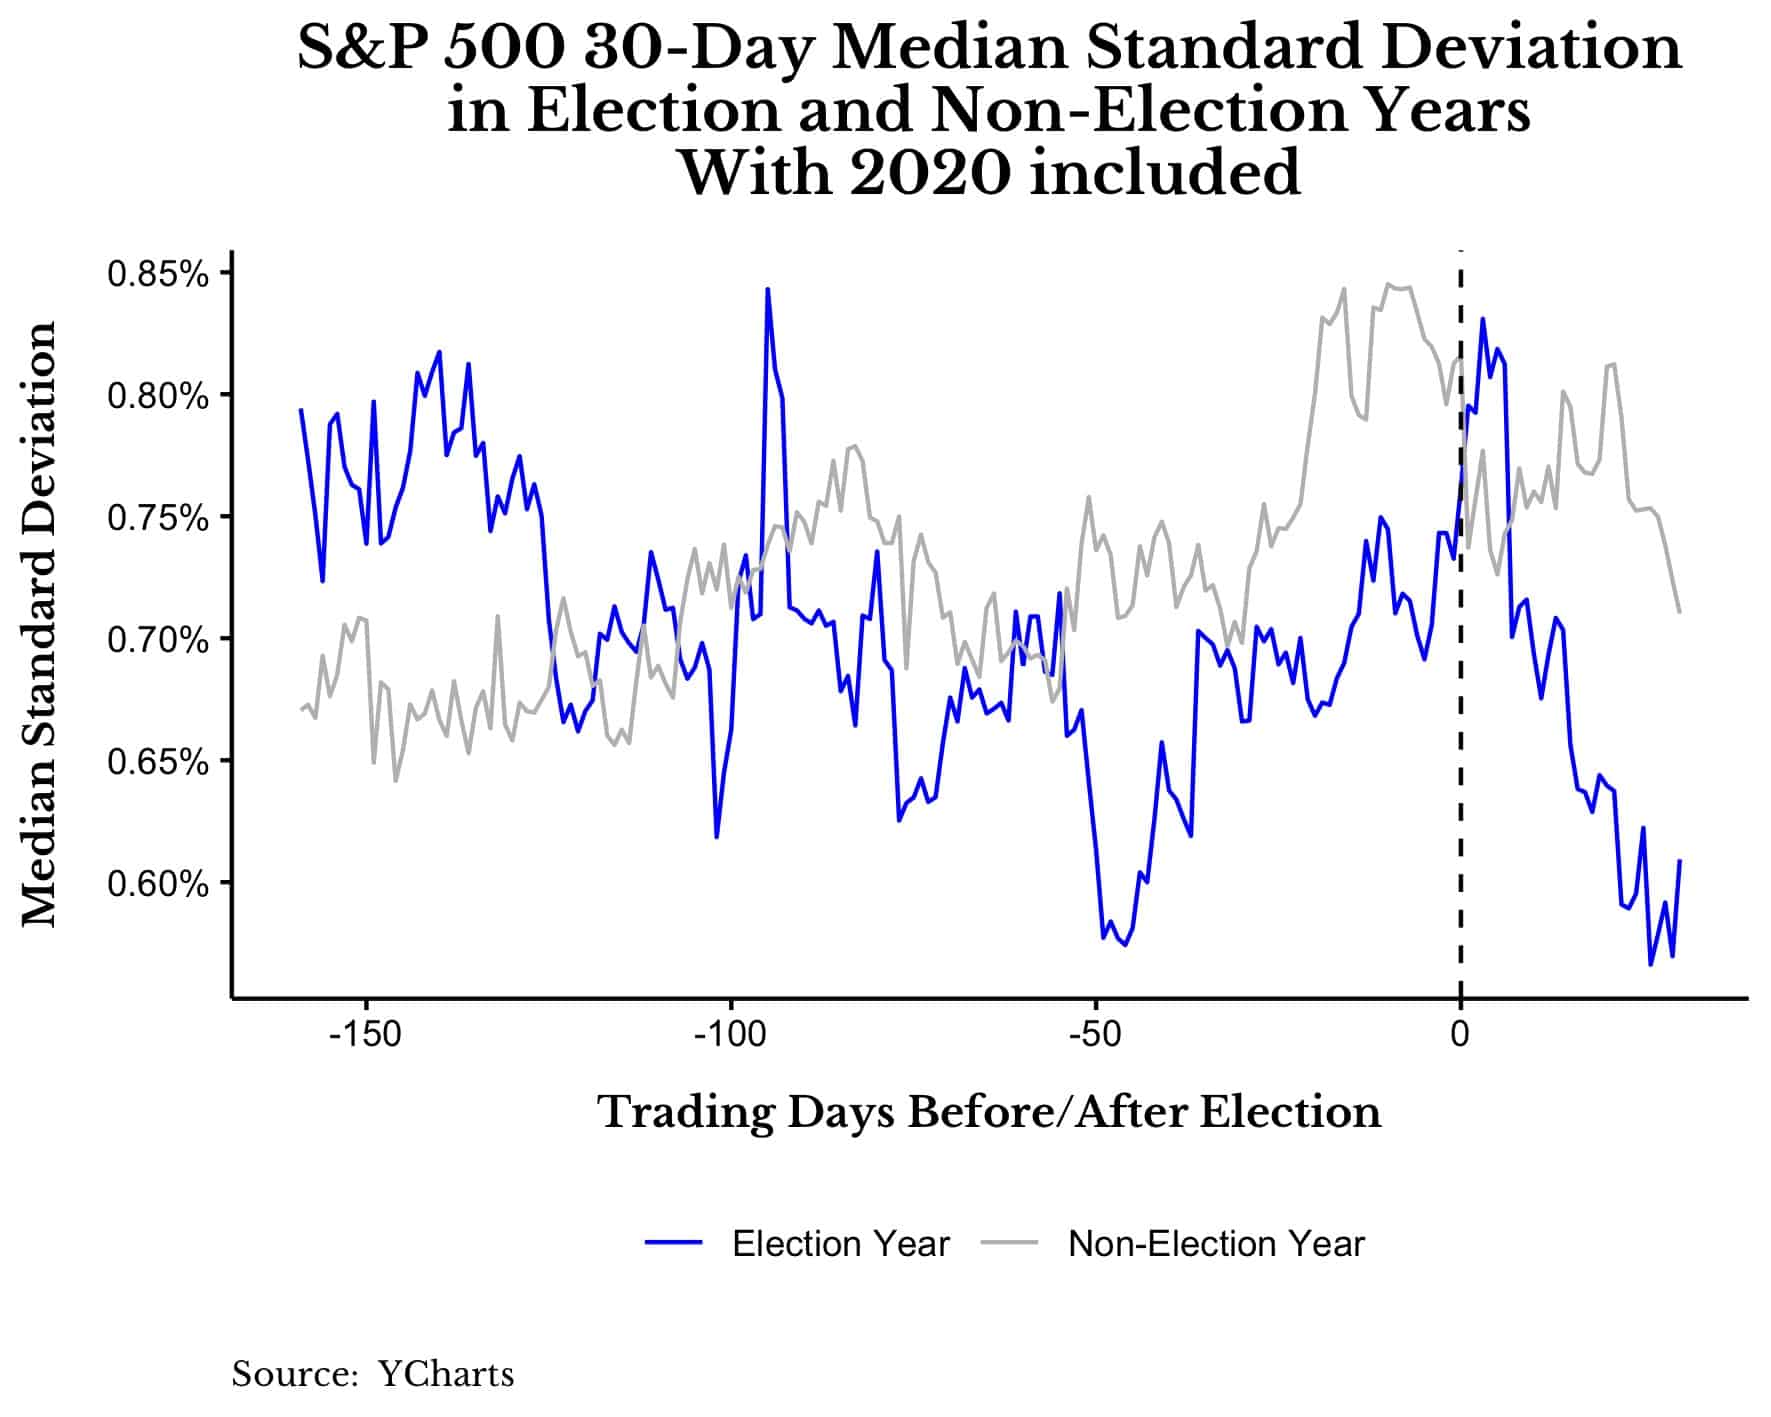
Yes, it does seem like there is an increase in volatility around election day, but when I see similarly high levels of volatility in non-election years, it gives me pause.
However, what if the time period I am using is too long? What if it’s picking up more noise than we want? To fix this, I shortened my viewing window from one month (i.e. 20 trading sessions) to one week (i.e. five trading sessions).
What Happens When We Examine Shorter Time Periods?
When I shorten the time period to look at one week median volatility instead of one month median volatility, I find that the results better fit the “elections impact markets” narrative:
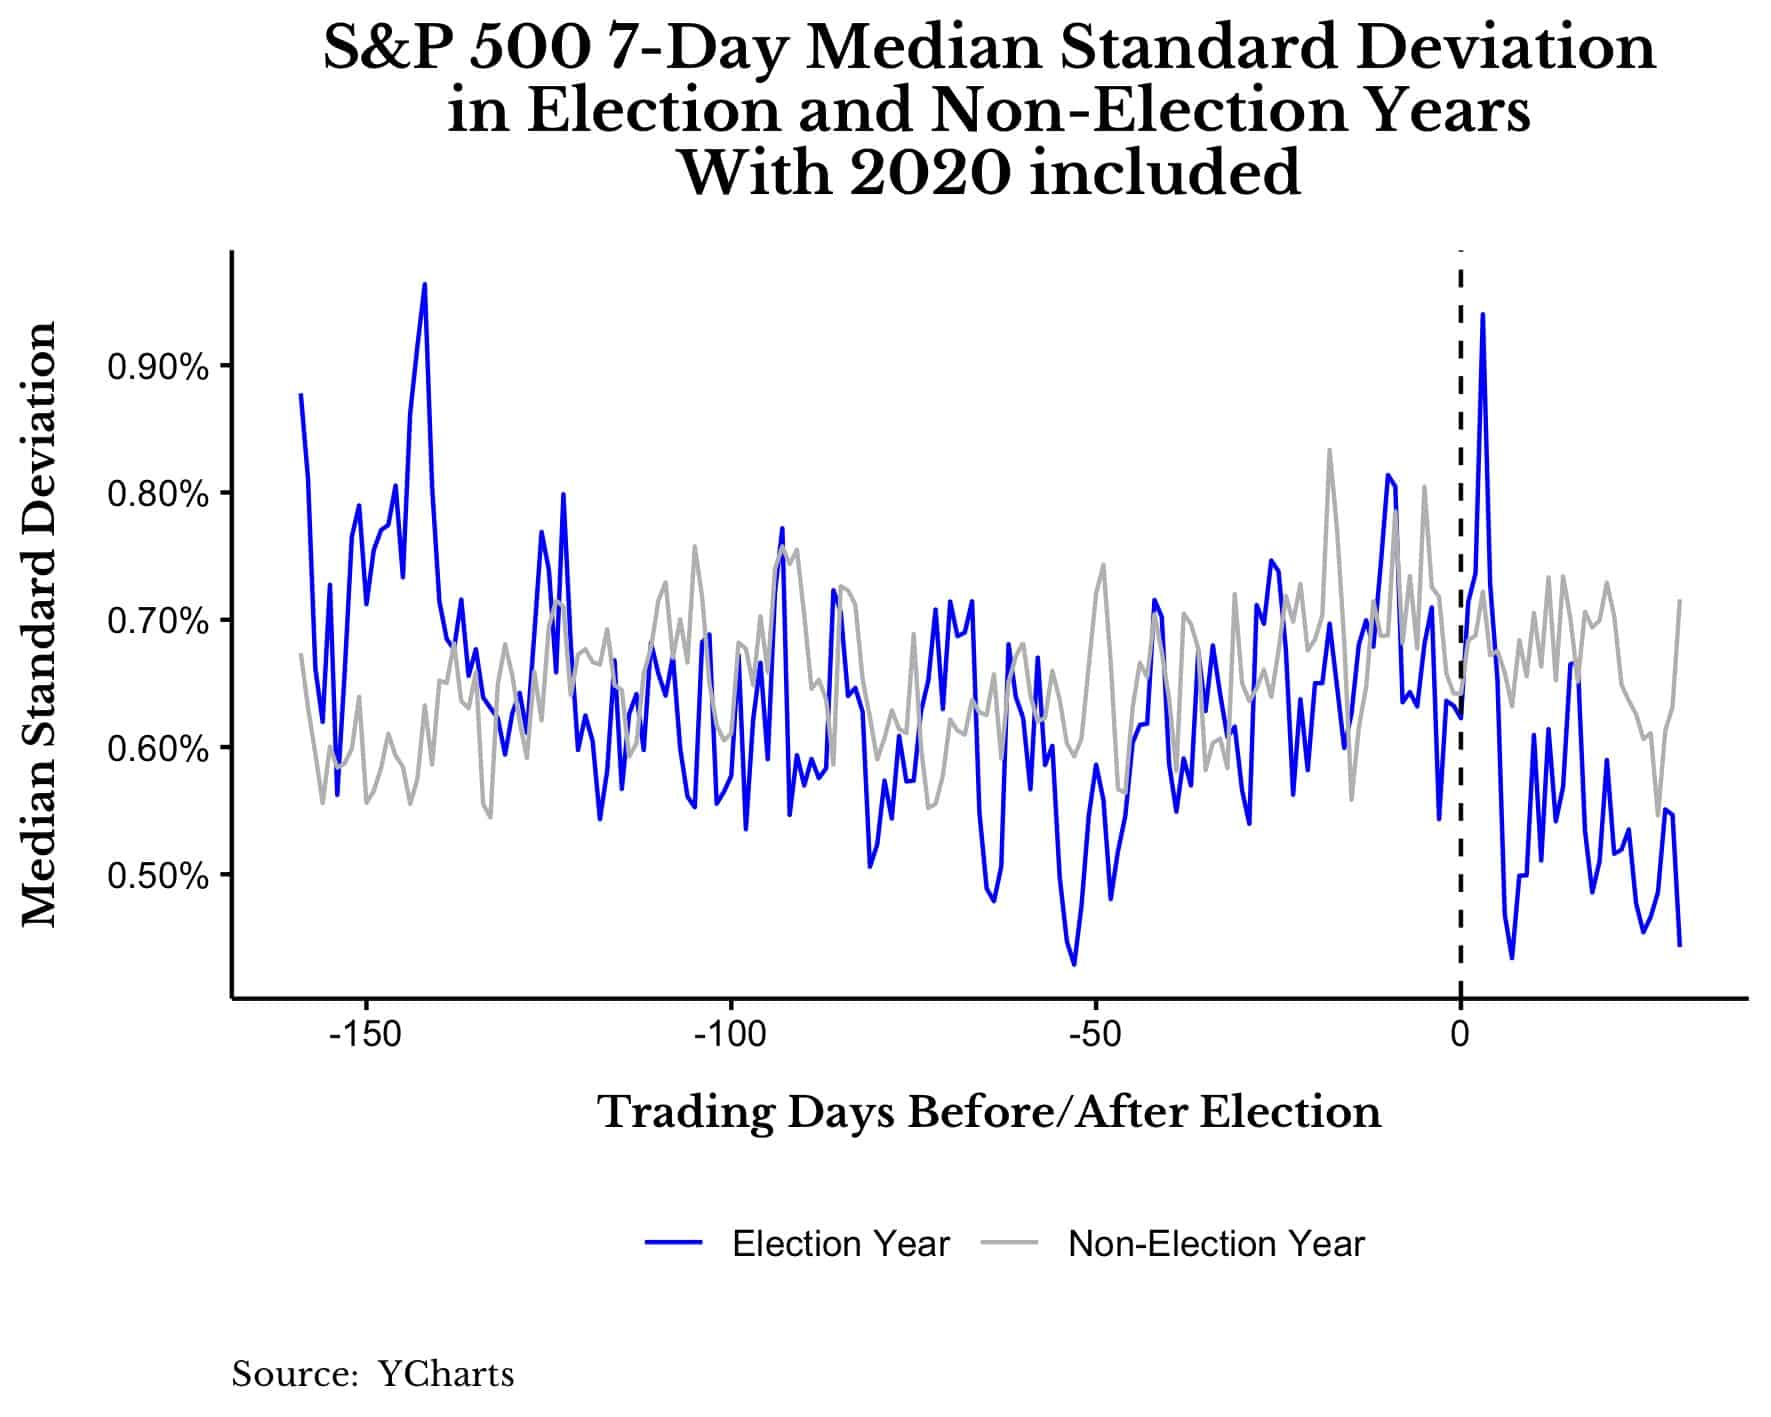
Now we can see that there is a big spike in median volatility around election day in presidential election years.
And when we look at 1-week returns around election day, we see a big spike as well:
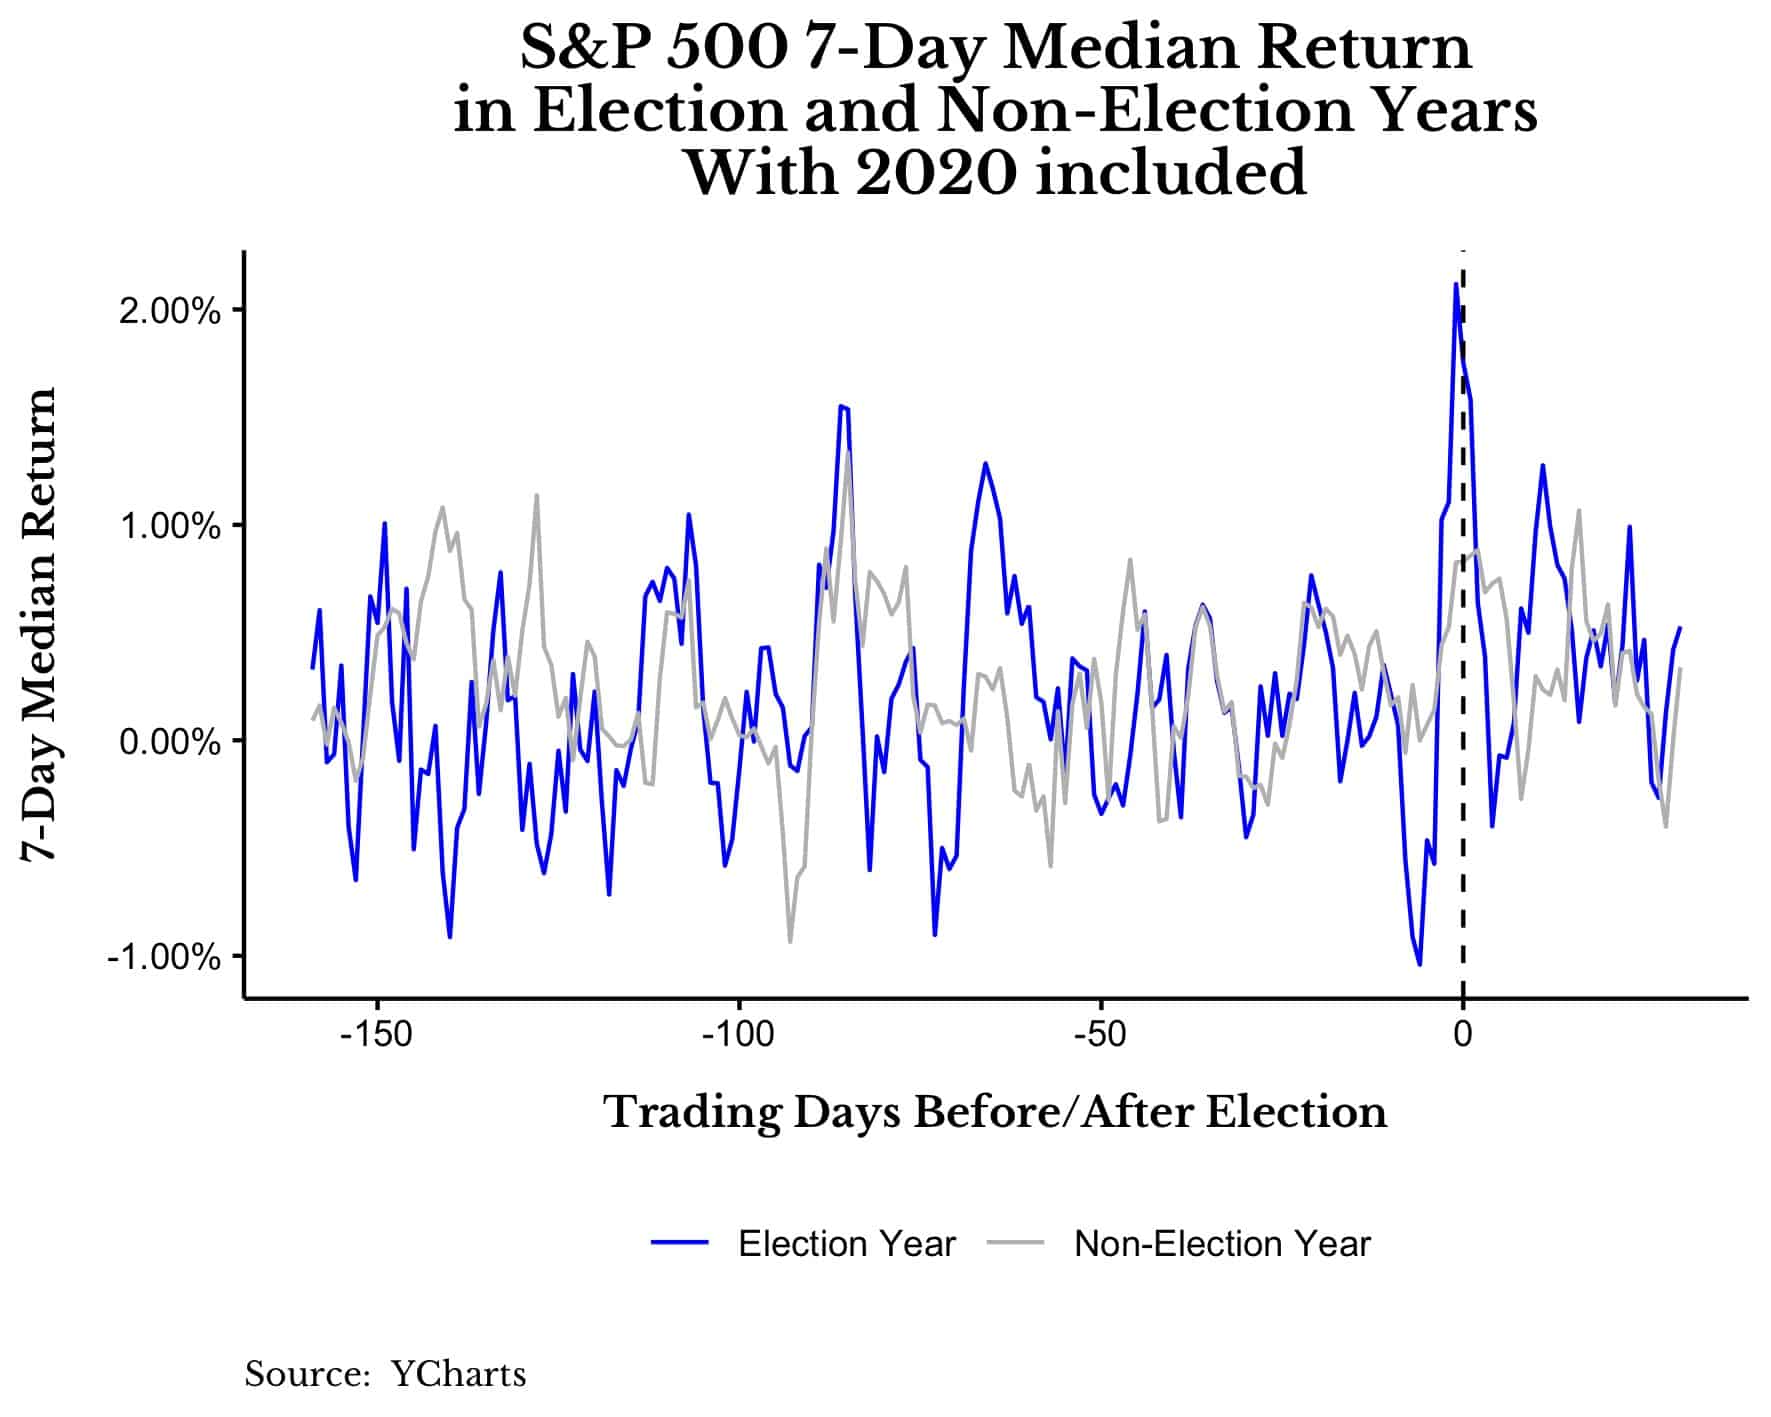
More importantly, the difference in average 1-week returns around this time is statistically significant at the 99% confidence level (p-value < 0.01) as well! This is because the average 1-week return in the week leading up to a presidential election is 1.7% compared to only 0.17% in all other weeks.
This suggests that presidential elections do have a noticeable impact on markets, but the size and duration of that impact seems to be limited in nature.
Why is it limited? Because it doesn’t seem to persist after the election. In the few days after a presidential election (i.e. up until Friday of election week), there does seems to be an increase in market volatility. However, this increase tends to fade and also is not statistically significant:
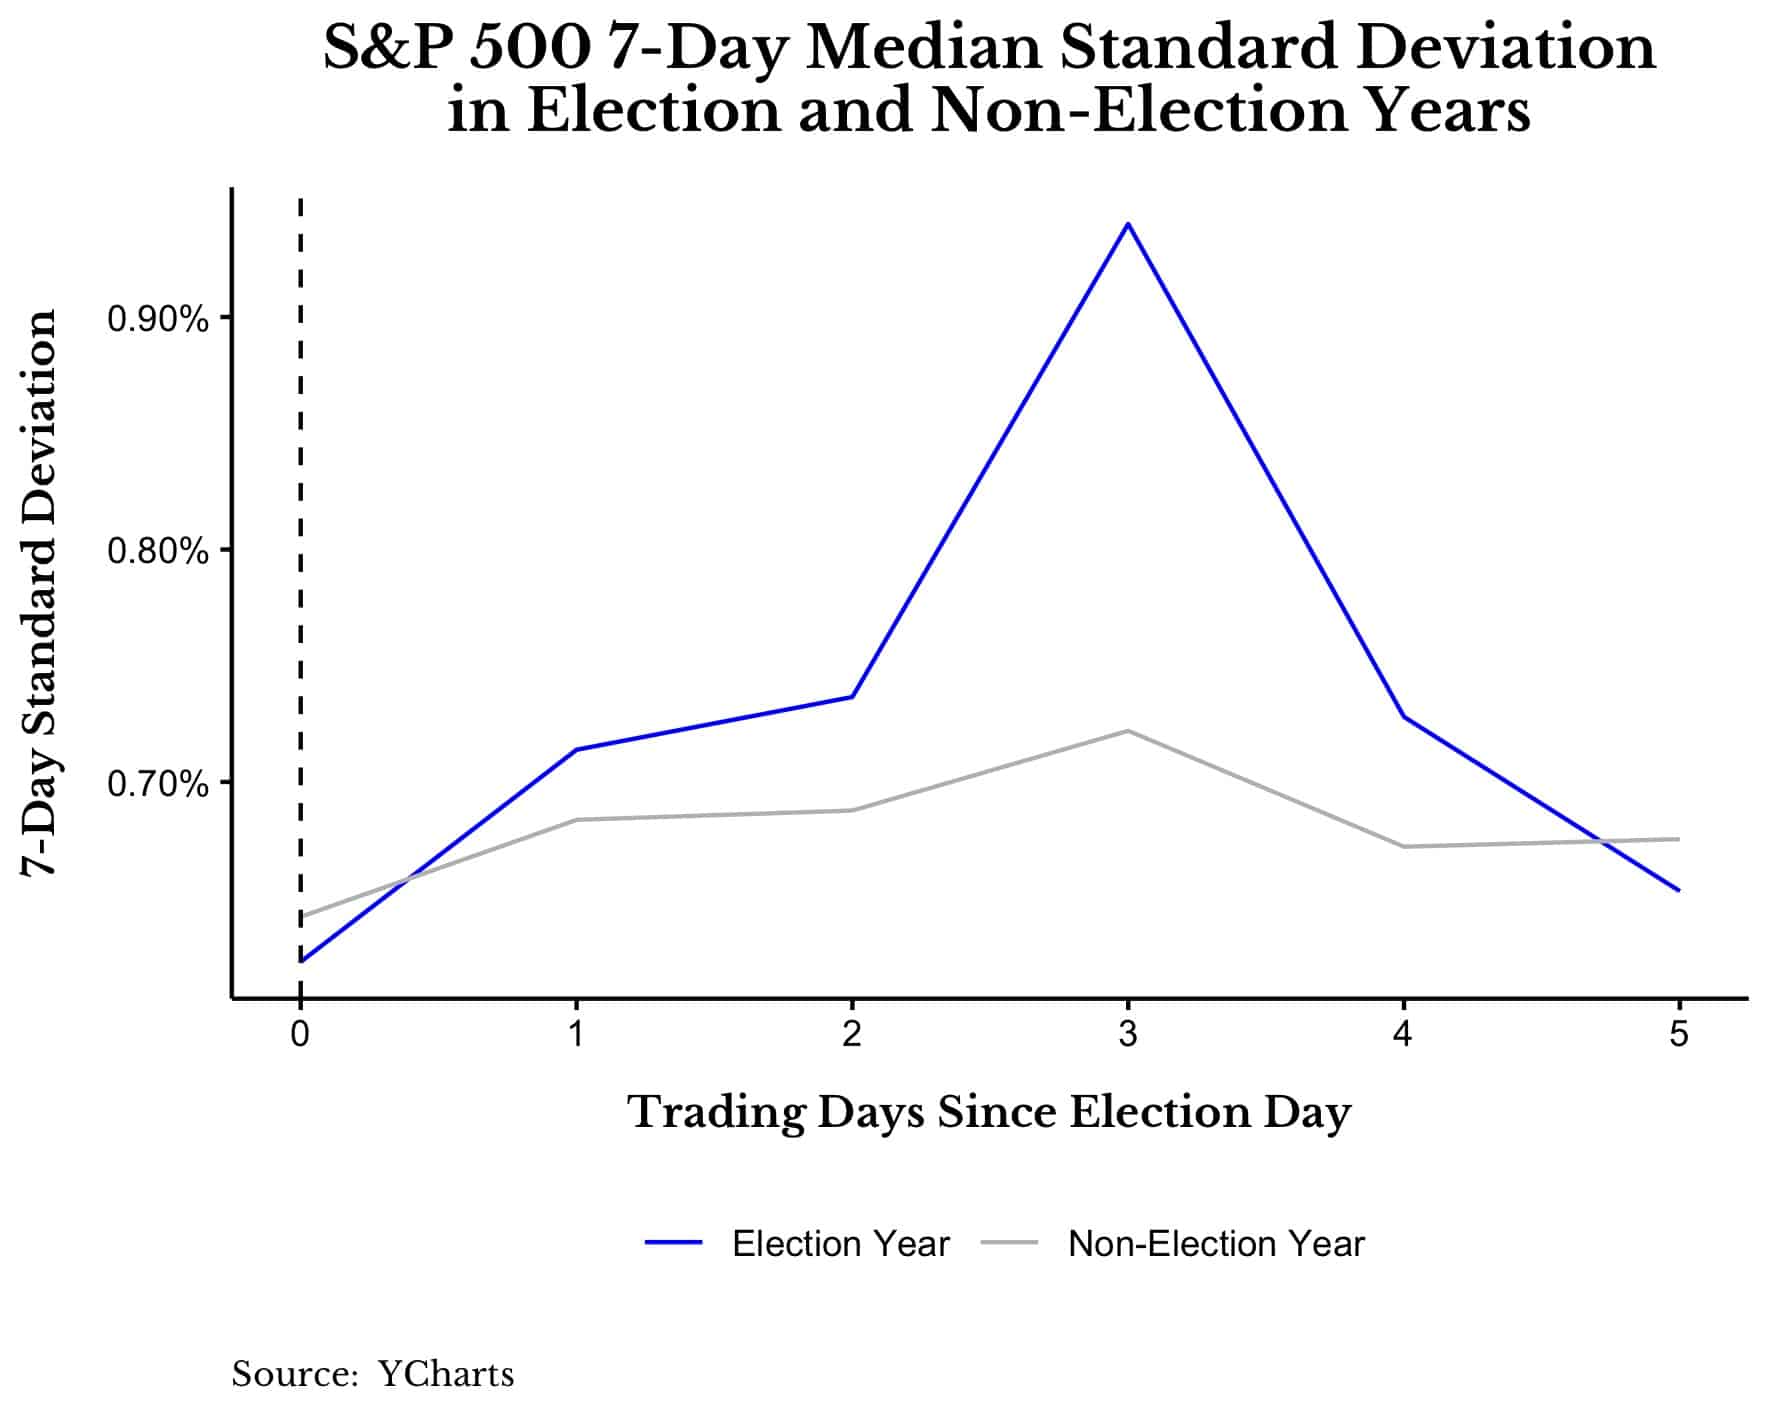
This suggests that most of the impact of the election on the market happens before the election occurs.
Investors seem to understand this intuitively given that many of them added cash and other forms of protection to their portfolios in preparation for tomorrow.
Given what I have shown so far, I understand why some investors would want to make allocation changes, but does this actually matter?
Does Any of it Matter?
While it’s clear that presidential elections tend to have some impact on market performance in the short run, whether you should do anything about them is another matter entirely. After all, why would you make adjustments to your portfolio based on the outcome of a single election when you have decades of investing ahead of you?
Of course presidents can affect markets over the long run through policy changes, but what’s the likelihood that those policy changes will prevent you from reaching your financial goals? Slim to none.
Actually, the more likely outcome is that you will make a drastic change to your portfolio that ends up doing more harm than good. If you disagree, try to remember back to the last presidential election when so many claimed that a Trump victory would lead to a market crash. Unfortunately for them, that crash never materialized.
So if you want to change your asset allocation based on the outcome of a single election, you might as well ask if Mercury is in retrograde or if the McRib is back at McDonald’s. Because the best thing you can actually do for your portfolio around election day is nothing at all. This might be hard to believe, but it’s true.
If I’ve learned anything about studying elections and markets, it’s that most of the conclusions are likely the result of data mining. The result of finding patterns that aren’t there. And we find them because we aren’t looking for the truth. We are looking for the story that we want to tell. As the saying goes:
More fiction has been written in Microsoft Excel than in Microsoft Word.
No matter what happens tomorrow, stay safe, happy investing, and thank you for reading!
If you liked this post, consider signing up for my newsletter.
This is post 211. Any code I have related to this post can be found here with the same numbering: https://github.com/nmaggiulli/of-dollars-and-data

