There is a famous quote by the 18th century banker Baron Rothschild:
The time to buy is when there’s blood in the streets.
Rothschild made a lot of money in the panic that followed the Battle of Waterloo using this exact motto. However, his advice is far easier said than done. I’ve noticed this problem within the personal finance/investing community that seems to suggest that a few common rules can solve almost all of your financial problems.
The issue is that it is far easier to memorize a simple catch phrase that looks good retrospectively, than to act on the same advice in the moment. I will expand on this point later, but first, some data.
Let’s consider the drawdowns on the S&P 500 since the late 1920s. For a short refresher, a drawdown is any decline from an all time-high. Therefore, if a stock is at 100 and falls, that stock is in a drawdown until its price is above 100.
More importantly, I want to focus on times when there is “blood in the streets” as Rothschild’s quote suggests. Though there is no formal definition for this, I am going to propose that any drawdown greater than 30% can be considered a “blood in the streets” moment.
As you can see below, the S&P 500 has had 6 initial drawdowns of greater than 30% since the late 1920s (the dark points represent the month where the drawdown first exceeded 30%):
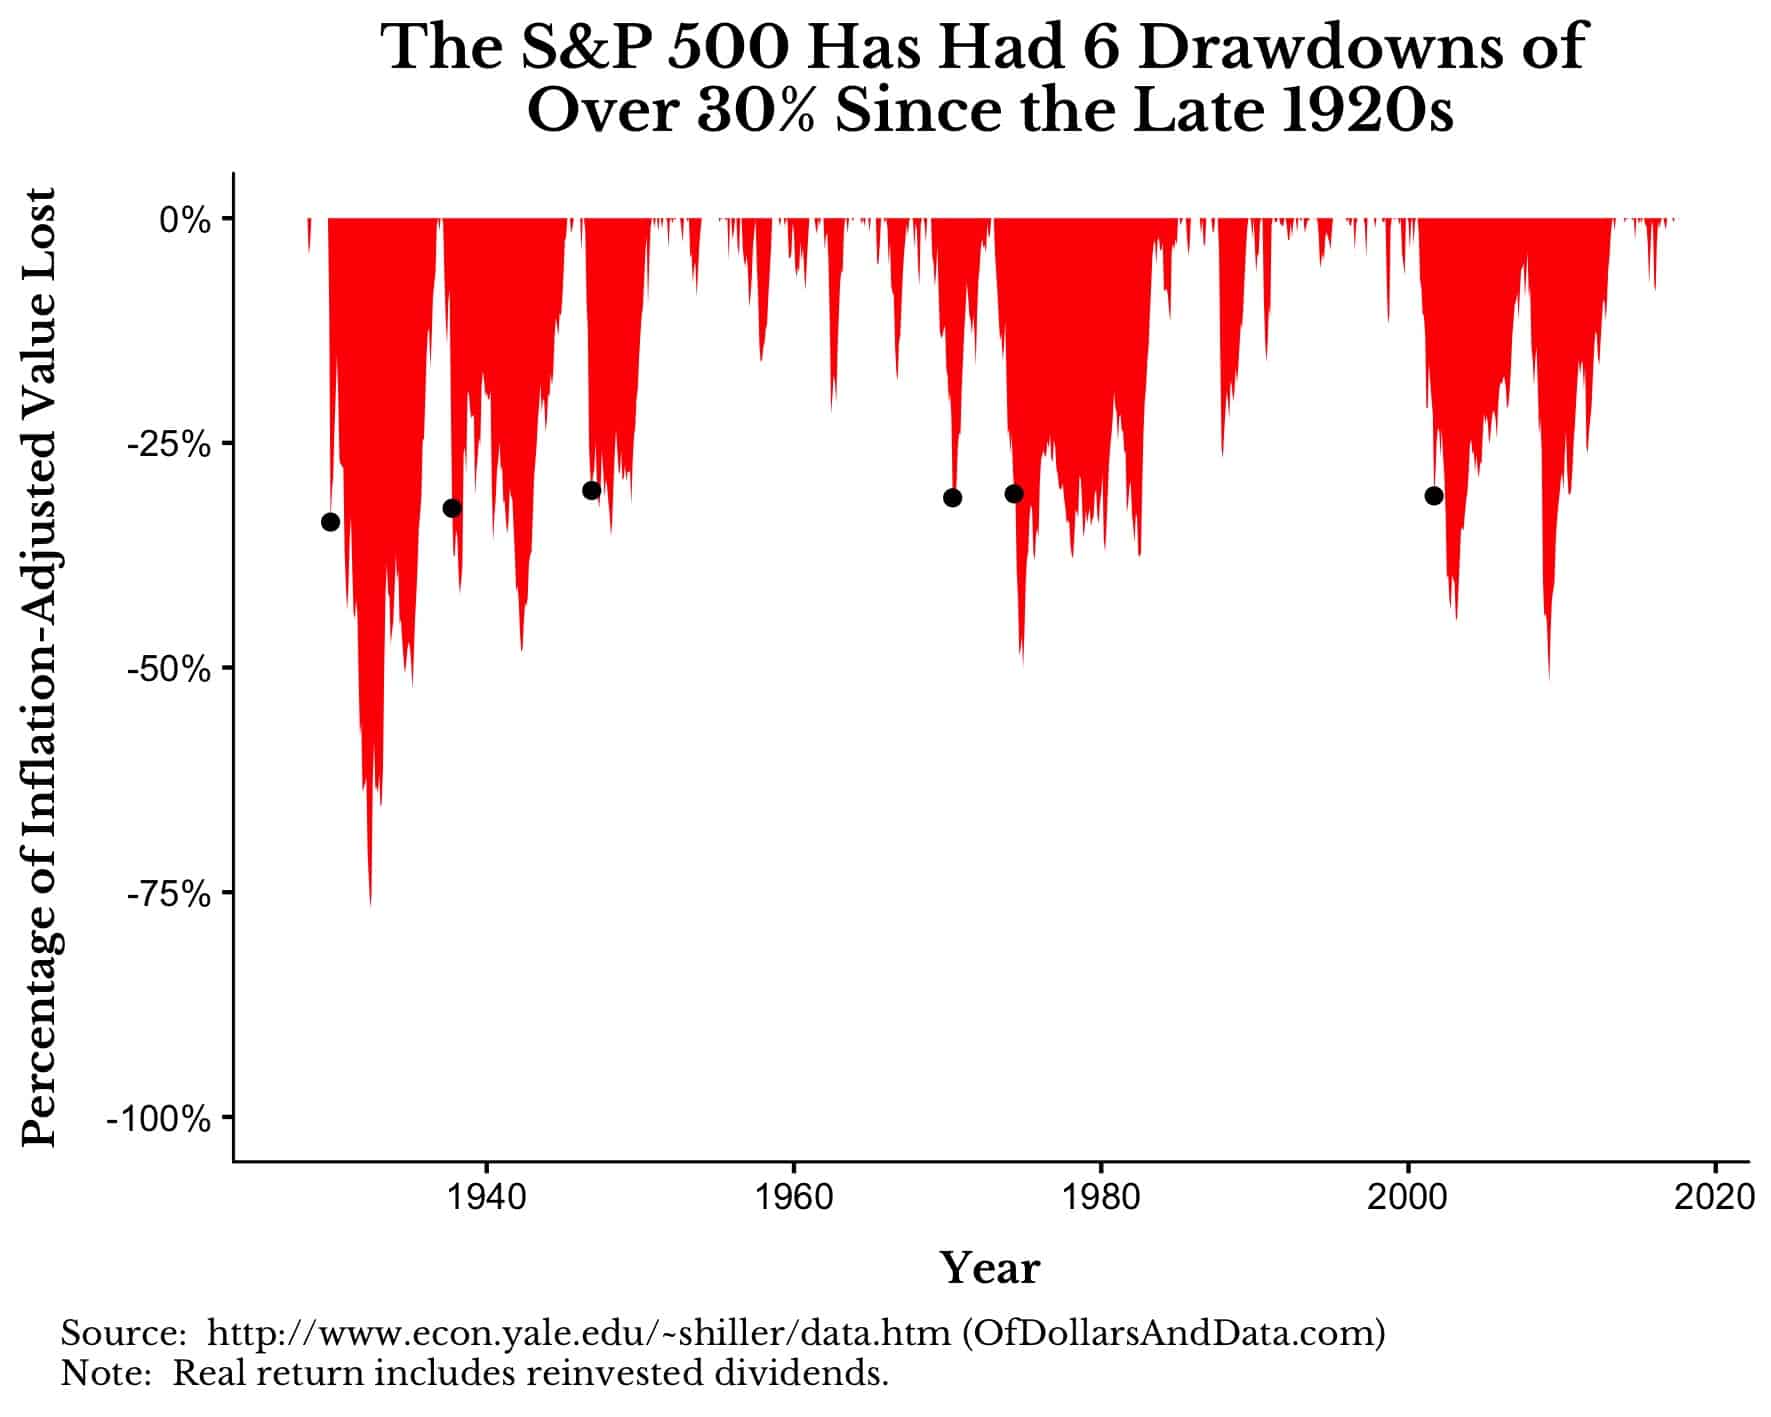
In addition to these 6 drawdowns of over 30%, there were 4 occasions where the S&P 500 had a drawdown of over 40%, and 3 occasions where it had a drawdown of over 50%.
While we cannot predict the frequency of future drawdowns or their magnitude, if history is any guide you should plan for four 30%+ drawdowns and two 50%+ drawdowns in equity markets over a 50 year investment life. I don’t know when (or if) they will happen, but this is a fair expectation given market history.
So what’s it like when there is blood in the streets?
To imagine this, I have gone back through the data and aligned and indexed every market peak for the most famous U.S. stock market crashes. This means that from each all time high, we can see the crash play out. It will allow us to easily compare the 1929 crash to the crashes in 1974 (peak was in 1973), 1987, 2000, and 2008 (peak was in 2007).
Below are the 5 peaks aligned to start at 100 and play out over time. You can see which line corresponds to which peak using the year showing up on the far right side of the plot:
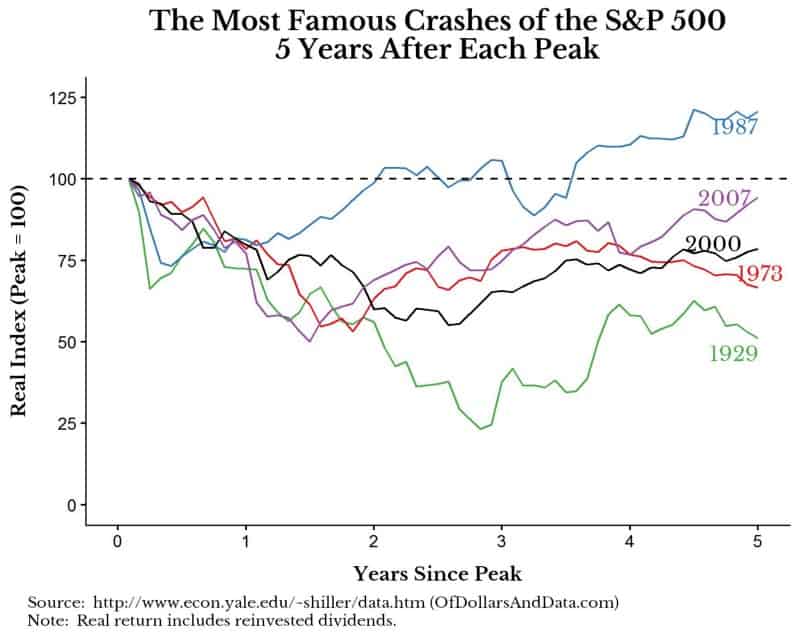
As you can see, each market crash behaves different especially as time goes on.
For example, the Great Depression and the Dotcom bubble both didn’t see the bottom until ~3 years after their respective peaks, while the crash of 1987 quickly resolved itself and was above its old peak within 2 years.
If we expand our time horizon to look out over a a 10 year period, we see a few very interesting things about these same stock market crashes:
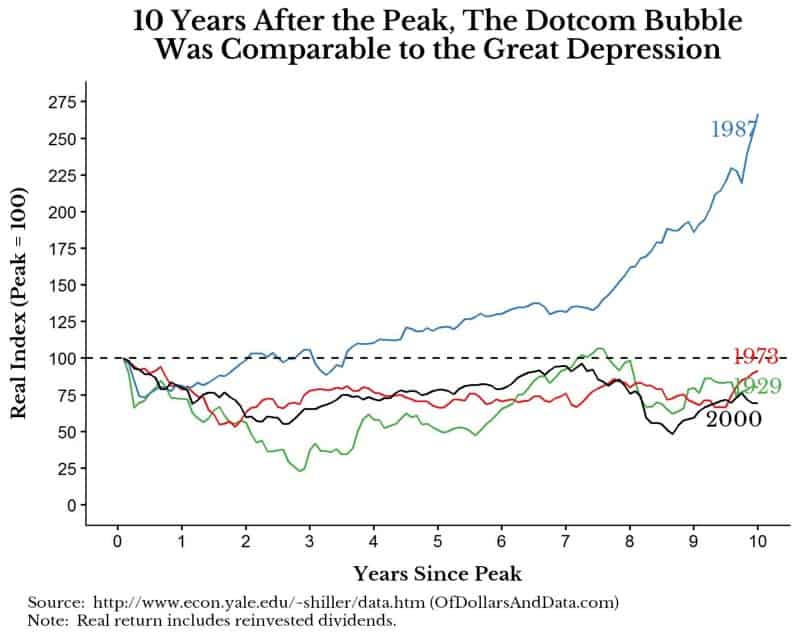
The most important thing I learned from this data was that the Dotcom bubble combined with the Great Recession of 2008 placed the U.S. stock market in a similar place to the Great Depression 10 years after its beginning. Now I am not saying that both events exhibited the same level of financial chaos, because they didn’t.
Looking at the Great Depression you can see that the green line is far lower for far longer than the black line (Dotcom bubble).
This exemplifies how the experience of the Great Depression was far worse than the Dotcom bubble + Great Recession, despite the real price changes ending up around the same place 10 years later. This is intriguing even though it is likely pure coincidence.
Now this is where the “blood in the streets” quote will fail you. Imagine being 1 year into the Great Depression. By our definition, there was “blood in the streets” as there had already been a 30% drawdown in the U.S. stock market.
However, the market would continue to decline for another 2 years, with a 64% decline in the last year! Though you might start buying when there is blood in the streets, you may soon realize that a lot of that blood is your own.
This is the fundamental problem with buying big during a crash. It’s incredibly difficult to call the bottom.
So if you try to wait it out you will either miss it completely (i.e. staying in cash for too long), or you will buy before the true bottom and could lose money if you sell at lower prices. Either way, the best action is no action at all…
Don’t React When the Streets Run Red
If there is any advice I would follow during a panic, it would be to not react to it. By reacting you are far more likely to make a decision that loses you money than one that will help you.
Assuming you have a sufficient level of liquidity in an emergency fund, I would continue buying assets at the same rate during a financial panic as you did before the panic. Yes, just keep buying is here again.
If you don’t believe me, consider the words of Charlie Munger, Warren Buffett’s acclaimed business partner. Munger stated the following at the beginning of an interview with the BBC:
If you’re not willing to react with equanimity to a market price decline of 50% two or three times a century, you’re not fit to be a common shareholder and you deserve the mediocre result you’re going to get.
Munger and Buffett are known for buying when prices are depressed, but I still do not advise this course of action for an average investor. The problem is that they have the extra capital to buy cheaper assets, but you probably don’t.
Your extra capital may be needed for liquidity purposes during an emergency (i.e. job loss, etc.), but this is something that only you would know.
While you may commit now to not act during the next panic, I doubt it will be easy when the time comes. Thank you for reading!
If you liked this post, consider signing up for my newsletter.
This is post 35. Any code I have related to this post can be found here with the same numbering: https://github.com/nmaggiulli/of-dollars-and-data

