A long-time reader asks:
Perhaps you could put a data-driven view together on the performance of different portfolio allocations(70/30 stocks/bonds vs. 60/40, 50/50, 40/60, etc.) over various time horizons(1, 3, 5, 10, 25 year, etc.), to help aid in answering the question: if my time horizon is X for a given portfolio, my asset allocation should be Y, based on my risk tolerance.
While there is a lot to unpack here, including how this reader defines “risk tolerance,” I think I can be of help.
To start, let’s look at the following portfolios:
- S&P 500: 100% U.S. stocks
- 80/20 Portfolio: 80% S&P 500, 20% U.S. Bonds
- 60/40 Portfolio: 60% S&P 500, 40% U.S. Bonds
- Permanent Portfolio: 25% S&P 500, 25% U.S. Bonds, 25% Cash (1-month Treasuries), 25% Gold
Since the beginning of 2020, here is how these four portfolios have performed:
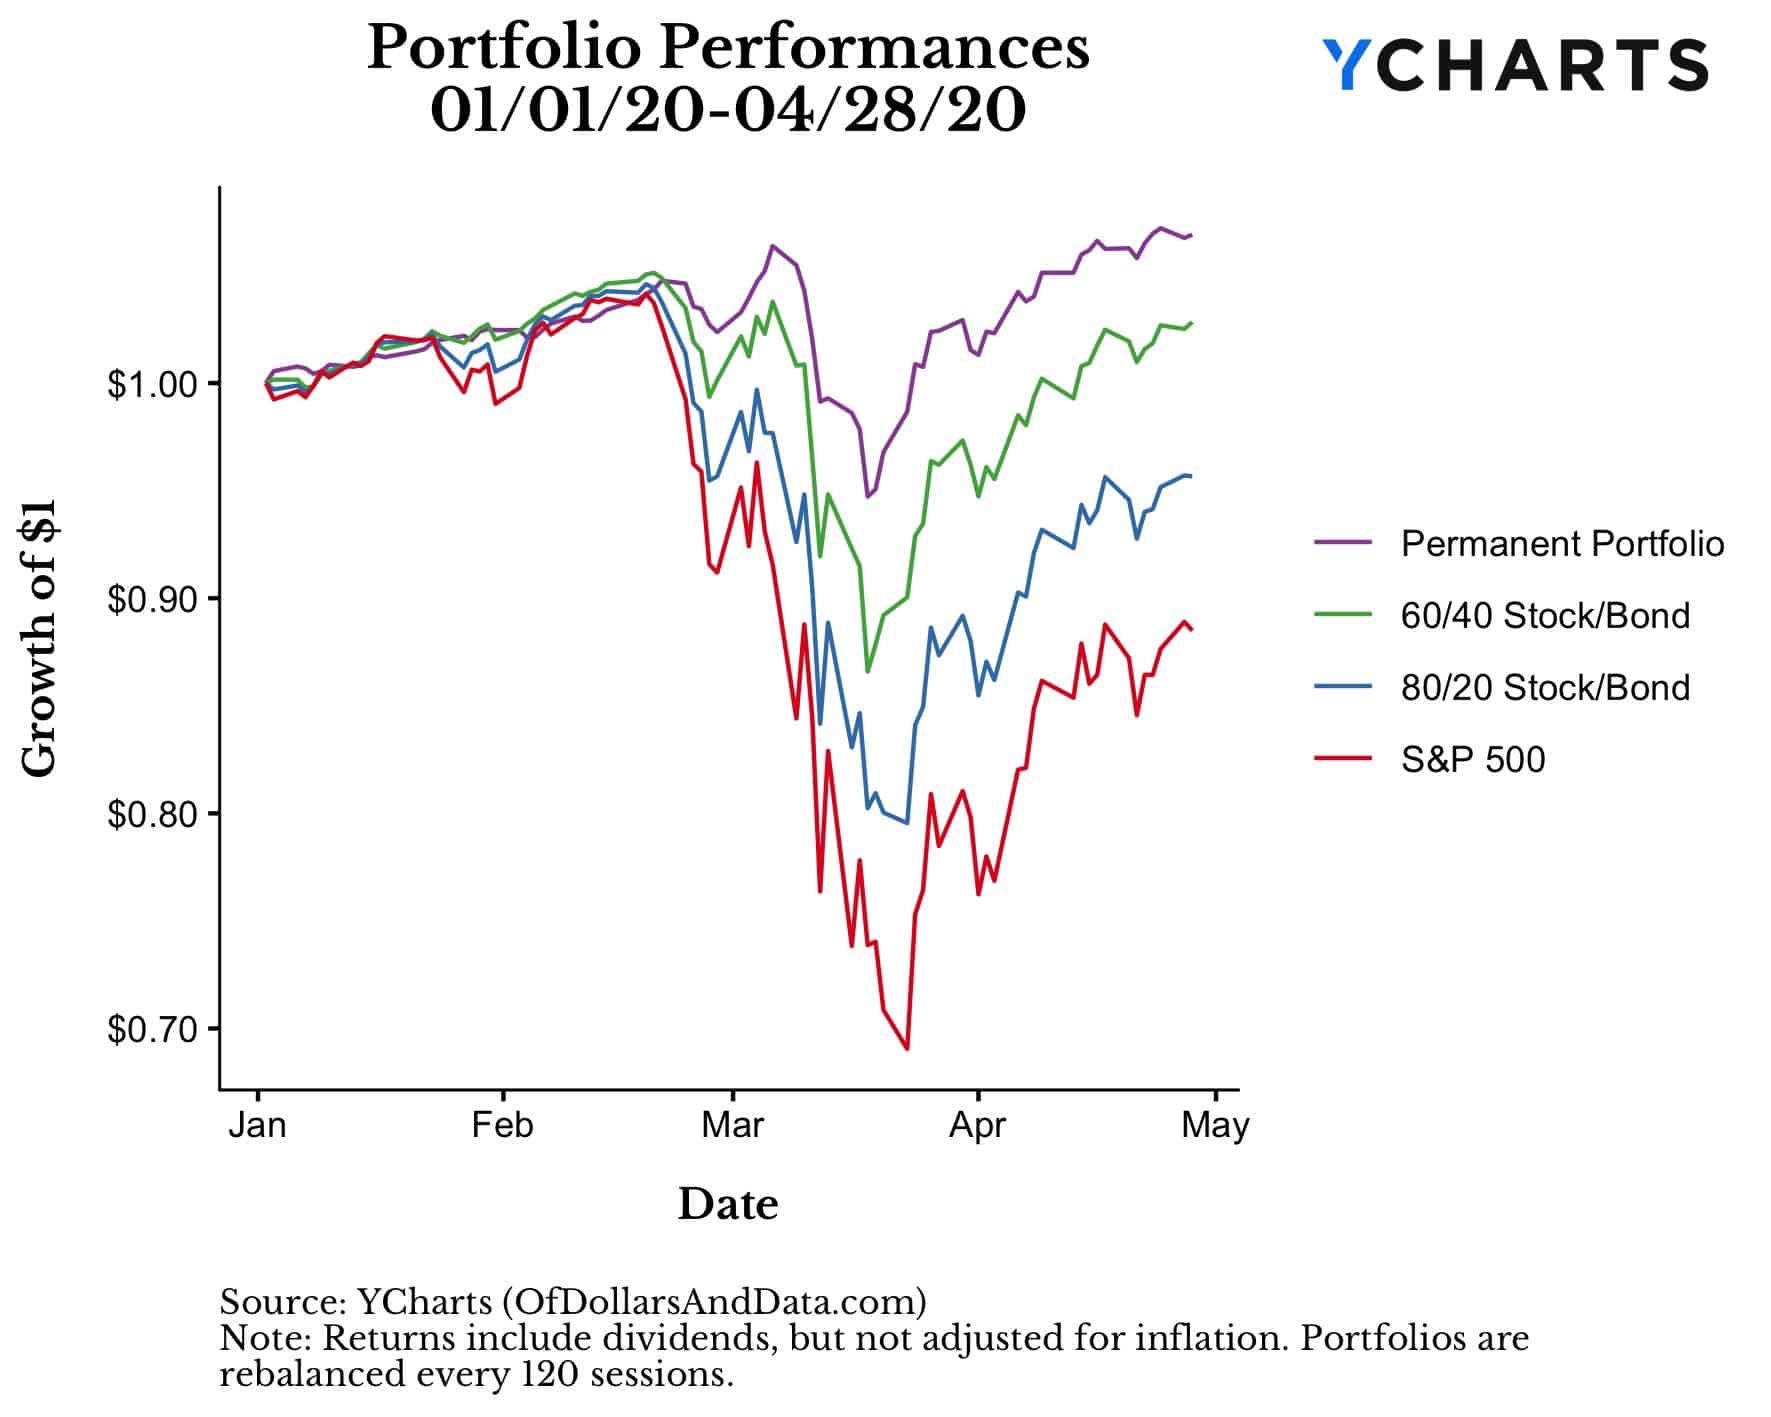
From this single chart we can see how risky each portfolio is during a panic, with S&P 500 being the most risky, the Permanent Portfolio being the least risky, and the combination portfolios (80/20 & 60/40) being somewhere in between.
And, if you guessed that the higher risk portfolios would also have higher returns, you would be right (in this case).
For example, if you look at how these portfolios performed since 1970 (using monthly instead of daily data and rebalancing every 6 months), you would see this relationship between risk and reward more clearly:
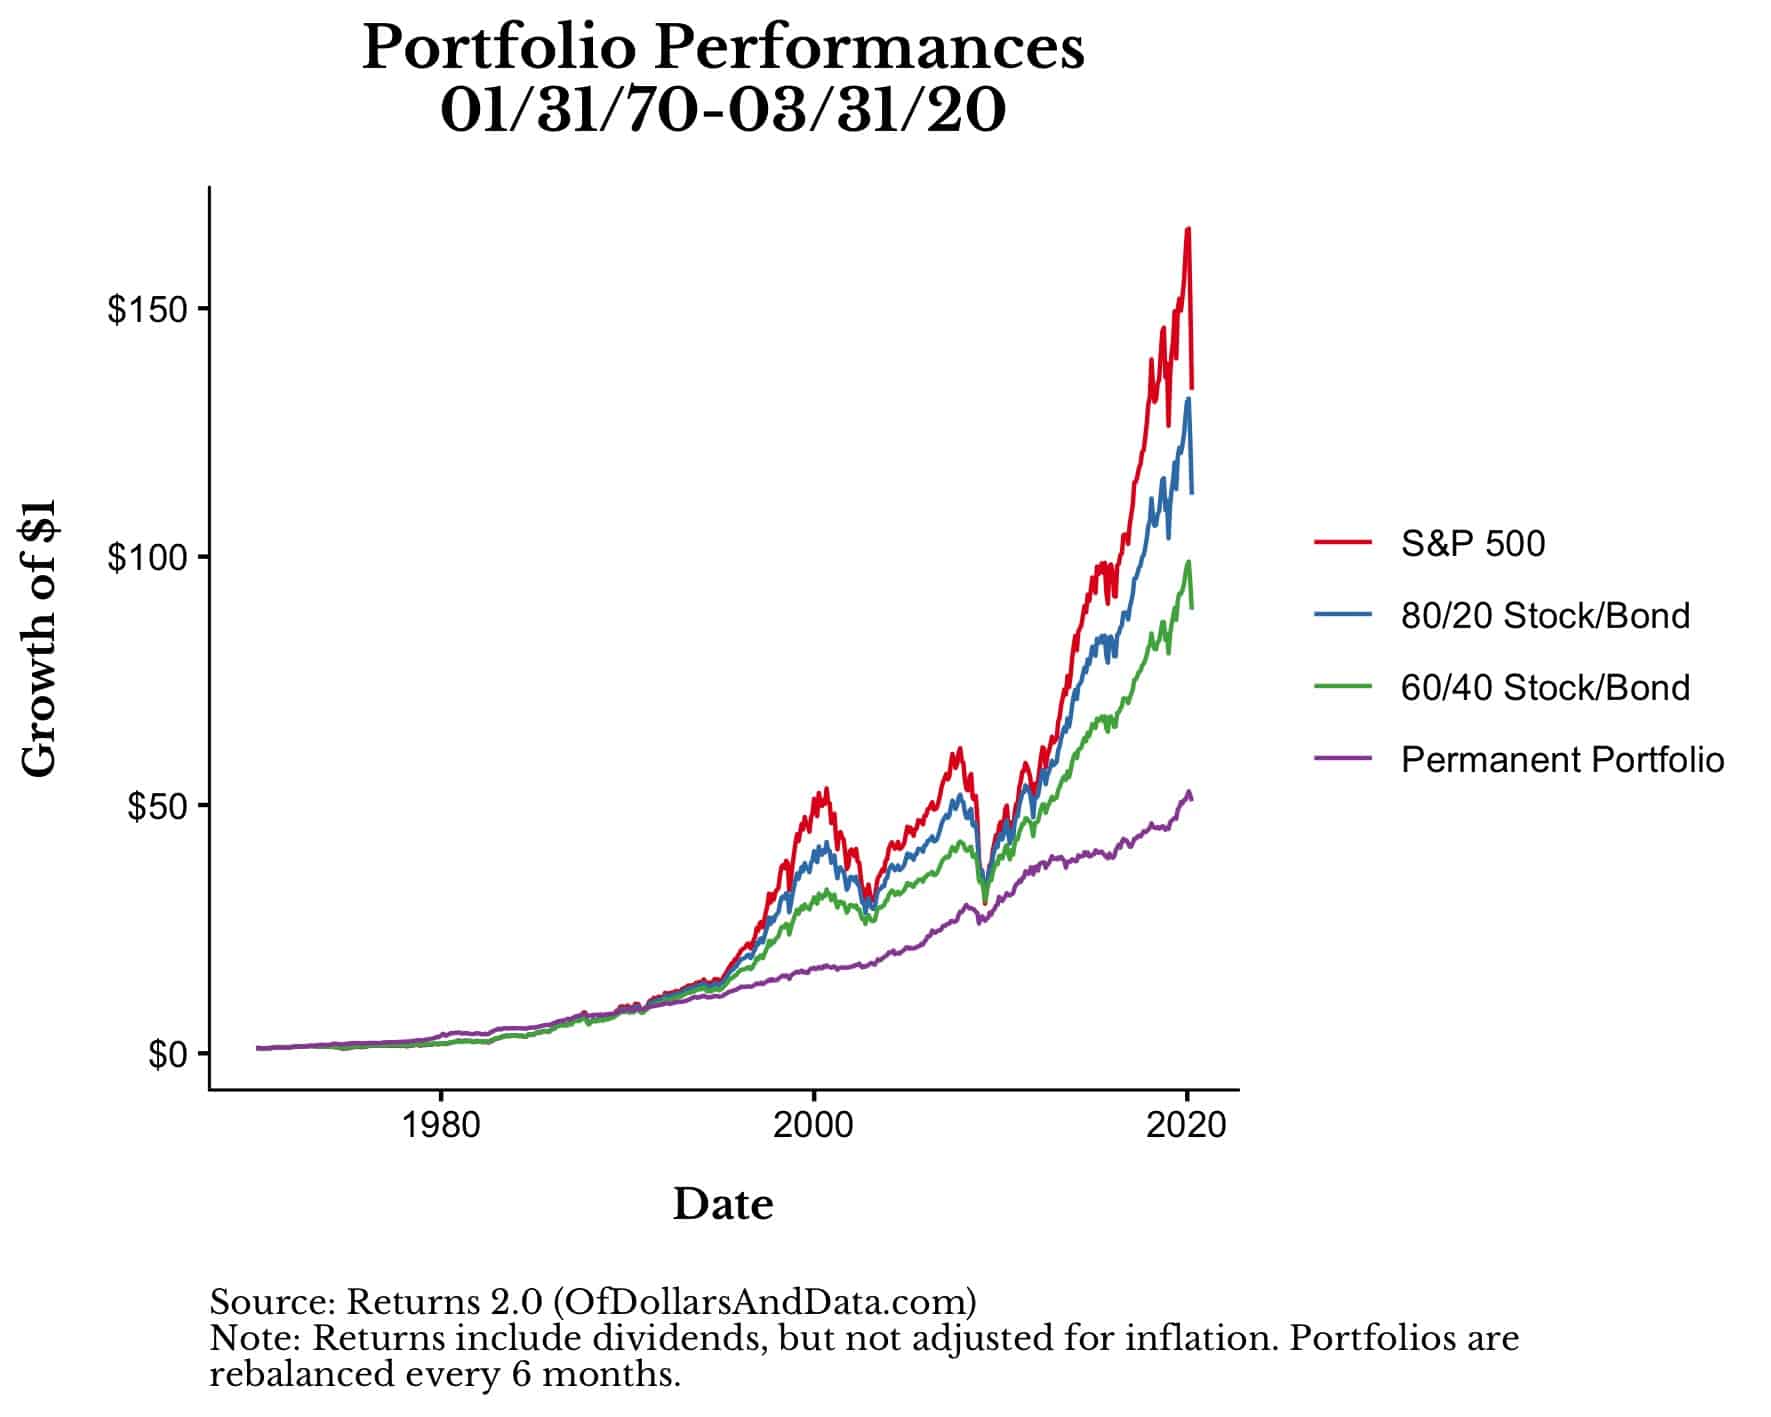
Over this time period, the riskiest portfolio (S&P 500) had the highest total growth while the least risky portfolio (Permanent Portfolio) had the lowest total growth.
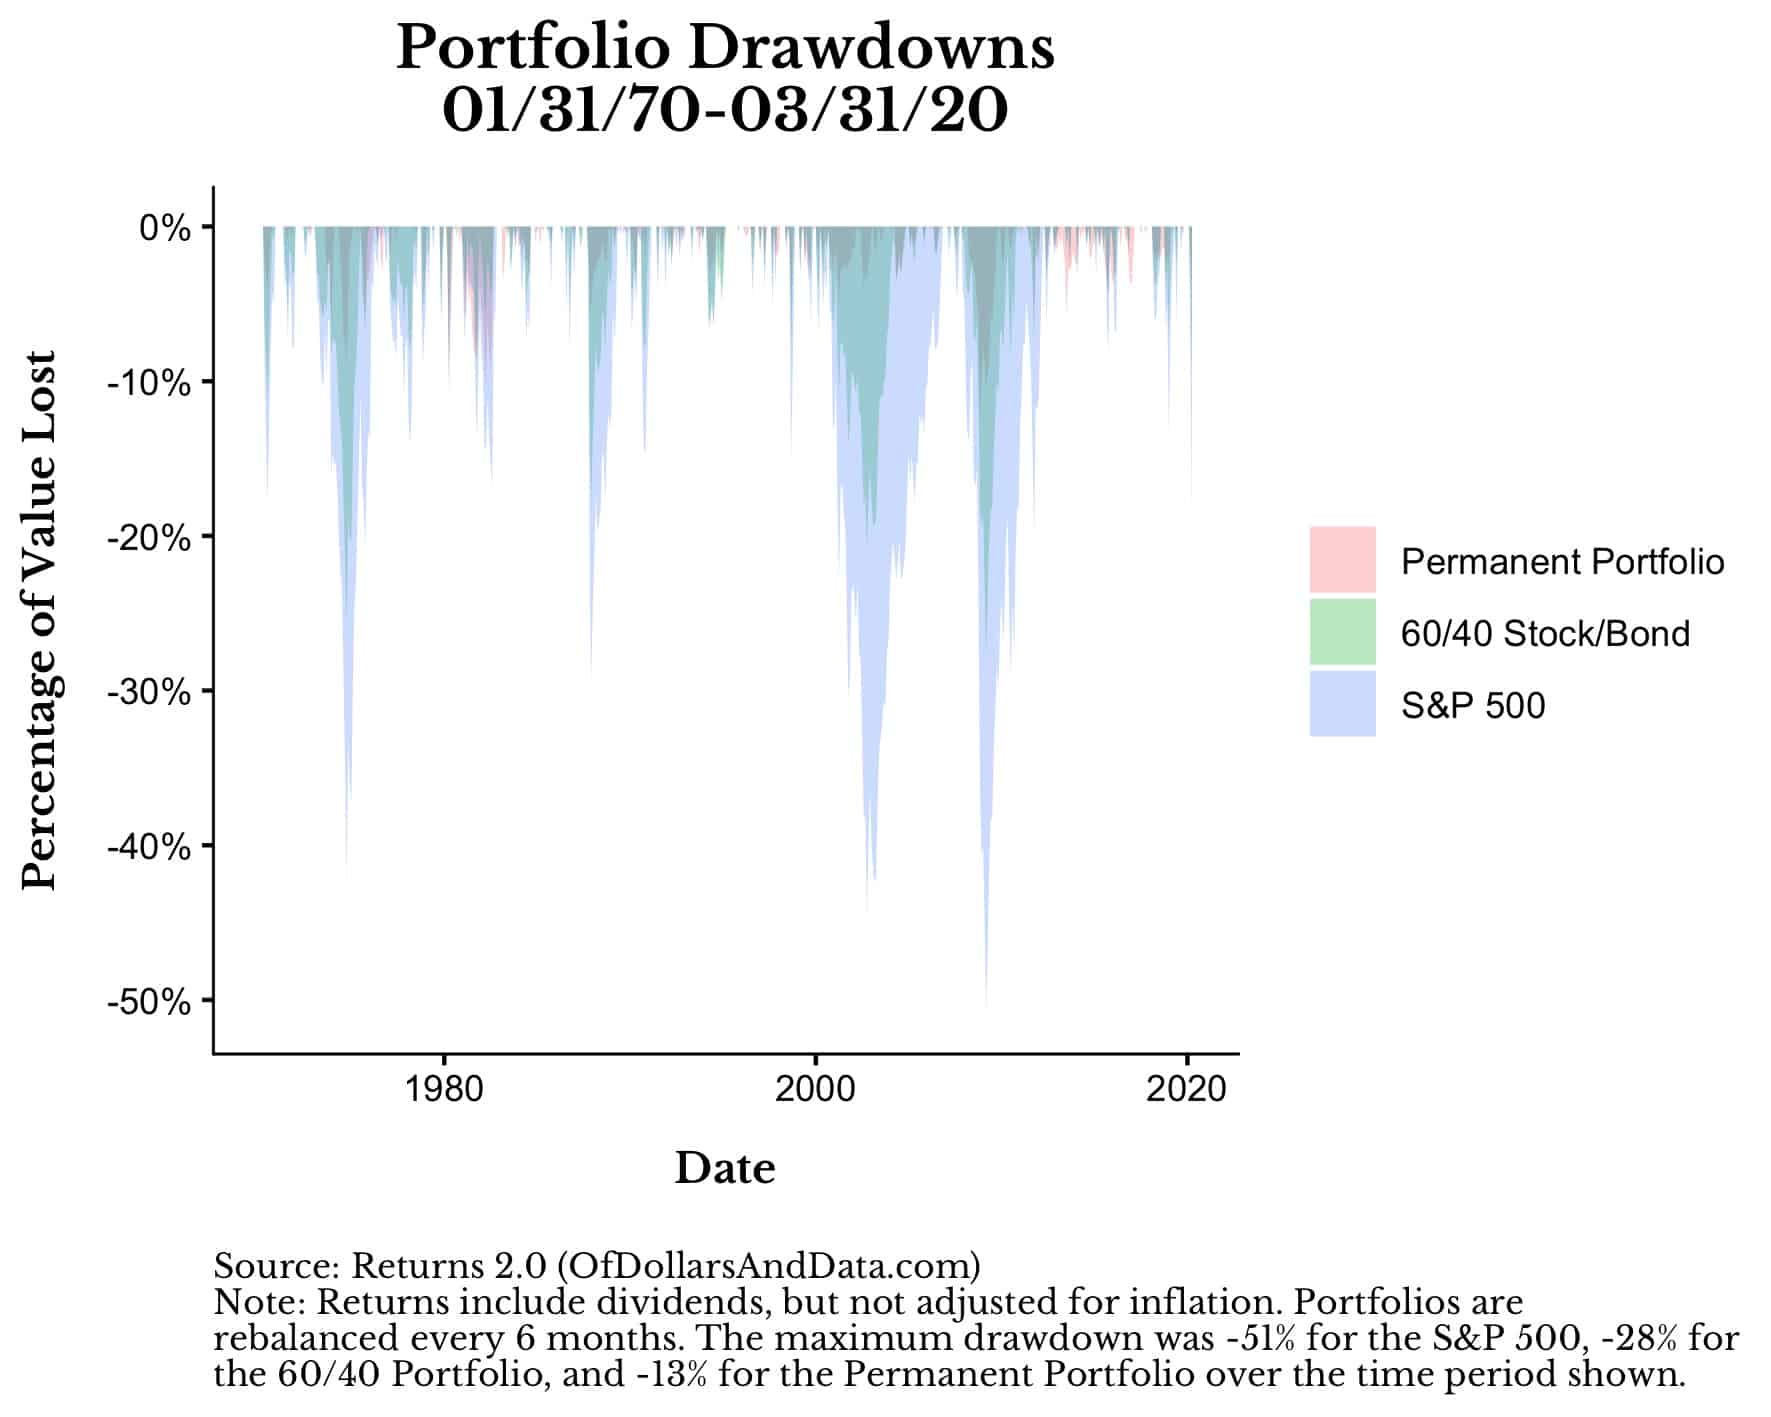
And how do I know that the S&P 500 was the riskiest over this time period? Because it had the deepest drawdowns.
From January 1970 until March 2020, the S&P 500 had a maximum drawdown of 51% while the Permanent Portfolio’s worst decline was only 13%:
From these charts you might conclude that you should choose your portfolio based solely on your risk tolerance. If you want more reward, you need to take more risk. Case closed, right?
While this is a pretty good starting point, it isn’t the full story.
The problem is that every time period is unique and it is hard to make generalizations about portfolios due to all the timing issues and events that can impact performance.
For example, if we invested $1 into each portfolio starting in 2005, the Permanent Portfolio would have taken the lead within a few years despite being the least risky portfolio:
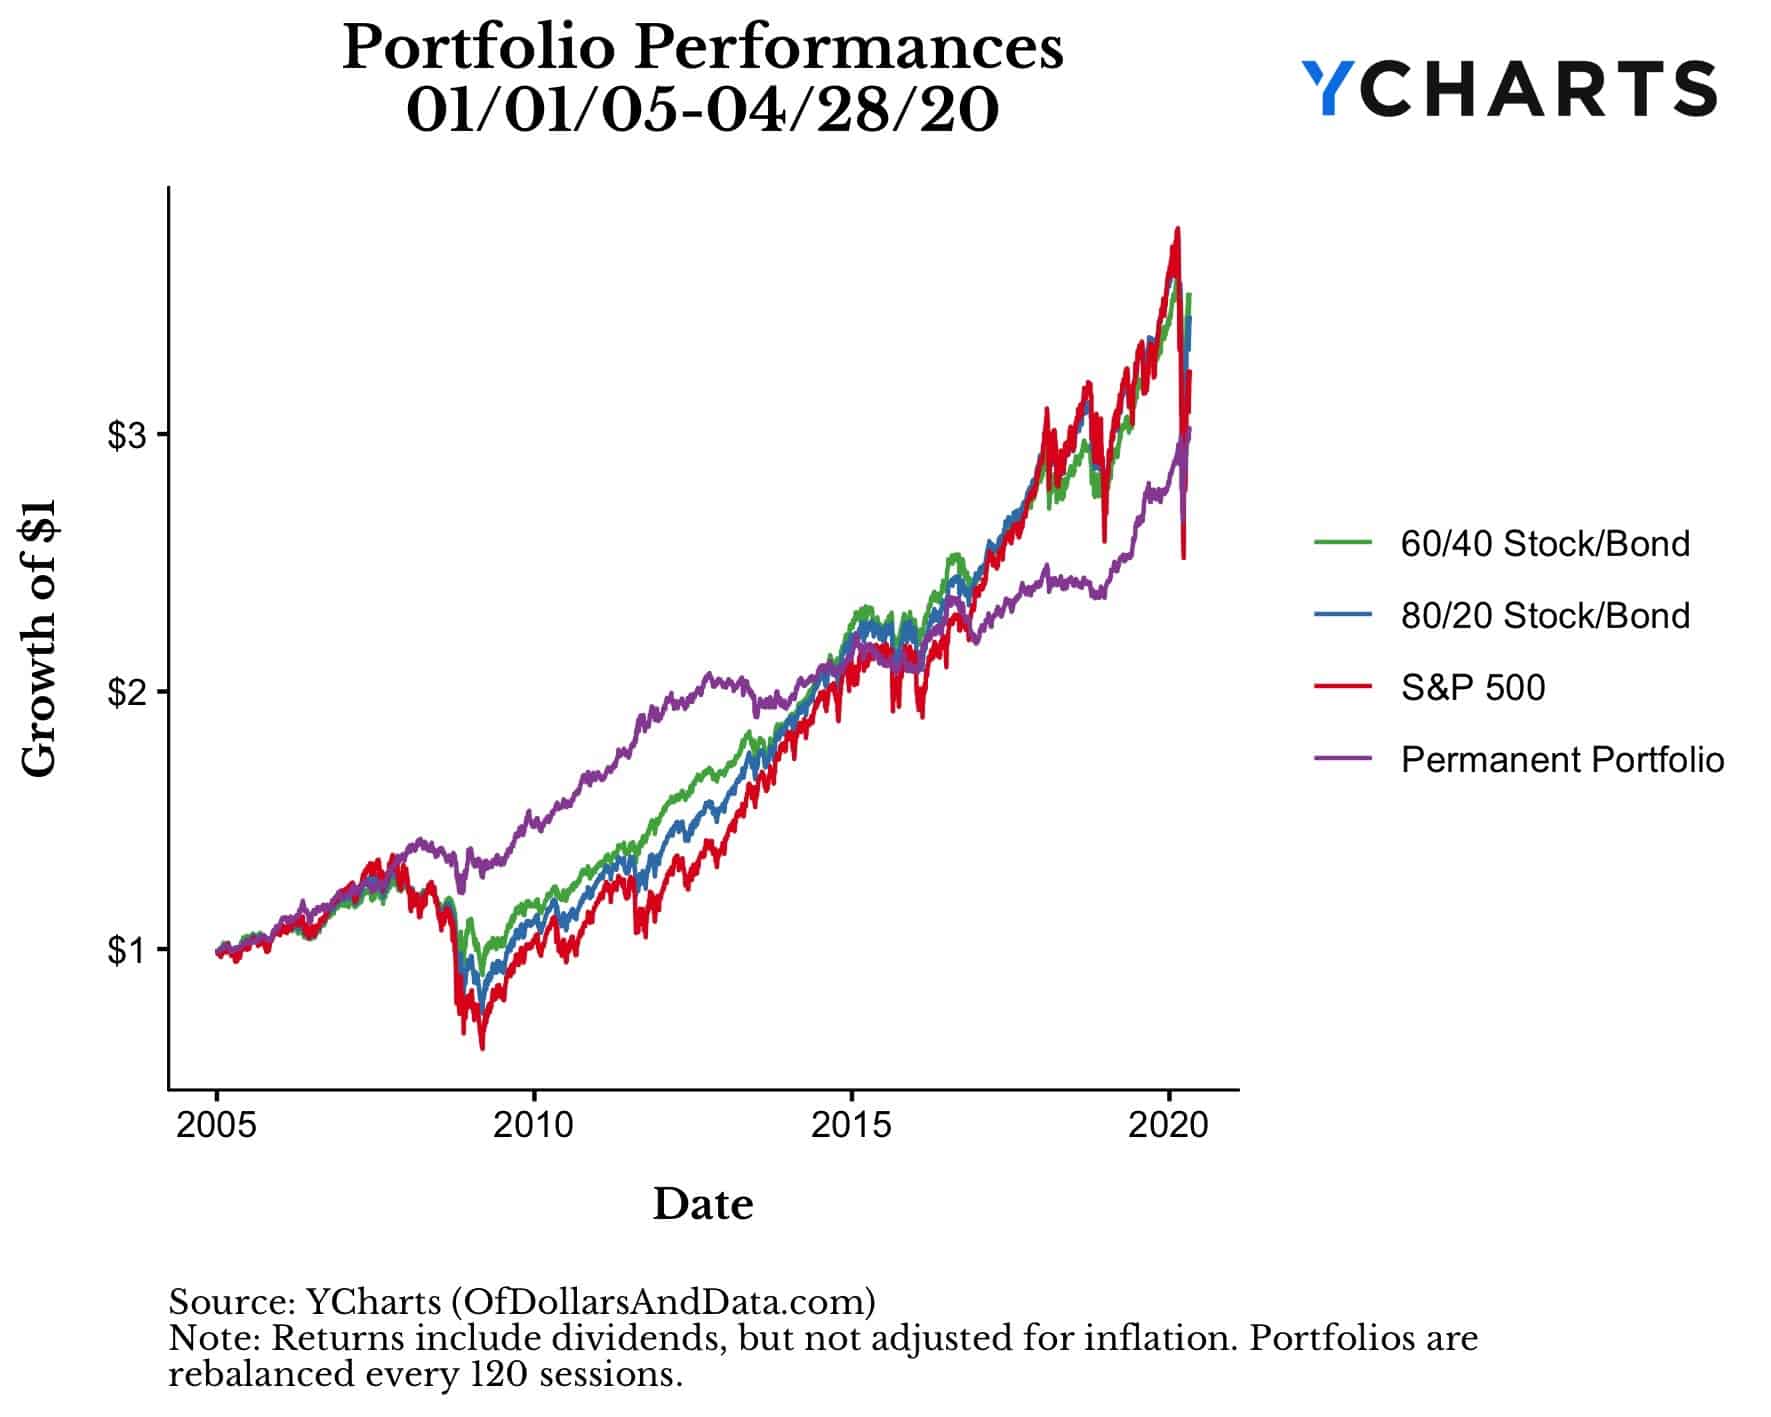
And while the lead built by the Permanent Portfolio couldn’t outlast the bull market of the 2010s, the recent coronavirus crash has changed the conclusion once again.
For example, if we take the above chart and zoom in on 2020 only, we can see that the Permanent Portfolio has basically had the same performance as the S&P 500 since 2005:
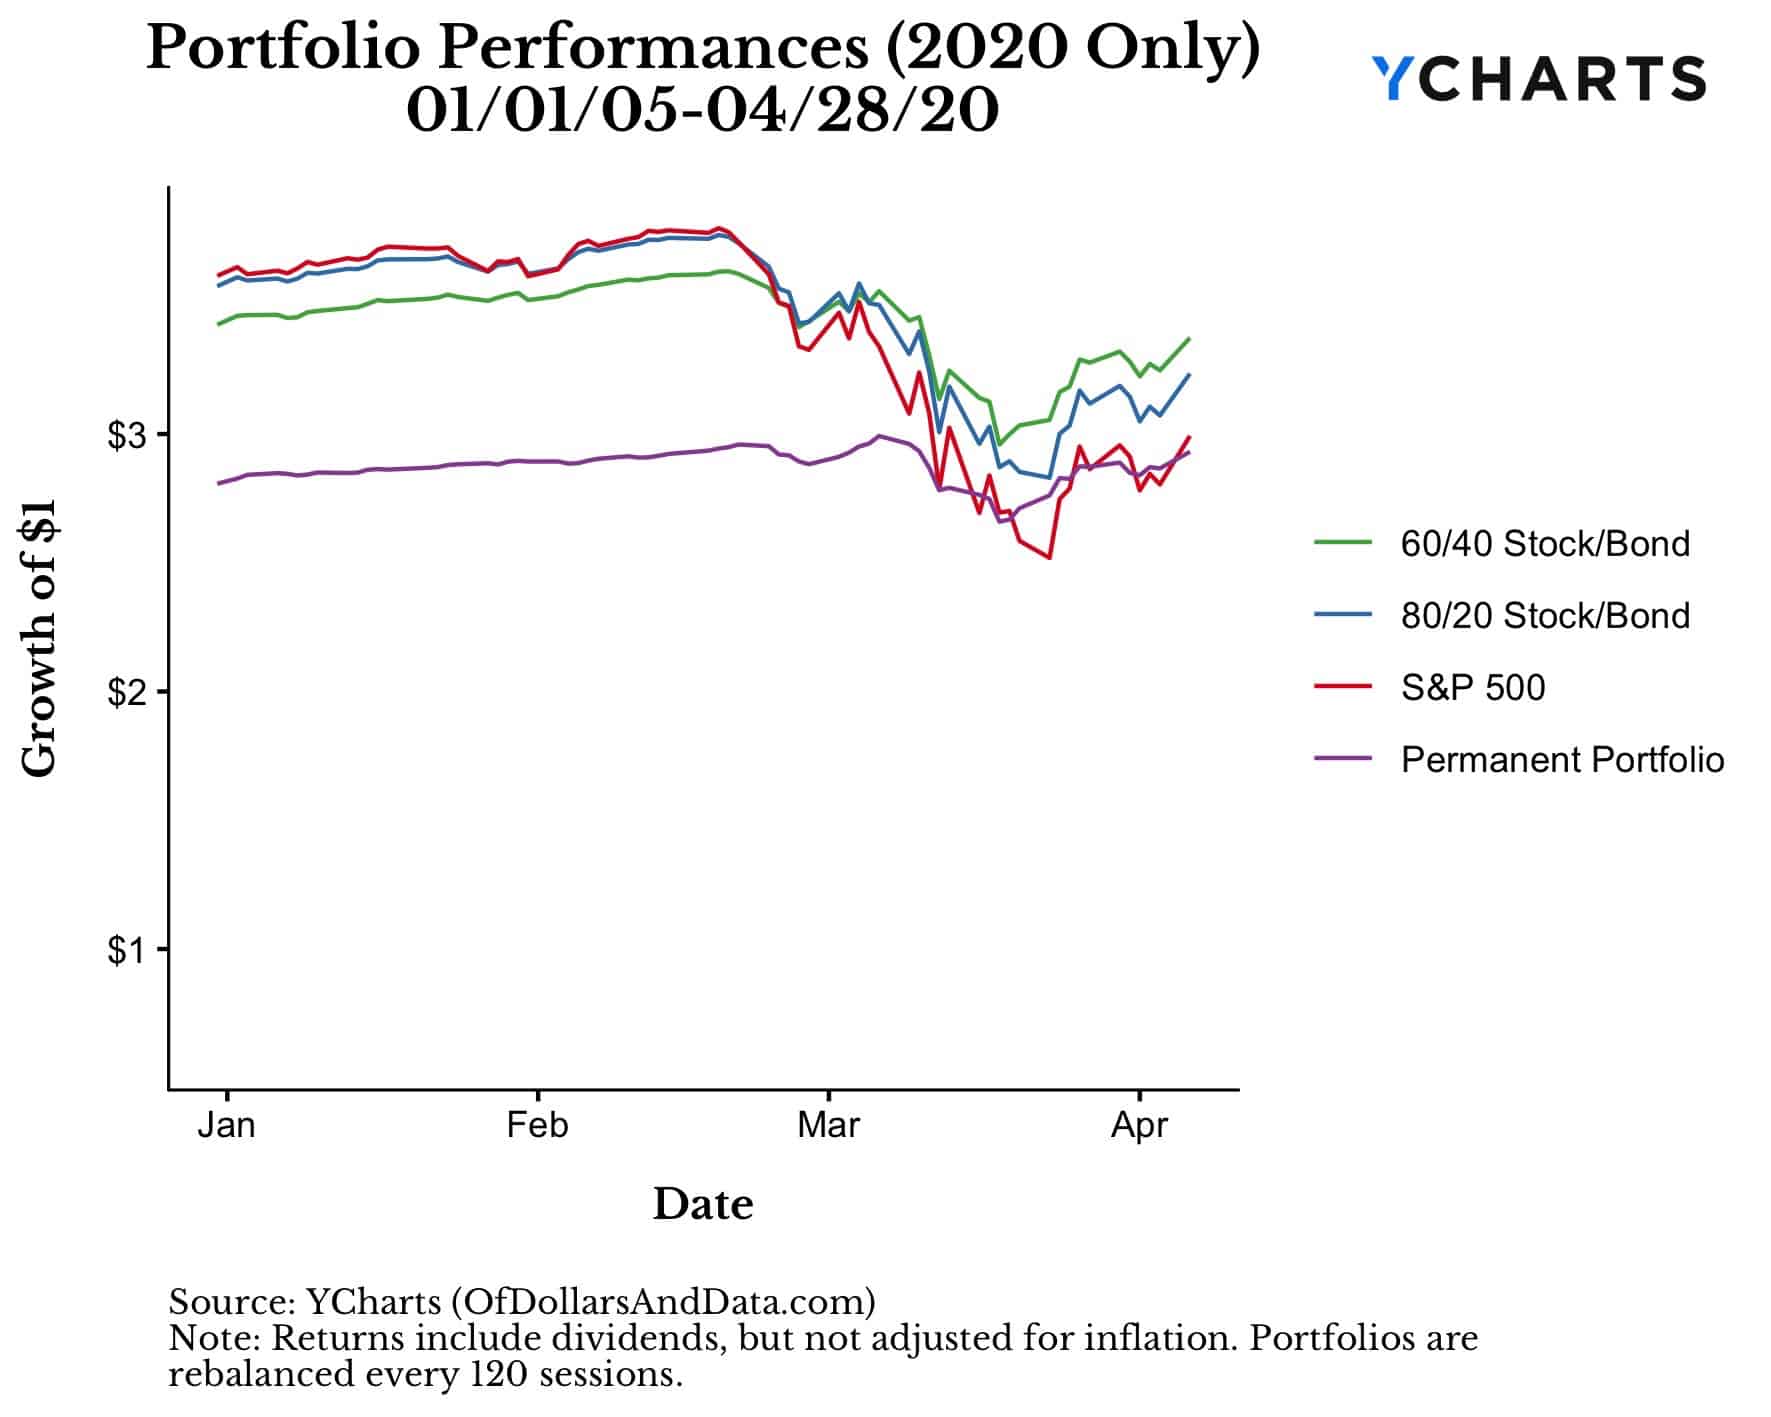
This is such a crazy result because, even after 15 years, a portfolio with 25% in cash (1-month Treasuries) and 25% in Gold has matched the growth of one of the best performing asset classes.
But, this analysis has a serious problem. It is biased by the time period we have used. For example, if we ended the analysis at the end of 2019, the story would be quite different from the one we tell today.
To adjust for this, let’s look at how these portfolios performed over all 1-year time periods from January 1970 to March 2020.
To do this I will rely on a boxplot where the top of the box is the 75th percentile portfolio return, the thick black line in the middle of the box is the 50th percentile portfolio return, and the bottom of the box is the 25th percentile portfolio return (note: the dots represent outliers):
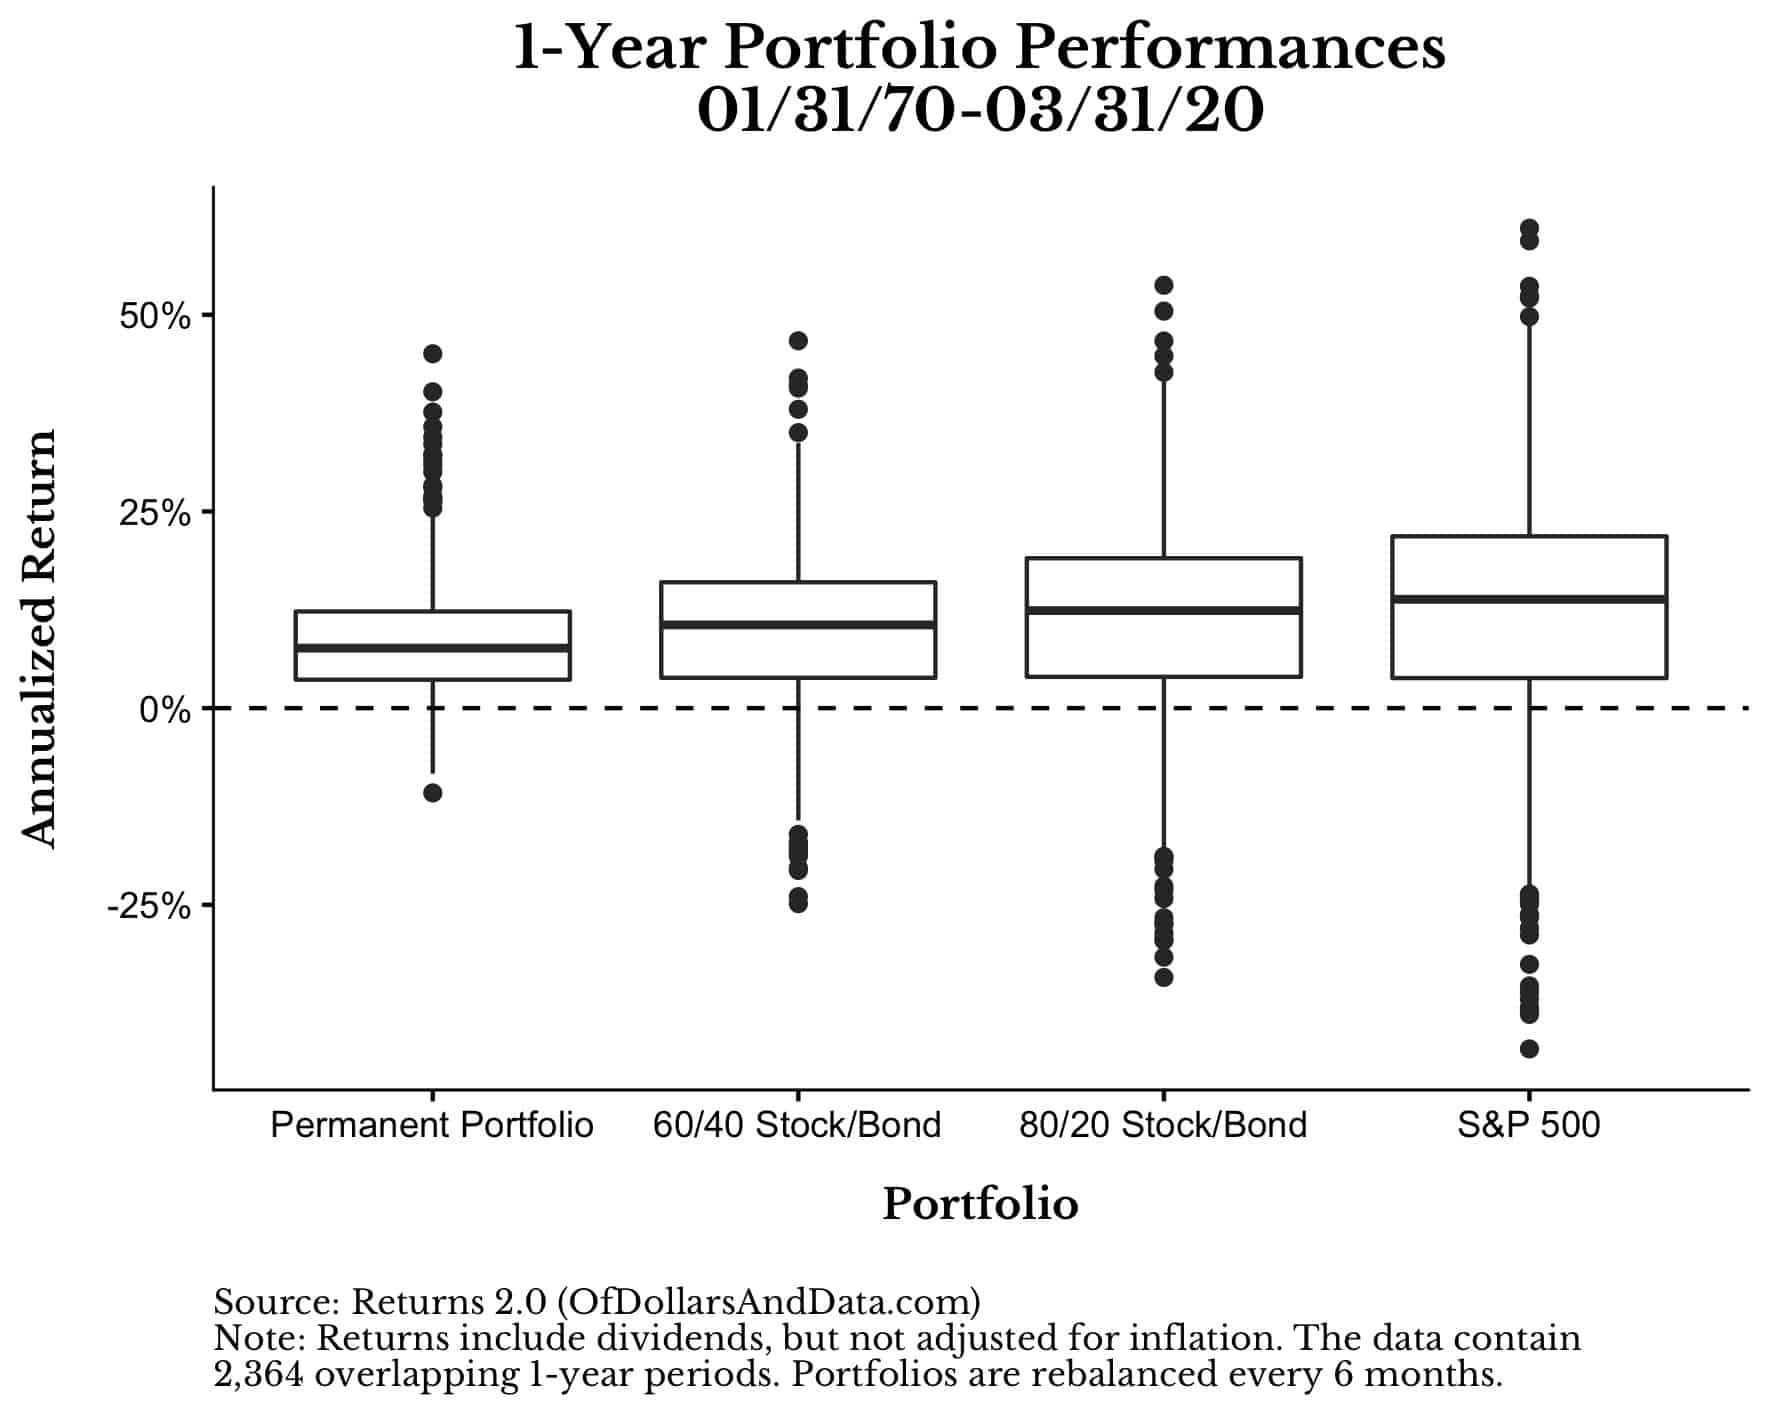
As you can see, these portfolios illustrate the risk-return relationship discussed earlier with the largest variances in outcomes accompanying the highest return portfolio (S&P 500).
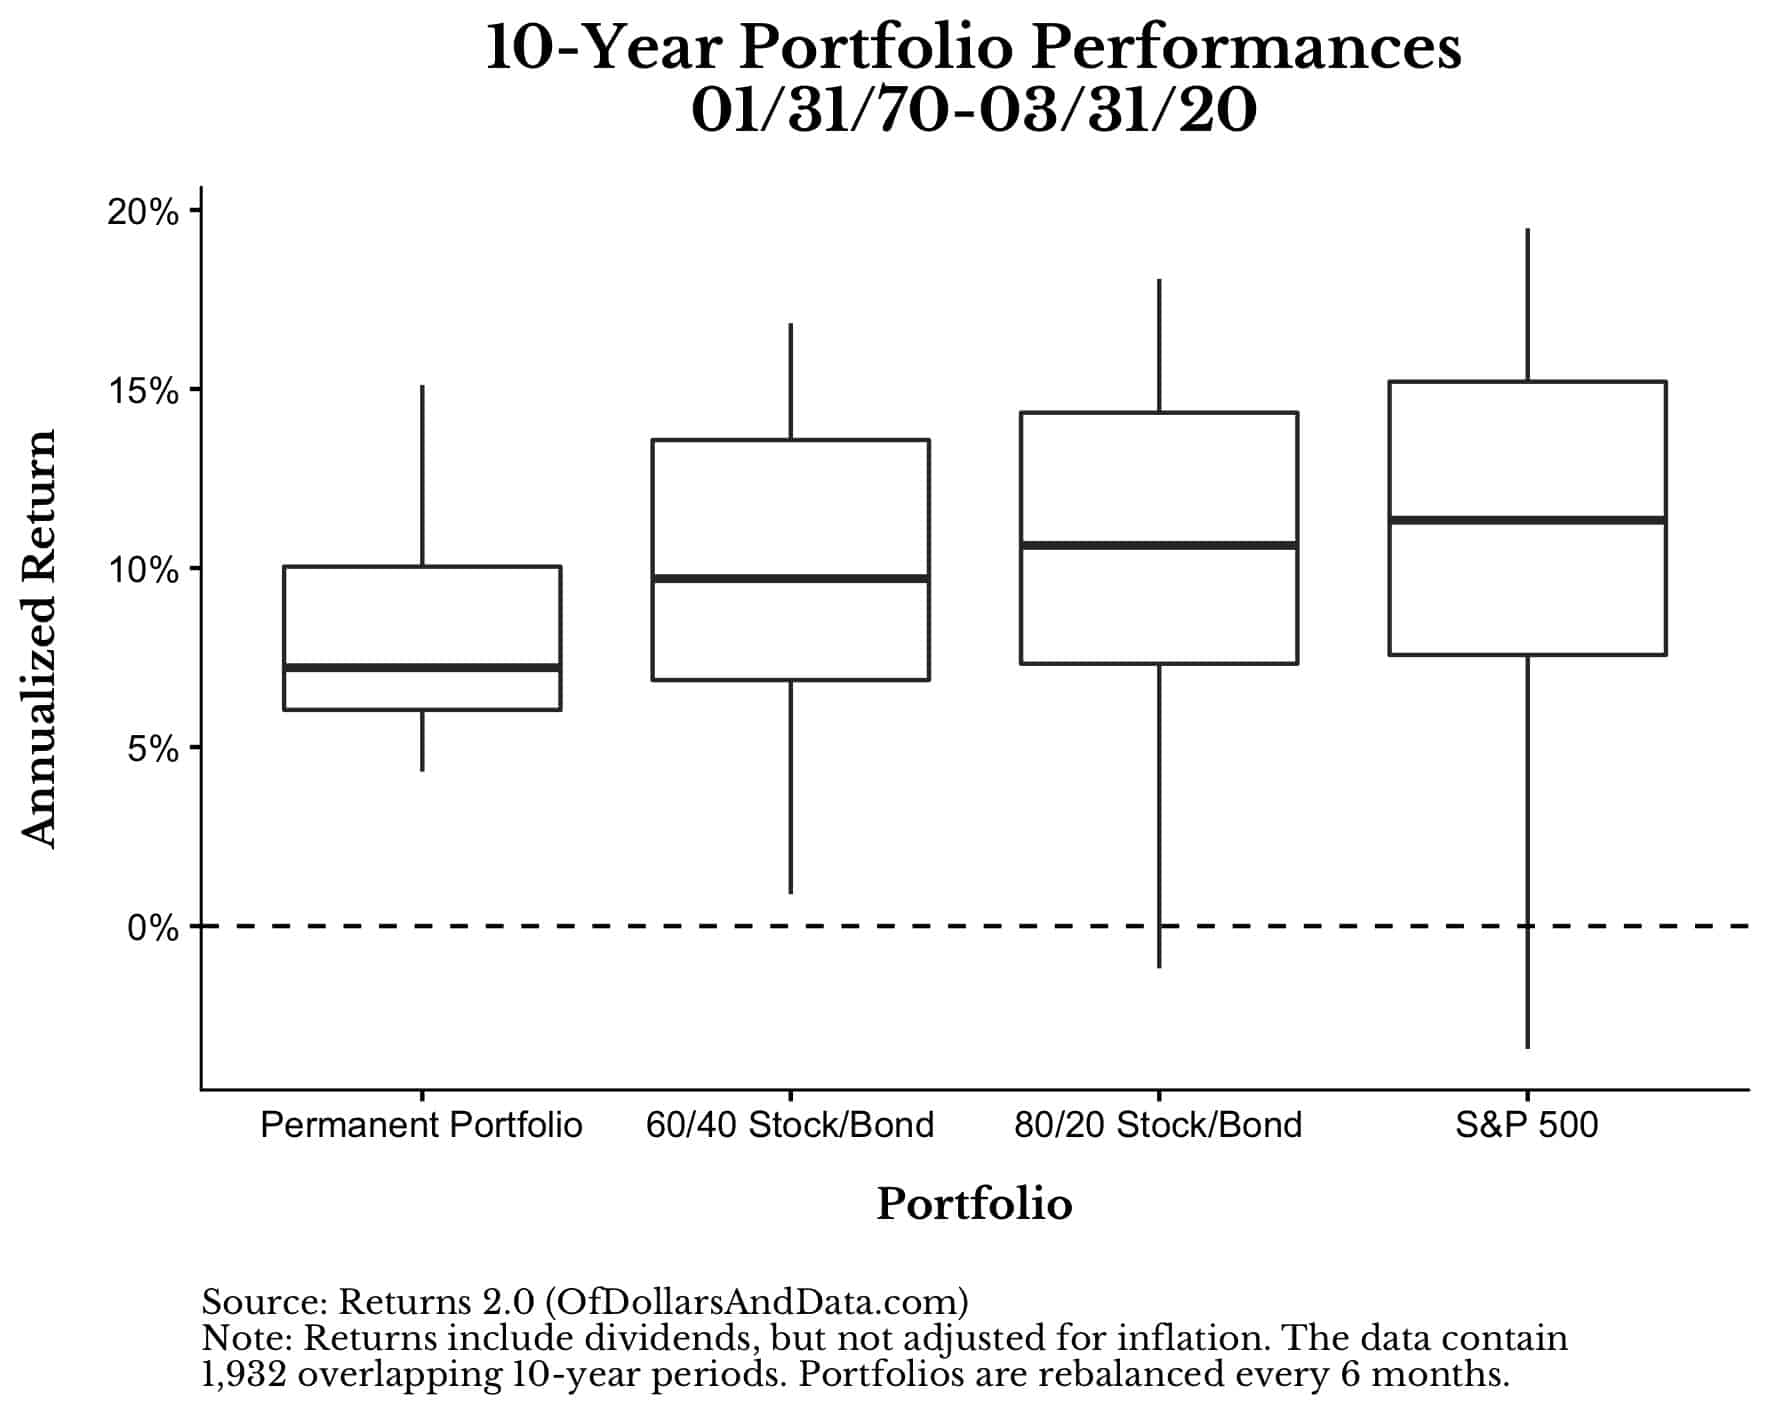
We see the same pattern if we look over 10-year return periods as well:
However, if we extend the investment period to be 20 years instead of 10, this relationship starts to fade a little.
For example, over all 20-year periods from January 1970 through March 2020, the 60/40, 80/20, and S&P 500 only portfolios all had very similar levels of return despite their different levels of risk:
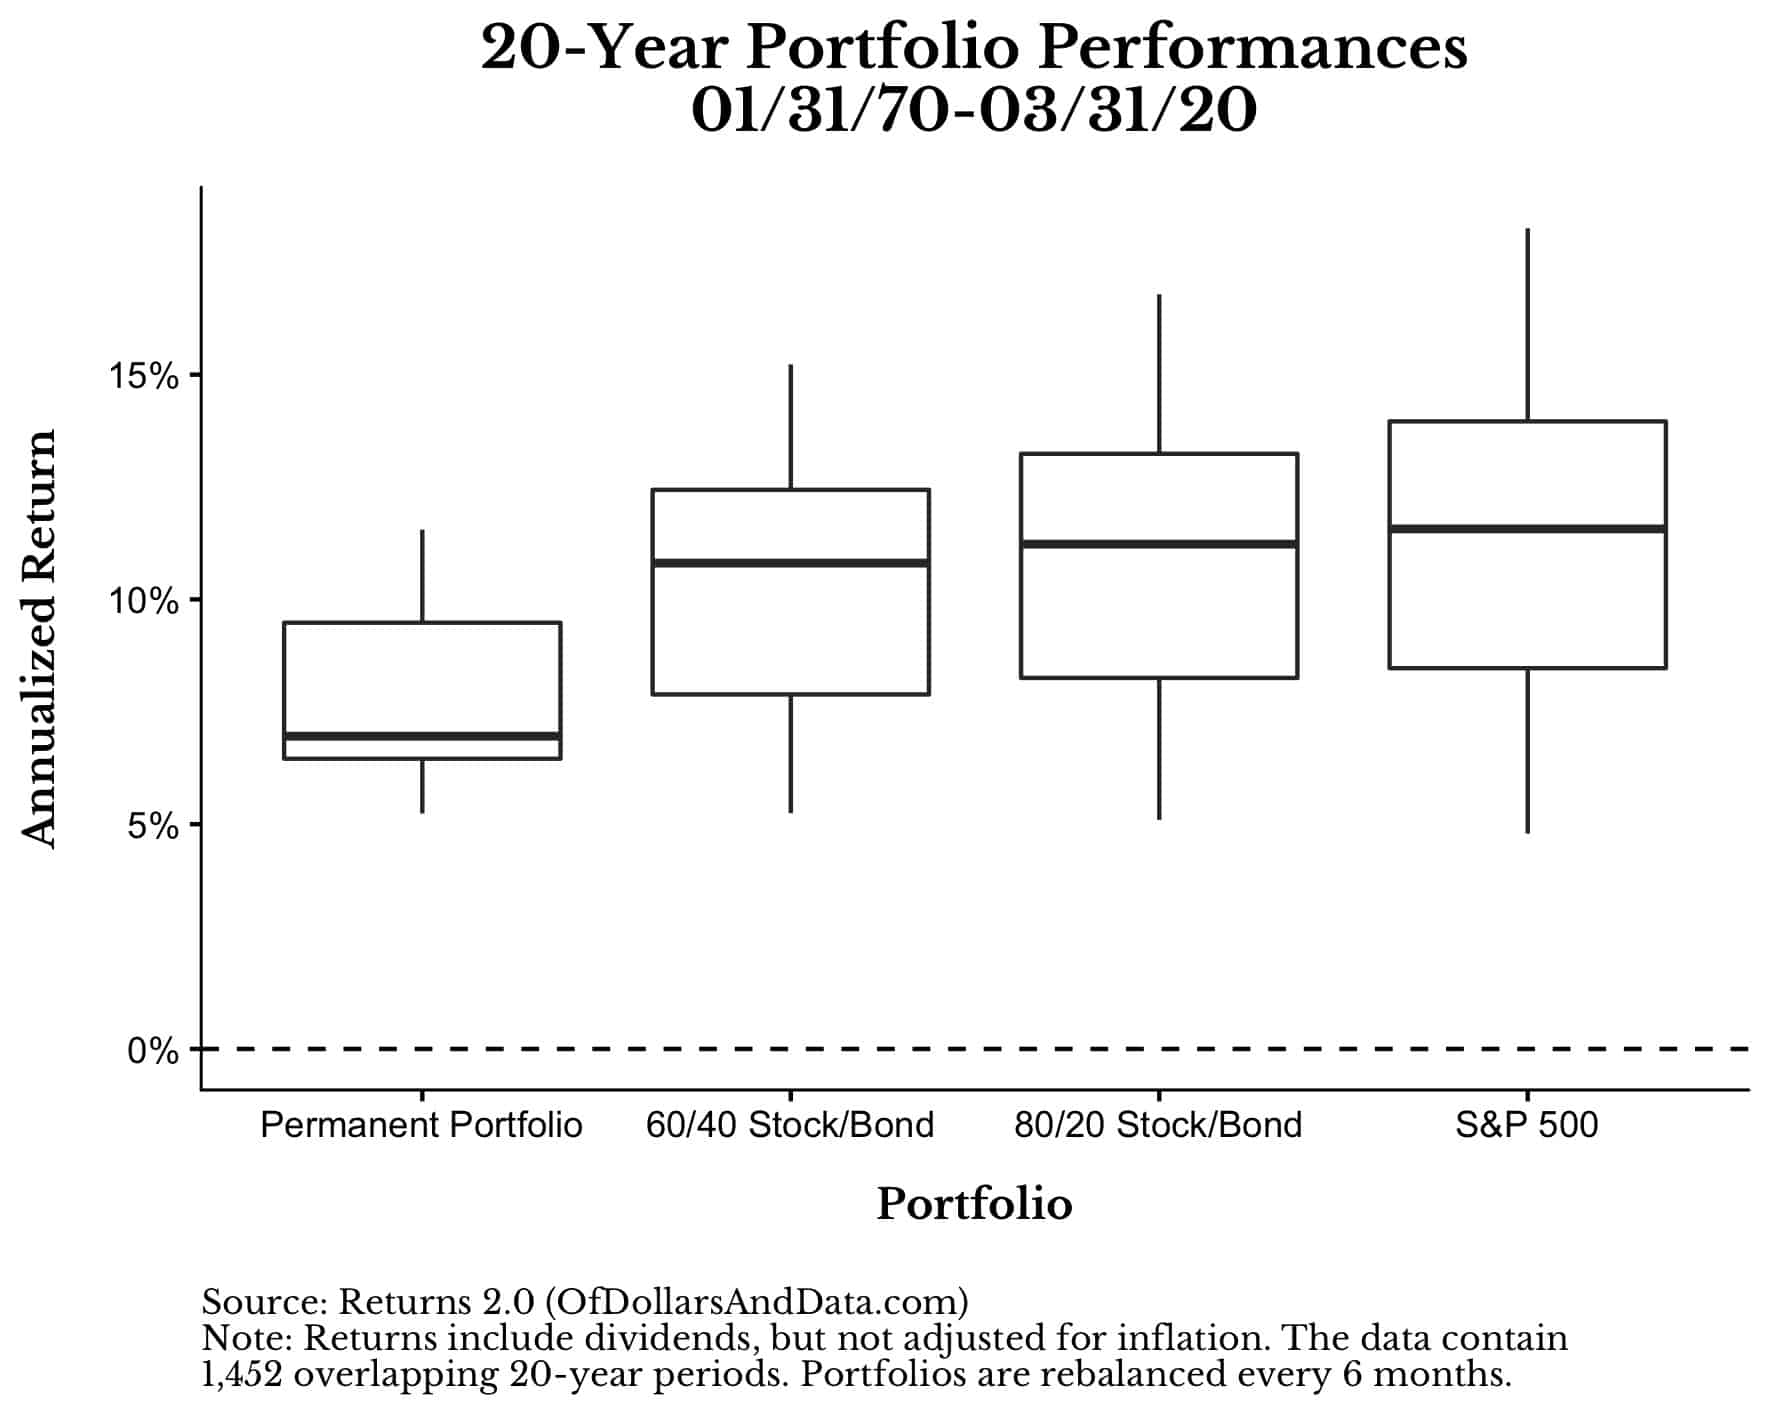
Looking at this, you might conclude that a 60/40 is the ideal portfolio because it has similar returns to the S&P 500 with much less risk.
But, once again, this analysis is biased by the time period we are using (1970-2020). How can it not be biased when the 1980s had the highest interest rates of the past few centuries?
Just look at this chart of the 10-year Treasury yield since 1970:
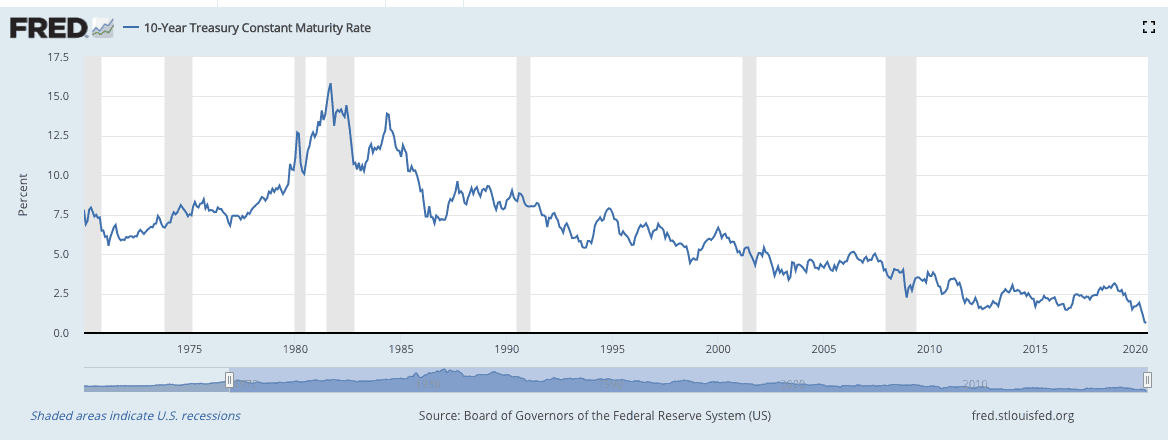
How can you see this collapse in rates and then conclude that future will be similar to the past?
You can’t.
So as much as I want to help the long time reader that inspired this post, I can’t in good conscience use the prior few decades as a benchmark for future bond performance.
In other words, the data in this post is useful for understanding the relative riskiness of the different portfolios, but not for projecting their future returns.
So which portfolio is right for you?
The one that you can stick to. Yes, that is the most cliché investment recommendation out there, but it’s true.
And to find the portfolio that you can stick to, you have to have some idea for the amount of risk you are willing to bear.
This is generally something that has to be experienced, and, fortunately, the recent coronavirus crash has provided many of us with such an experience.
So, if you felt any sort of skittishness during the past few months, then take less risk in the future. And if you didn’t feel any fear at all while markets tumbled, then maybe you need to be taking on more risk.
But the risk-reward relationship is just the tip of the iceberg…
Your Portfolio Will Always Be Wrong
Once you decide on a particular portfolio, your work is far from over. Because, as time passes, you will question your allocation. This is completely natural.
Why? Because if you have any sort of diversification in your portfolio, you will see some of these assets underperform and some of them lose money. It’s not a matter of “if” but a matter of “when.”
For example, I wrote a post about how even an optimal portfolio loses money in 25% of all years. And remember, this optimal portfolio was created by overfitting historical data to find the highest return-per-unit-risk portfolio possible.
So if this portfolio loses money in 25% of all years and usually has two assets losing money in every year, then what more can you expect from your portfolio?
This is why your portfolio, if it is sufficiently diversified, will always be wrong. One (or more) of your asset classes are likely to lose money or underperform their benchmark.
The important thing is whether you can stick to it so that you can achieve your financial goals.
Thank you for reading!
If you liked this post, consider signing up for my newsletter.
This is post 183. Any code I have related to this post can be found here with the same numbering: https://github.com/nmaggiulli/of-dollars-and-data

