It’s been a little over six weeks since the S&P 500 officially entered a bear market and U.S. stocks are still 17% below their all-time highs. Naturally, you might be wondering whether our current crash is worse than the one we experienced in March 2020. On technical terms, the answer is “No.” After all, at it’s lowest point the S&P 500 was 33% off its highs in March 2020 compared to only 24% at the lowest point of current decline.
However, I don’t think the severity of the decline tells the full story. For example, if you adjust for the 9% inflation we’ve had over the past year, then both declines are nearly identical in real terms. Or, if you were to consider the length of each decline, then our current crash is much worse. You have to remember that the March 2020 decline took place in less than six months. That’s high to low to new high in under 180 days! Yet, our current decline is in its seventh month and no one knows when it will end.
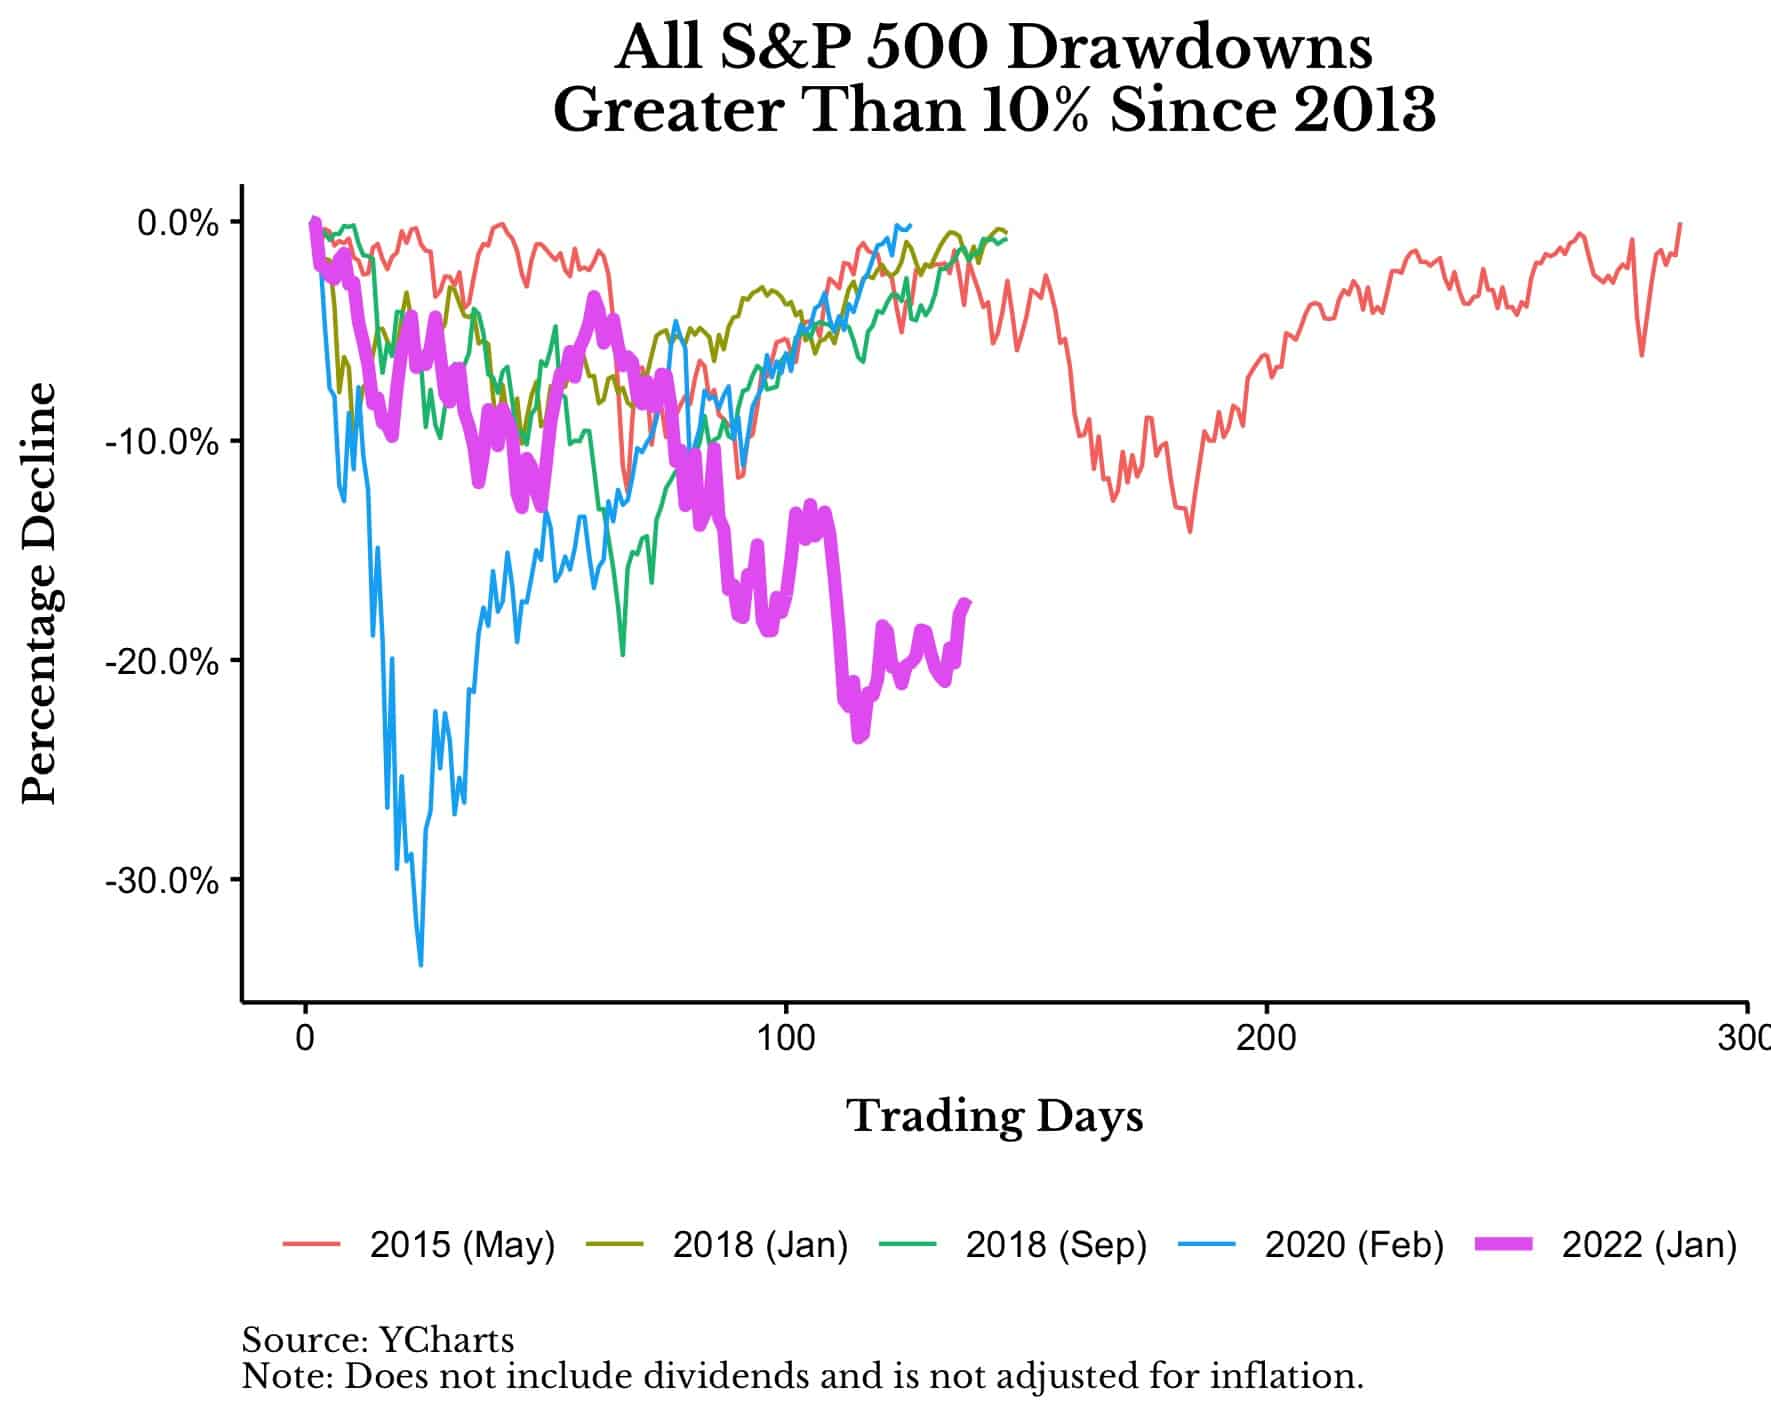
To visualize just how rough our current decline has been, I have plotted all the major drawdowns in the S&P 500 since 2013 below. As you can see, after controlling for length, we are currently experiencing the most severe crash of the past decade:
But it’s not just the decline in asset values that is worrying investors. The rapid rise in consumer prices (i.e. inflation) have also played a role. This explains why 2022 feels a lot worse than March 2020, even though other economic indicators (i.e. unemployment) haven’t been as extreme. The AAII Investor Sentiment Survey supports this feeling as well. Earlier this year they reported that 59.4% of investors were bearish (the most since March 2009).
If I had to guess, most of this bearish sentiment is related to inflation. After all, inflation is much harder to ignore than a stock market decline. You don’t have to check your portfolio every day, but, every time you fill up at the pump or buy food, inflation is staring you right in the face. More importantly, that inflation is affecting money that you have now, whereas a stock market decline affects money that you probably won’t need for decades. One is present value, the other is future value. And losing present value is far more painful.
Nevertheless, despite the current state of market misery, there is one data point that suggests that the worst may be behind us.
Why This Crash Might Be Over Sooner Than We Think
After examining our current crash and the crash of March 2020, I discovered a striking similarity in how stocks declined on their way to the bottom. Of course, our current crash may not have found the bottom yet, but based on the data I’m about to show you, I’m hopeful it has.
To demonstrate this, below I have plotted when stocks in the S&P 500 hit their first 52-week low during the March 2020 market crash. As you can see, most stocks didn’t hit their initial 52-week low all at once, or even on the day of the actual bottom (March 23, 2020), but in a series of days leading up to the market bottom:
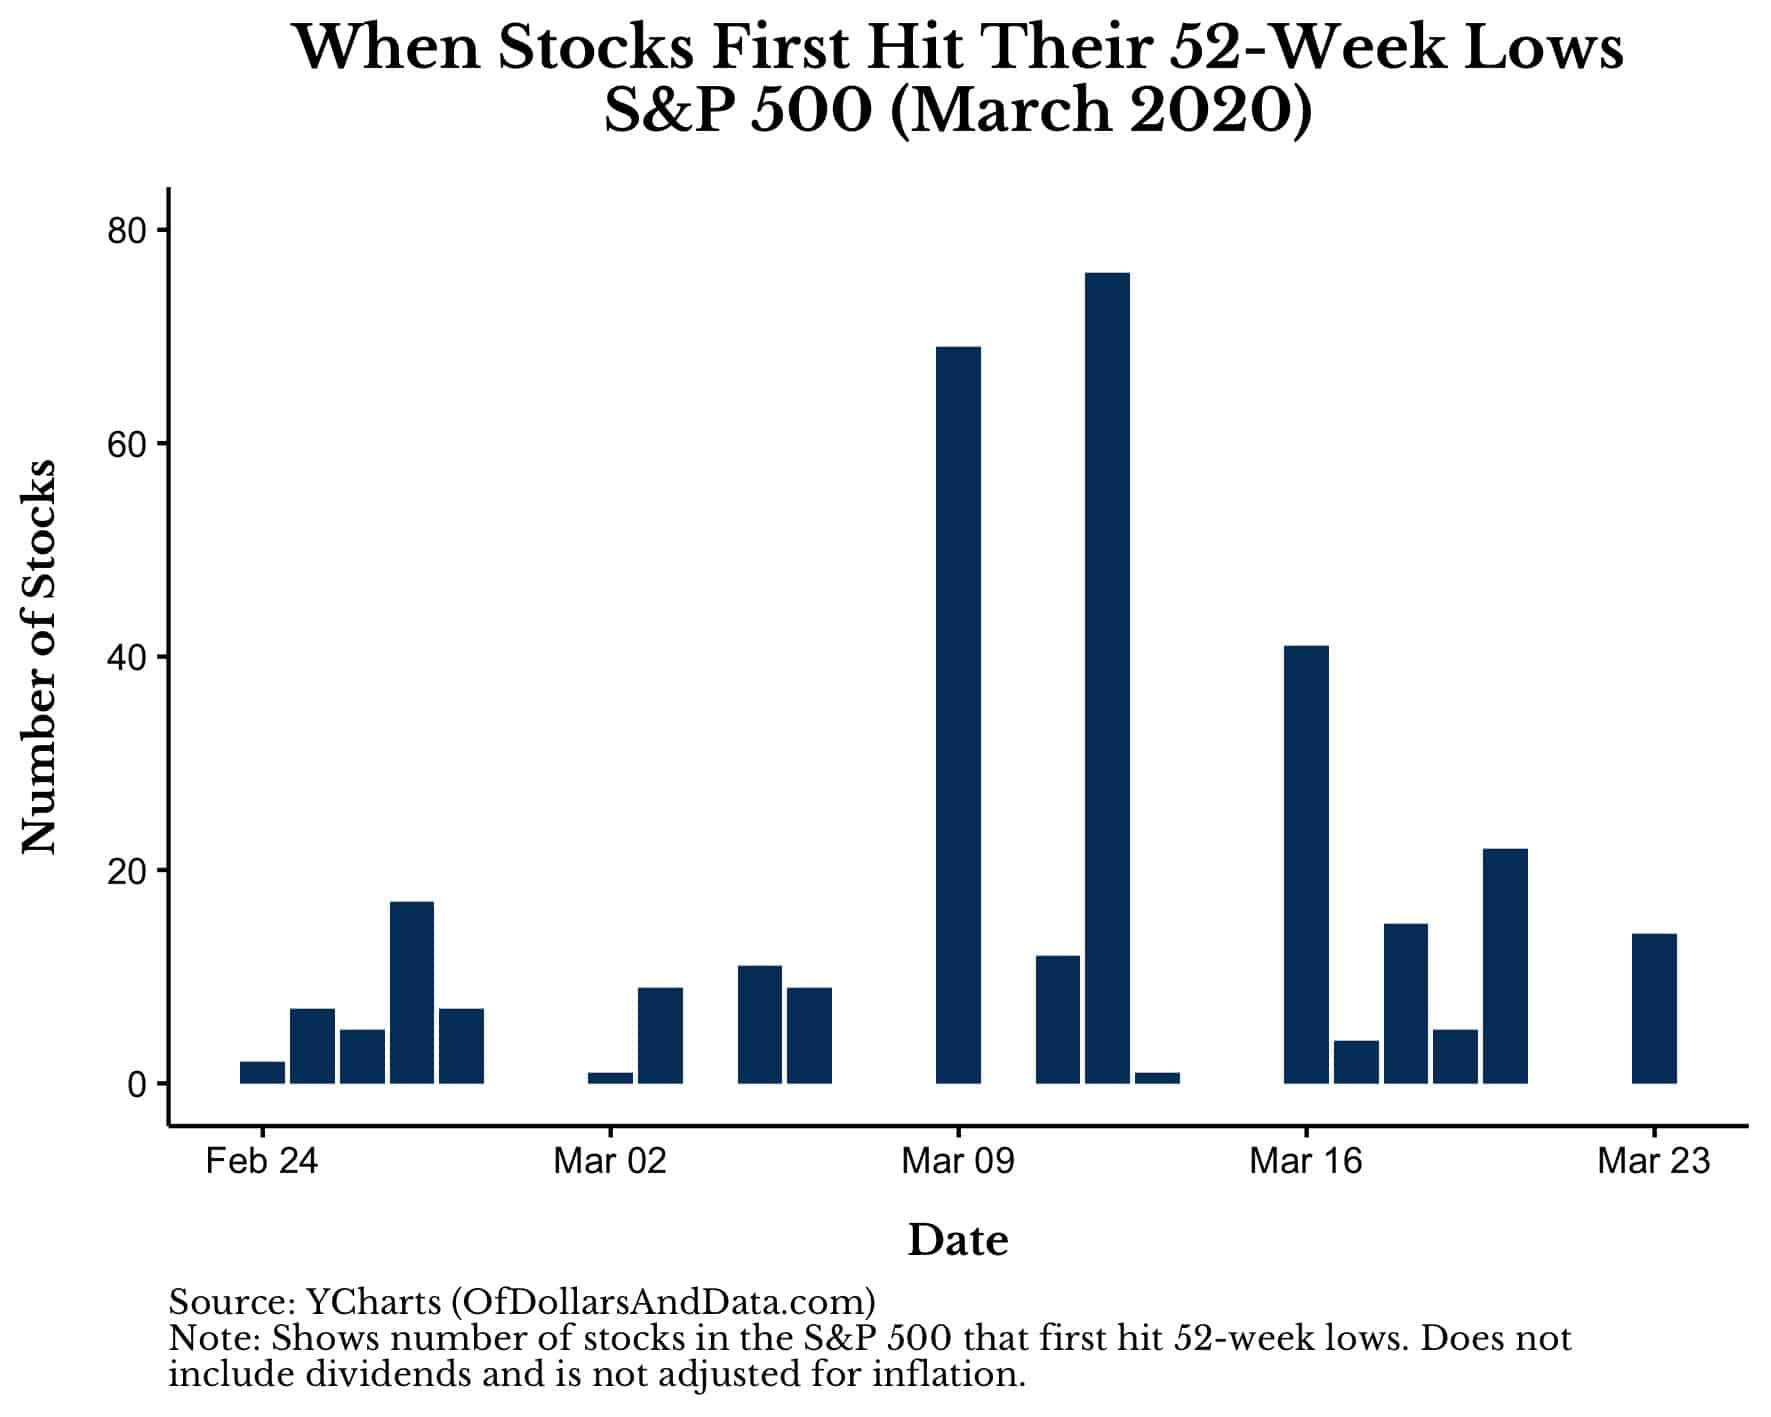
But that’s not really that interesting. Of course some stocks have to hit 52-week lows before they can hit lower 52-week lows on the way to the bottom. But what is interesting is how it happened. As you can see there was an initial spike of stocks hitting their 52-week lows on March 9, then more stocks hitting their lows a few days later, followed by smaller spikes until the day of the bottom on March 23, 2020. In total, 327 stocks in the S&P 500 (~65%) hit a 52-week low (at some point) during the March 2020 crash.
But how does this compare to this year’s crash? This year’s crash is less severe, but eerily similar. As you can see in the chart below, the number of stocks reaching their first 52-week lows spiked early in March, followed by a peak in mid-May and then small spikes thereafter. In total, 277 stocks in the S&P 500 (~55%) have hit a 52-week low during this year’s decline:
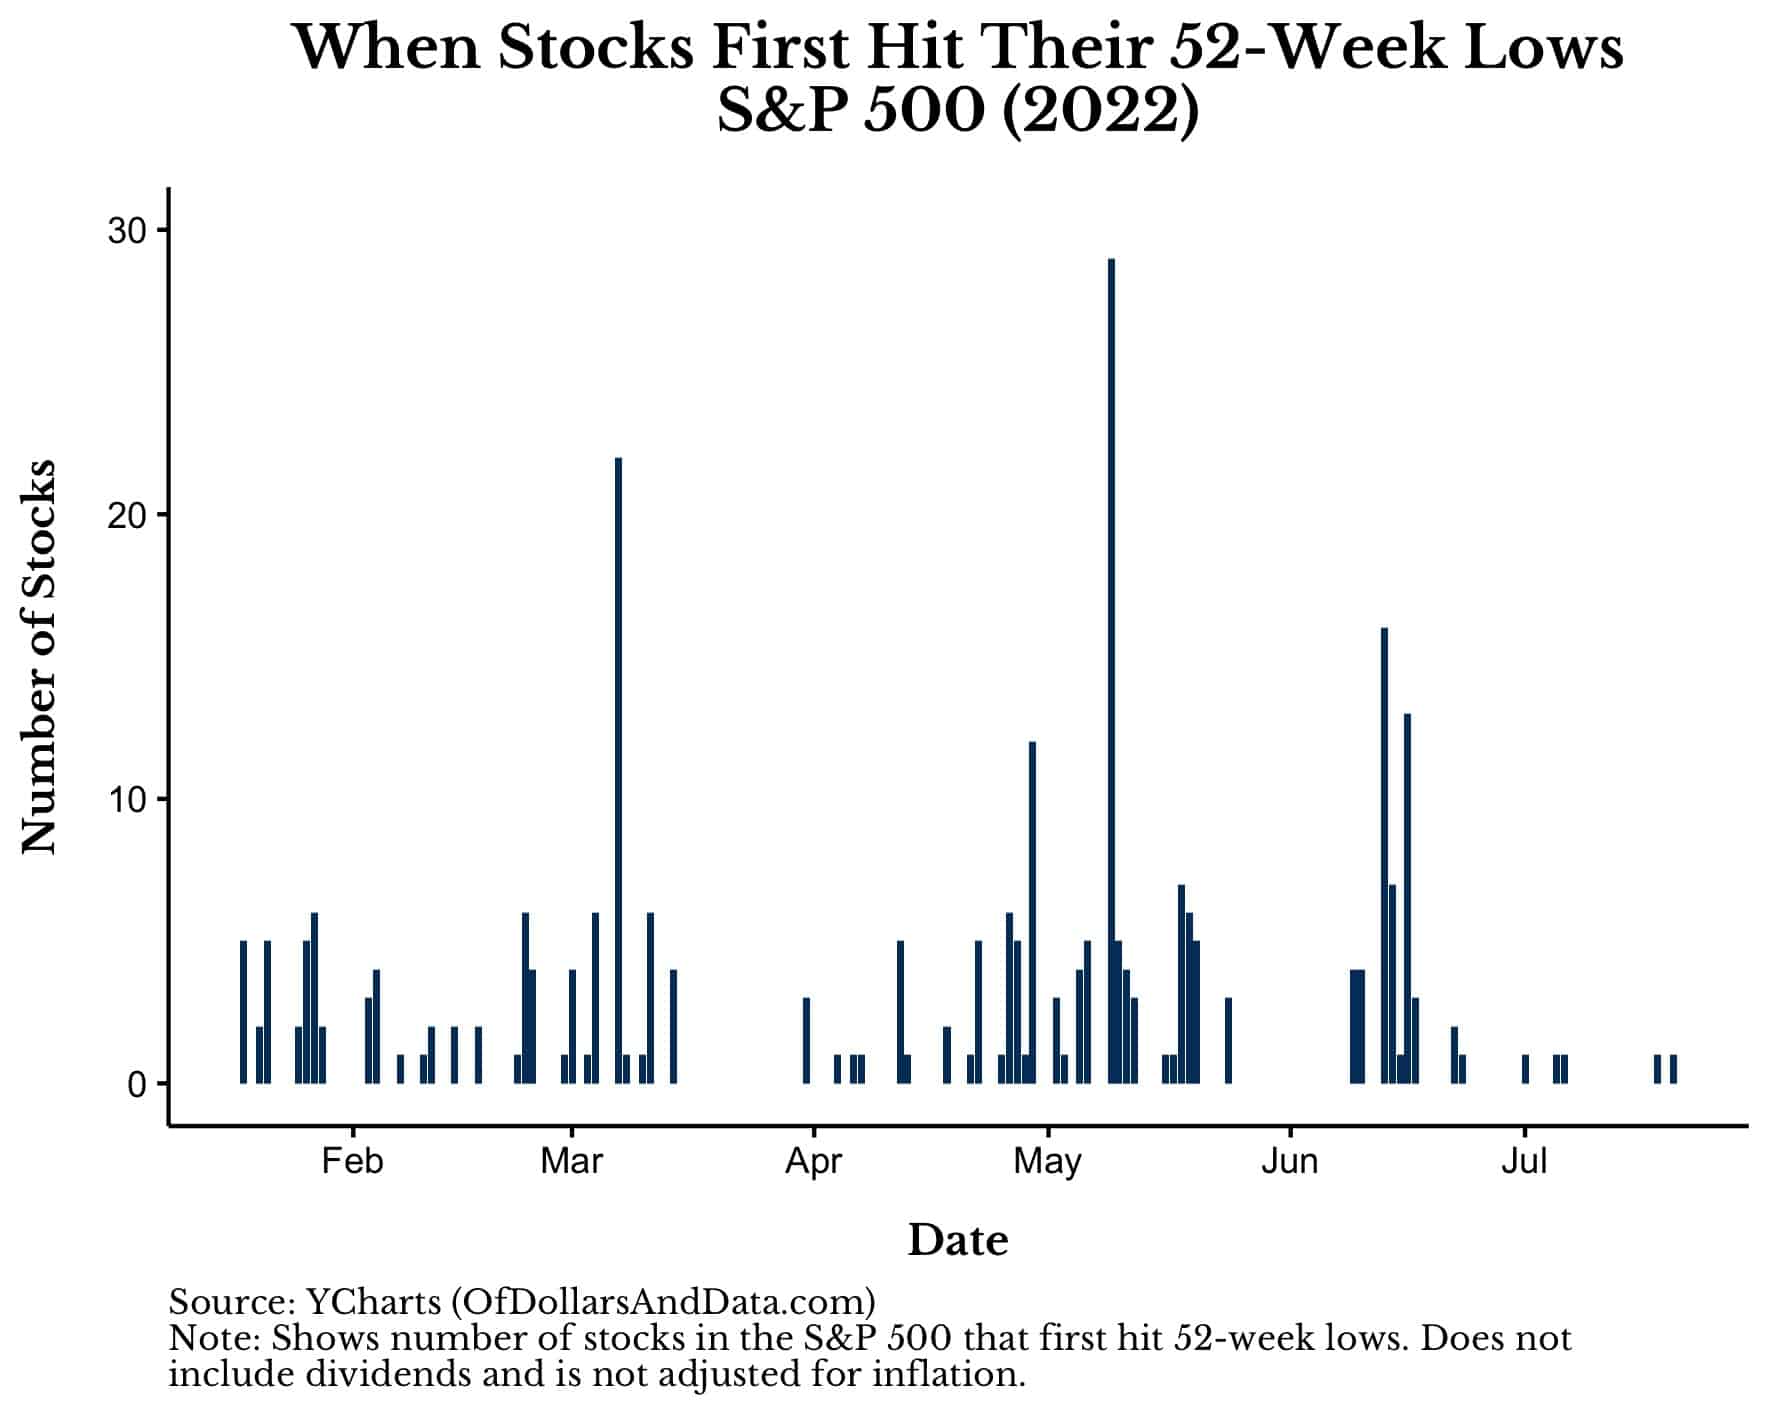
The pattern of spikes in this year’s crash is similar to what we saw in the March 2020 crash, despite occurring over a longer timeframe. Does this mean that we have already bottomed? Not necessarily. After all, all the spikes above could be the precursor to an even larger crash in the future. It’s like that popular Simpsons meme:
Of course we don’t know the future, but history can be helpful.
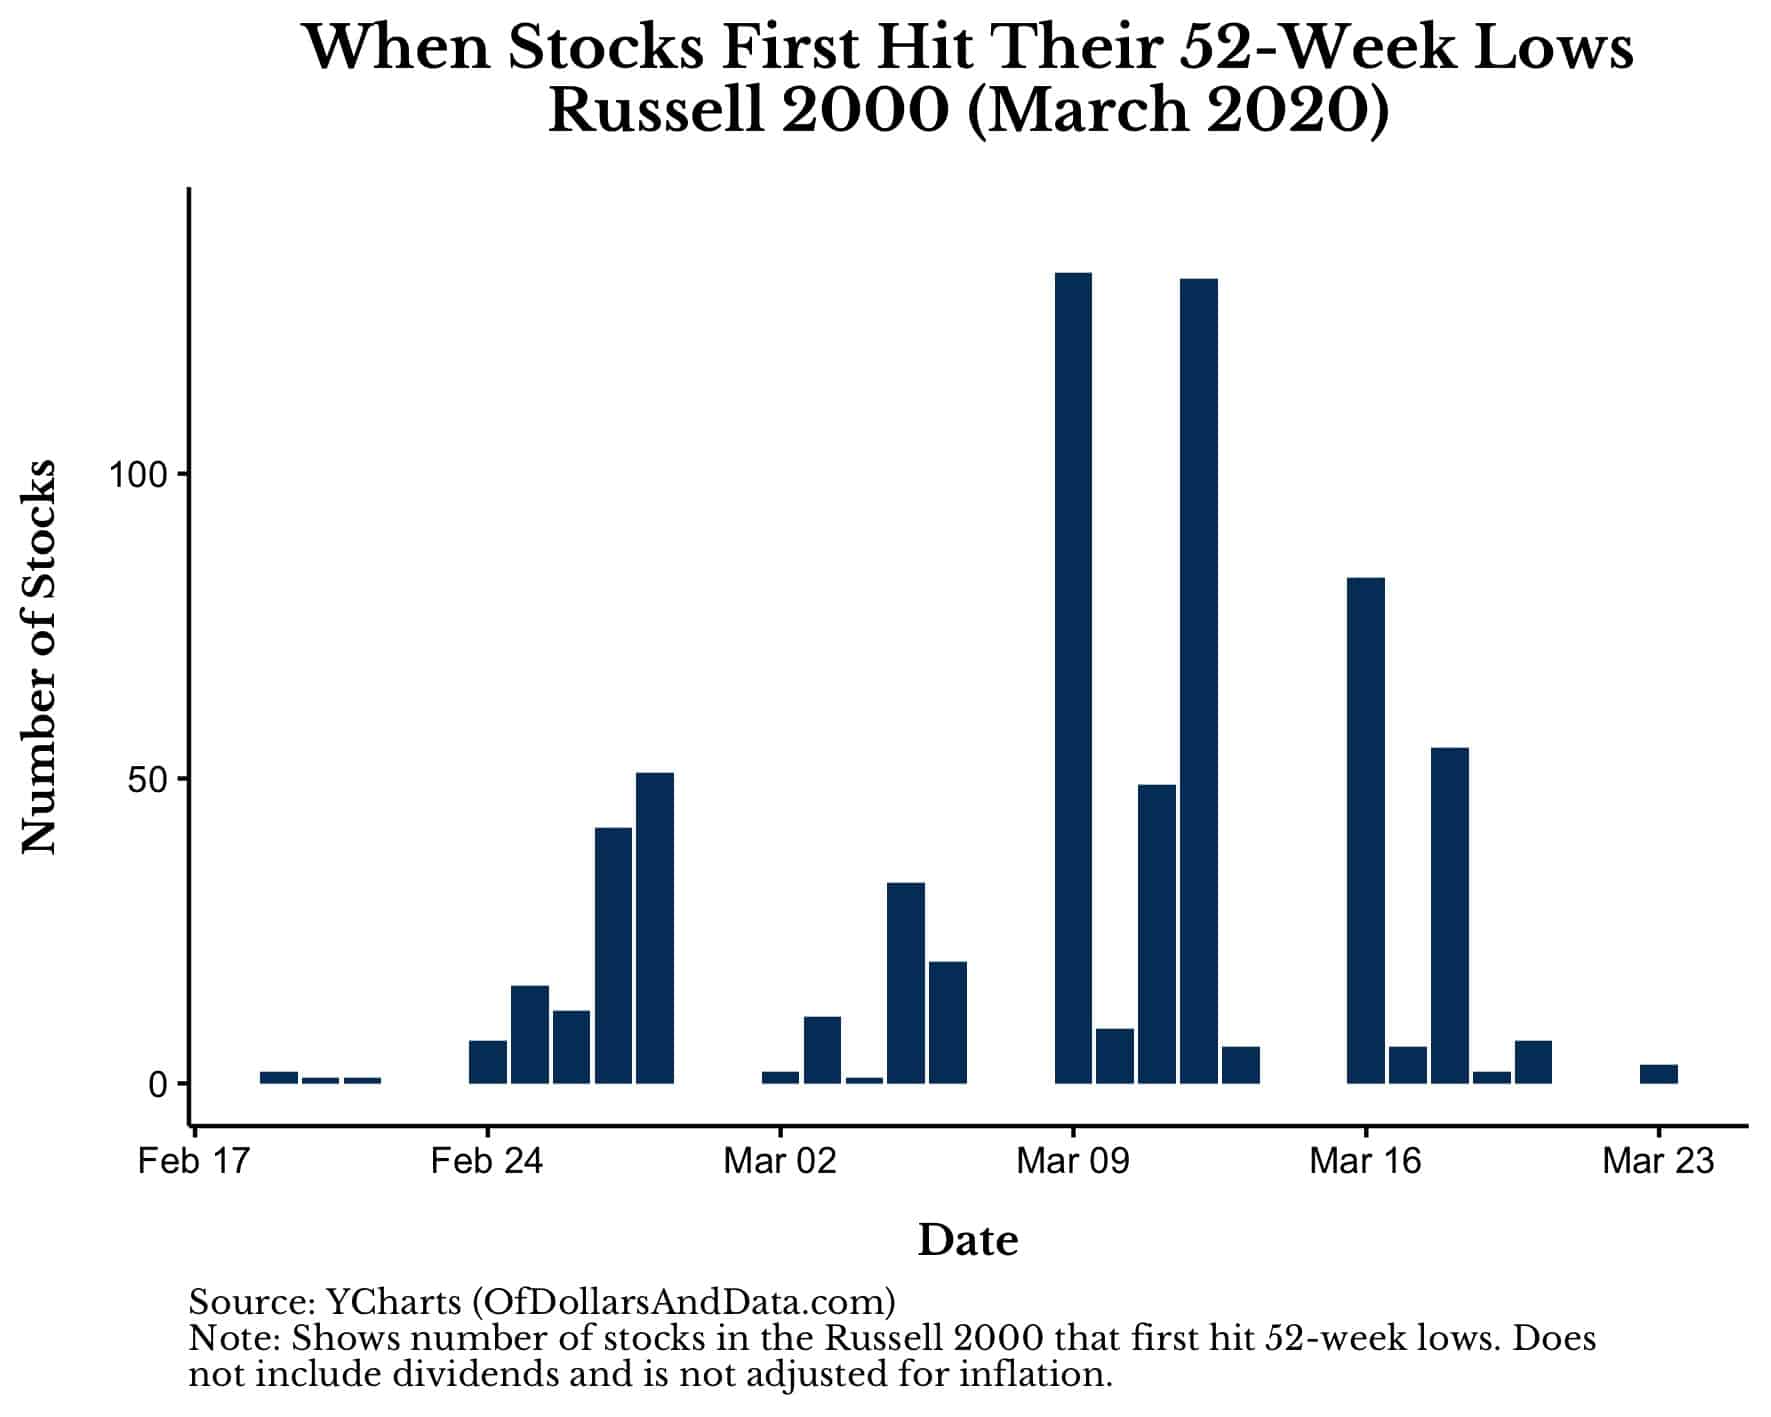
More importantly, the comparison I’ve done above doesn’t just apply to the S&P 500. When I run the same analysis on the Russell 2000 (i.e. U.S. small cap stocks), I see the same kind of similarities between March 2020 and today. For example, here is when stocks in the Russell 2000 hit their first 52-week lows in March 2020:
And now the same chart for this year’s crash:
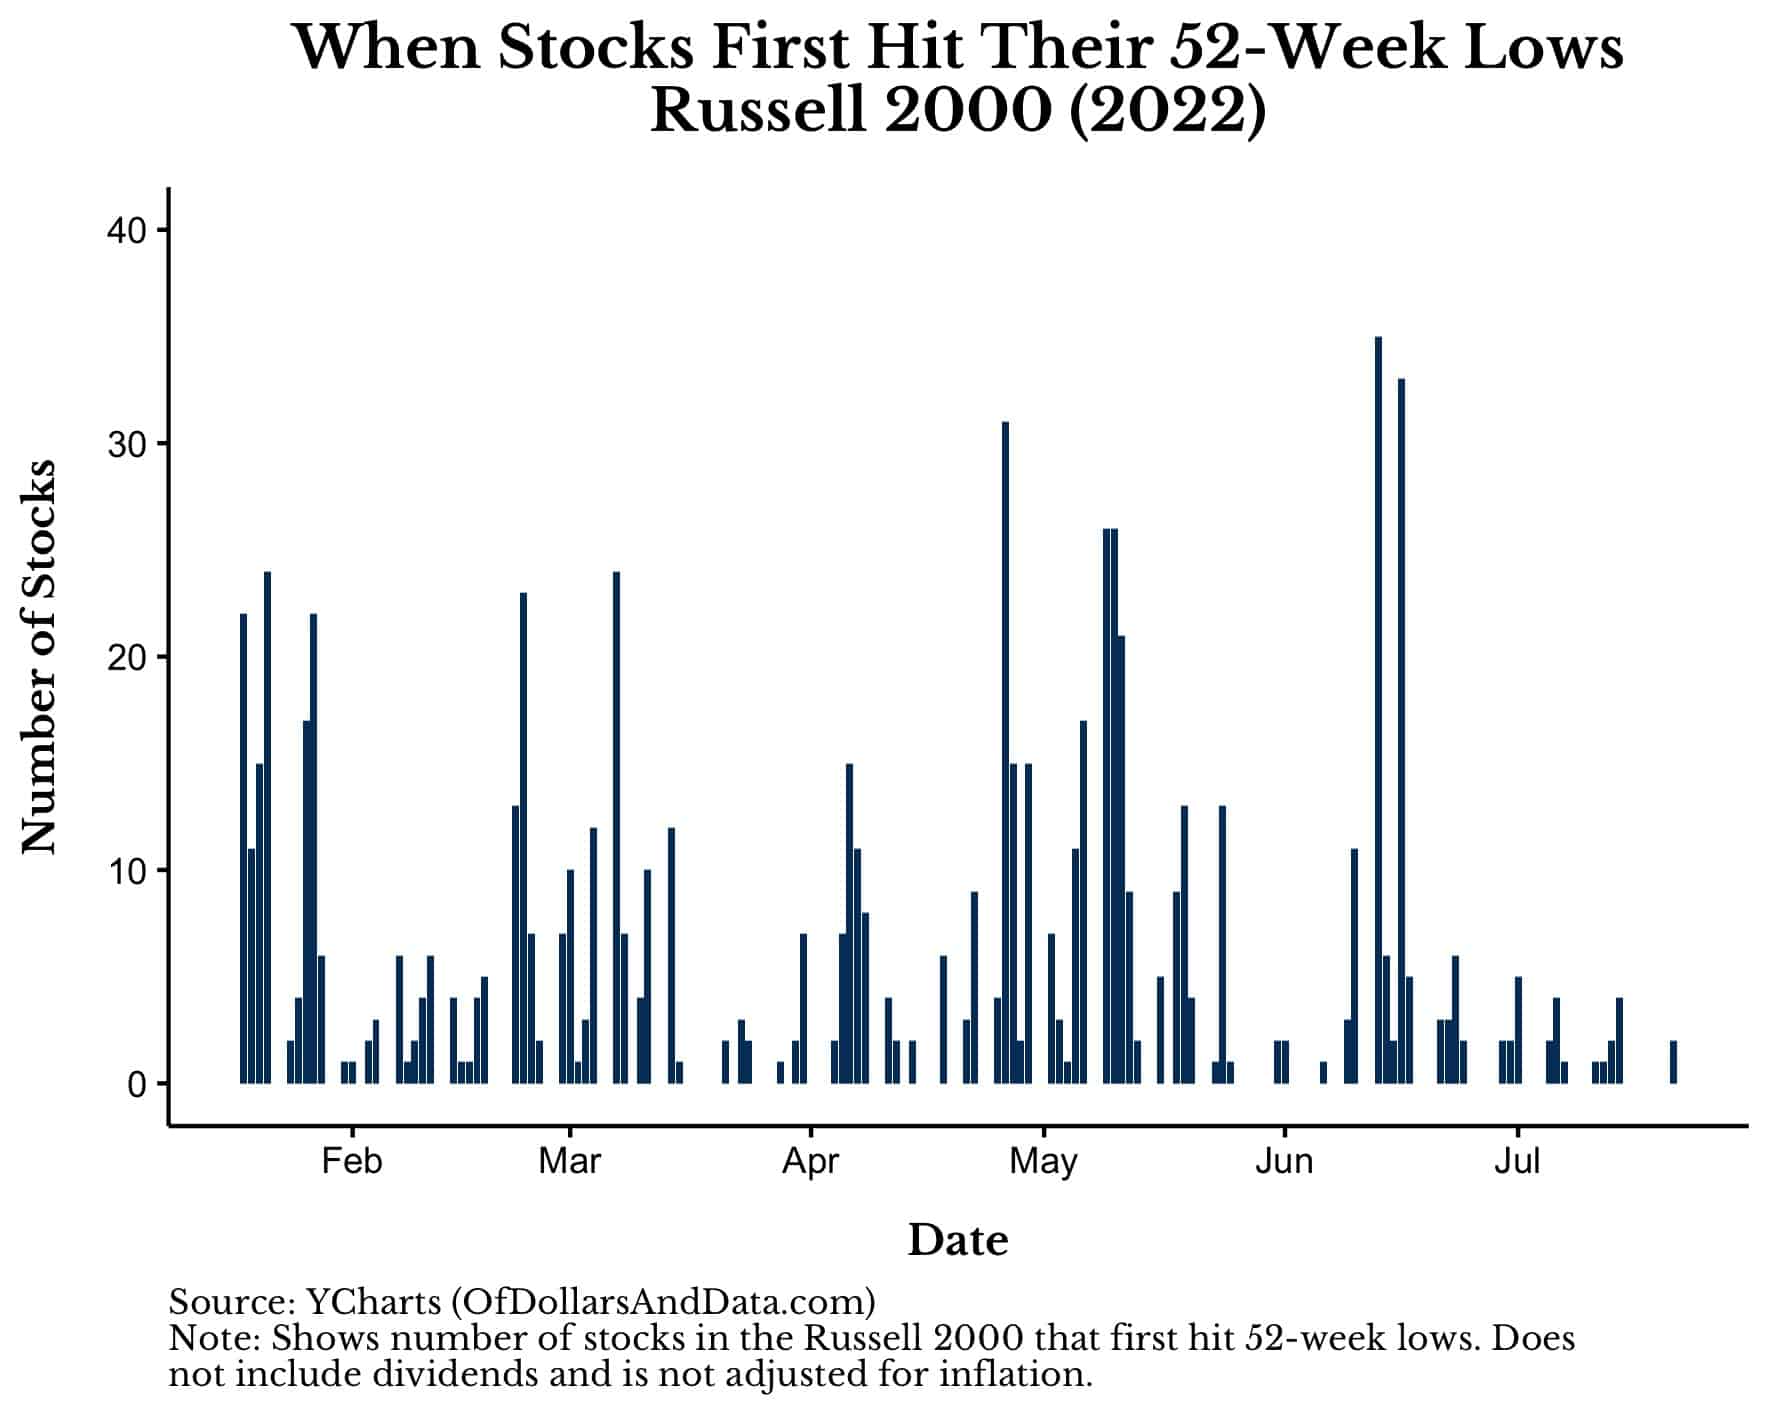
Though the beginning of this year was particularly harsh on small cap stocks, we still see a similar peak and decay pattern in the number of stocks hitting initial 52-week lows as we did with the S&P 500.
But even if we look at the number of stocks at 52-week lows (and not just initial 52-week lows), the story is more or less the same. For example, here is the number of stocks in the Russell 2000 at 52-week lows by day during the March 2020 crash:
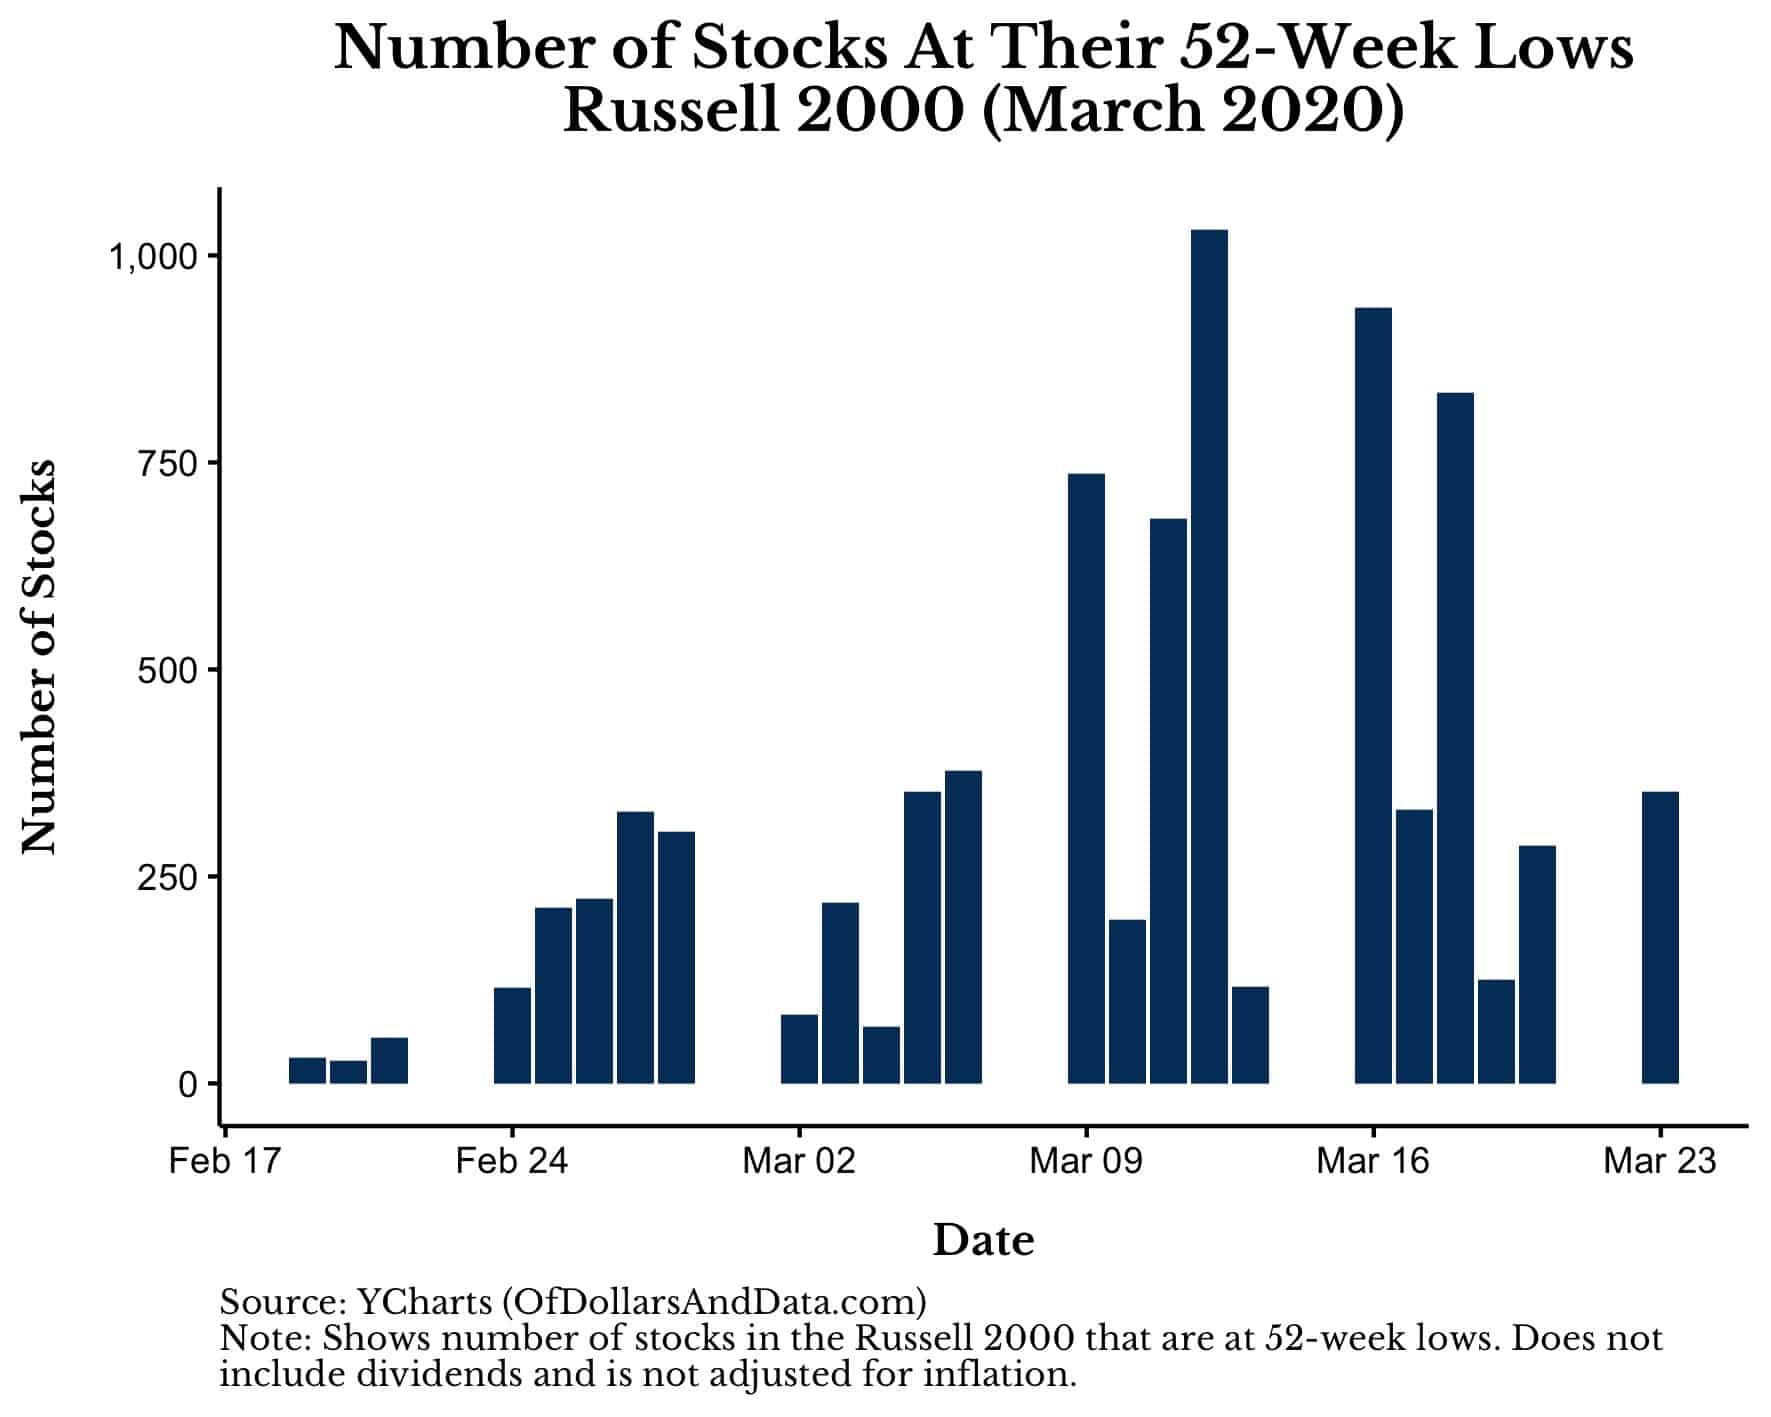
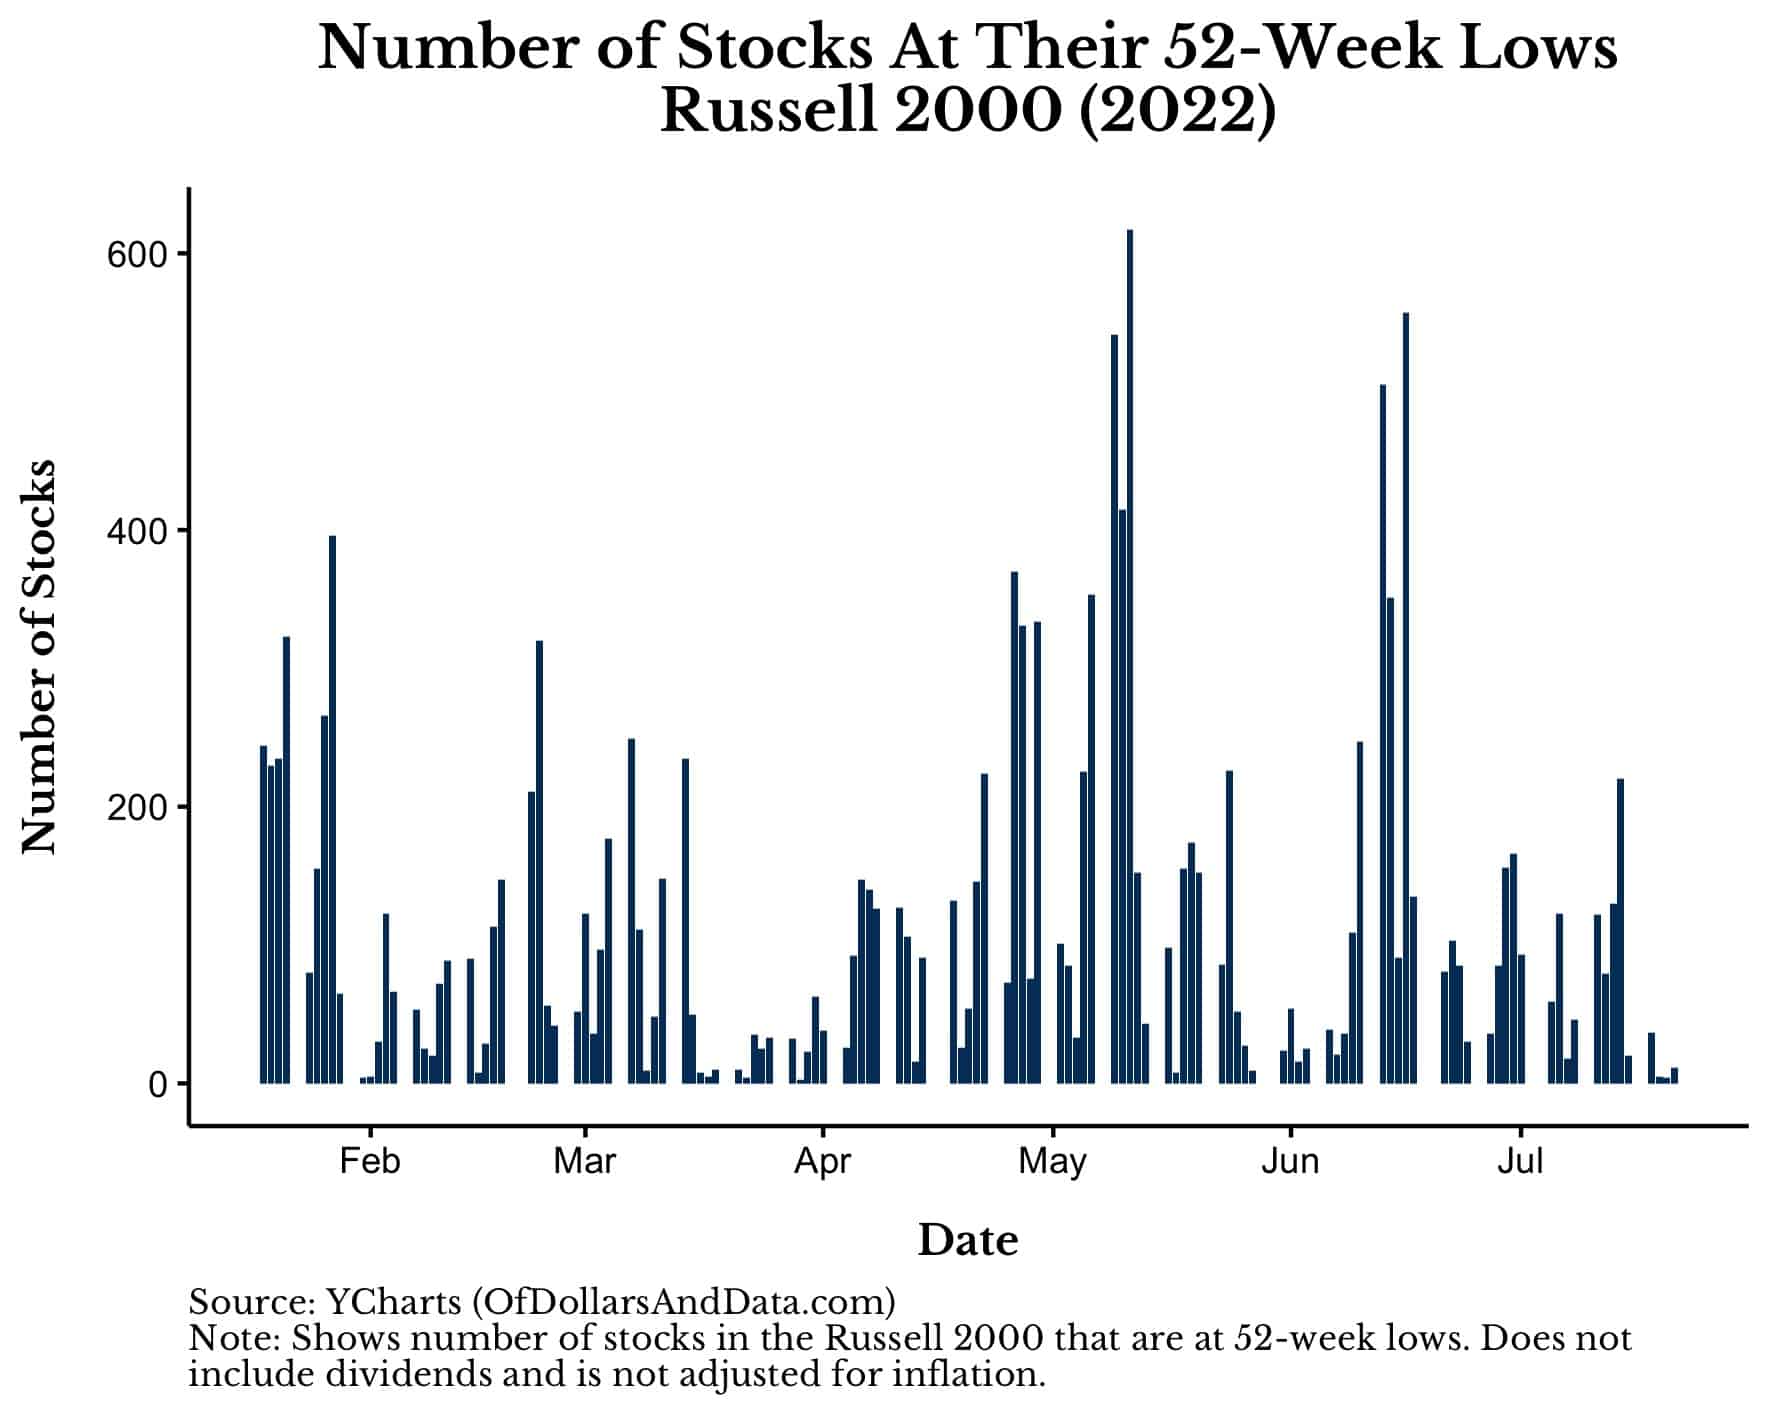
As you can see, the number of Russell 2000 stocks at 52-week lows peaked in mid-March 2020 (slightly before the market bottom on March 23, 2020). The same thing seems to have happened in this year’s crash as the number of Russell 2000 stocks at 52-week lows peaked in mid-May although our most recent market bottom was on June 16, 2022:
Of course, this doesn’t prove that the market has already bottomed, but it seems promising that it might have. Only time will tell. Until then, happy investing and thank you for reading!
If you liked this post, consider signing up for my newsletter.
This is post 305. Any code I have related to this post can be found here with the same numbering: https://github.com/nmaggiulli/of-dollars-and-data

