Do you want to know how you are doing relative to your peers financially? Then this is the article for you.
Last week the Federal Reserve released its 2022 Survey of Consumer Finances, the gold standard of wealth data for American households. I’ve decided to take this data and calculate the average net worth by age so you can get a better handle on how you stack up financially.
Of course, we know that “comparison is the thief of joy,” but this doesn’t mean that benchmarking can’t be useful. This is especially true when it comes to benchmarking your wealth, something that is still taboo to discuss openly.
And since it isn’t discussed, most people can only infer how they are doing by looking at what people buy as a signal to their wealth. Unfortunately, this isn’t always the clearest picture of someone’s finances. This is why we must use aggregated financial data, more specifically net worth.
More importantly, this net worth data must be broken down by age for it to be useful to us. Why? Because age is positively correlated with how long you’ve worked which is positively correlated with your savings and wealth.
After all, would it be fair to compare the wealth of someone who has three decades of work experience against someone who just graduated from college? Of course not! Though that older person probably has more money, the younger person has more time (which can be used to create money). This is why comparing net worth by age is essential if we want to have a better understanding of our financial well being.
But, before we dig into the data on net worth, let’s do a quick refresher on what it shows and how to interpret it.
What is Net Worth?
Net worth is the total value of an individual’s assets minus their liabilities:
Net Worth = Assets – Liabilities
In other words, it’s everything you own (i.e. house, car, bank accounts, stocks, ETFs, rental properties, etc.) minus everything that you owe to others (i.e. credit card debt, student loan debt, mortgage, etc.).
After netting the differences, we get a financial measure that we can use to compare across households. One other thing to note is that all of the net worth figures used in this article are inflation-adjusted to 2022 dollars. This means that I am showing real dollar changes when showing any year before 2022 (later in the article). This is important because, as the data will show, net worth has grown quite substantially over the past three years even after taking into account inflation.
With that being said, let’s look at the average net worth and why this measure has its limitations.
What is the Average Net Worth (and What Are its Limitations)?
The average net worth of U.S. households in 2022 was $1,059,470. This is an inflation-adjusted increase of nearly $200,000 from the average net worth of $865,719 in 2019. If these figures seem high to you, it’s because they are. The typical American household is not walking around with $1 million in wealth.
The problem with the average net worth is that it tends to be heavily skewed by outliers (i.e. the superrich). For example, if 9 people were at a bar (all with a net worth of $100,000) and then Elon Musk walked in (whose net worth is >$200 billion), the average net worth in the bar would skyrocket to over to $20 billion! Unfortunately, this average figure would tell you basically nothing about the wealth distribution of the bar’s patrons.
To correct for this, we can use the median net worth, which is the point at which half of the households are above and half of the households are below a particular value.
So what is the median net worth of all U.S. households in 2022?
$192,700.
This is about 1/5 of the average net worth and an inflation-adjusted increase of about $50,000 since 2019 when the median net worth was $141,145.
But, once again, these figures don’t adjust for age, arguably the most crucial variable we need to control for to do a fair comparison. So, let’s do this now.
What is the Average Net Worth by Age?
After controlling for age, you can see that the average household net worth varies from as little as $183,000 to as much as $1.8M depending on where you are in life:
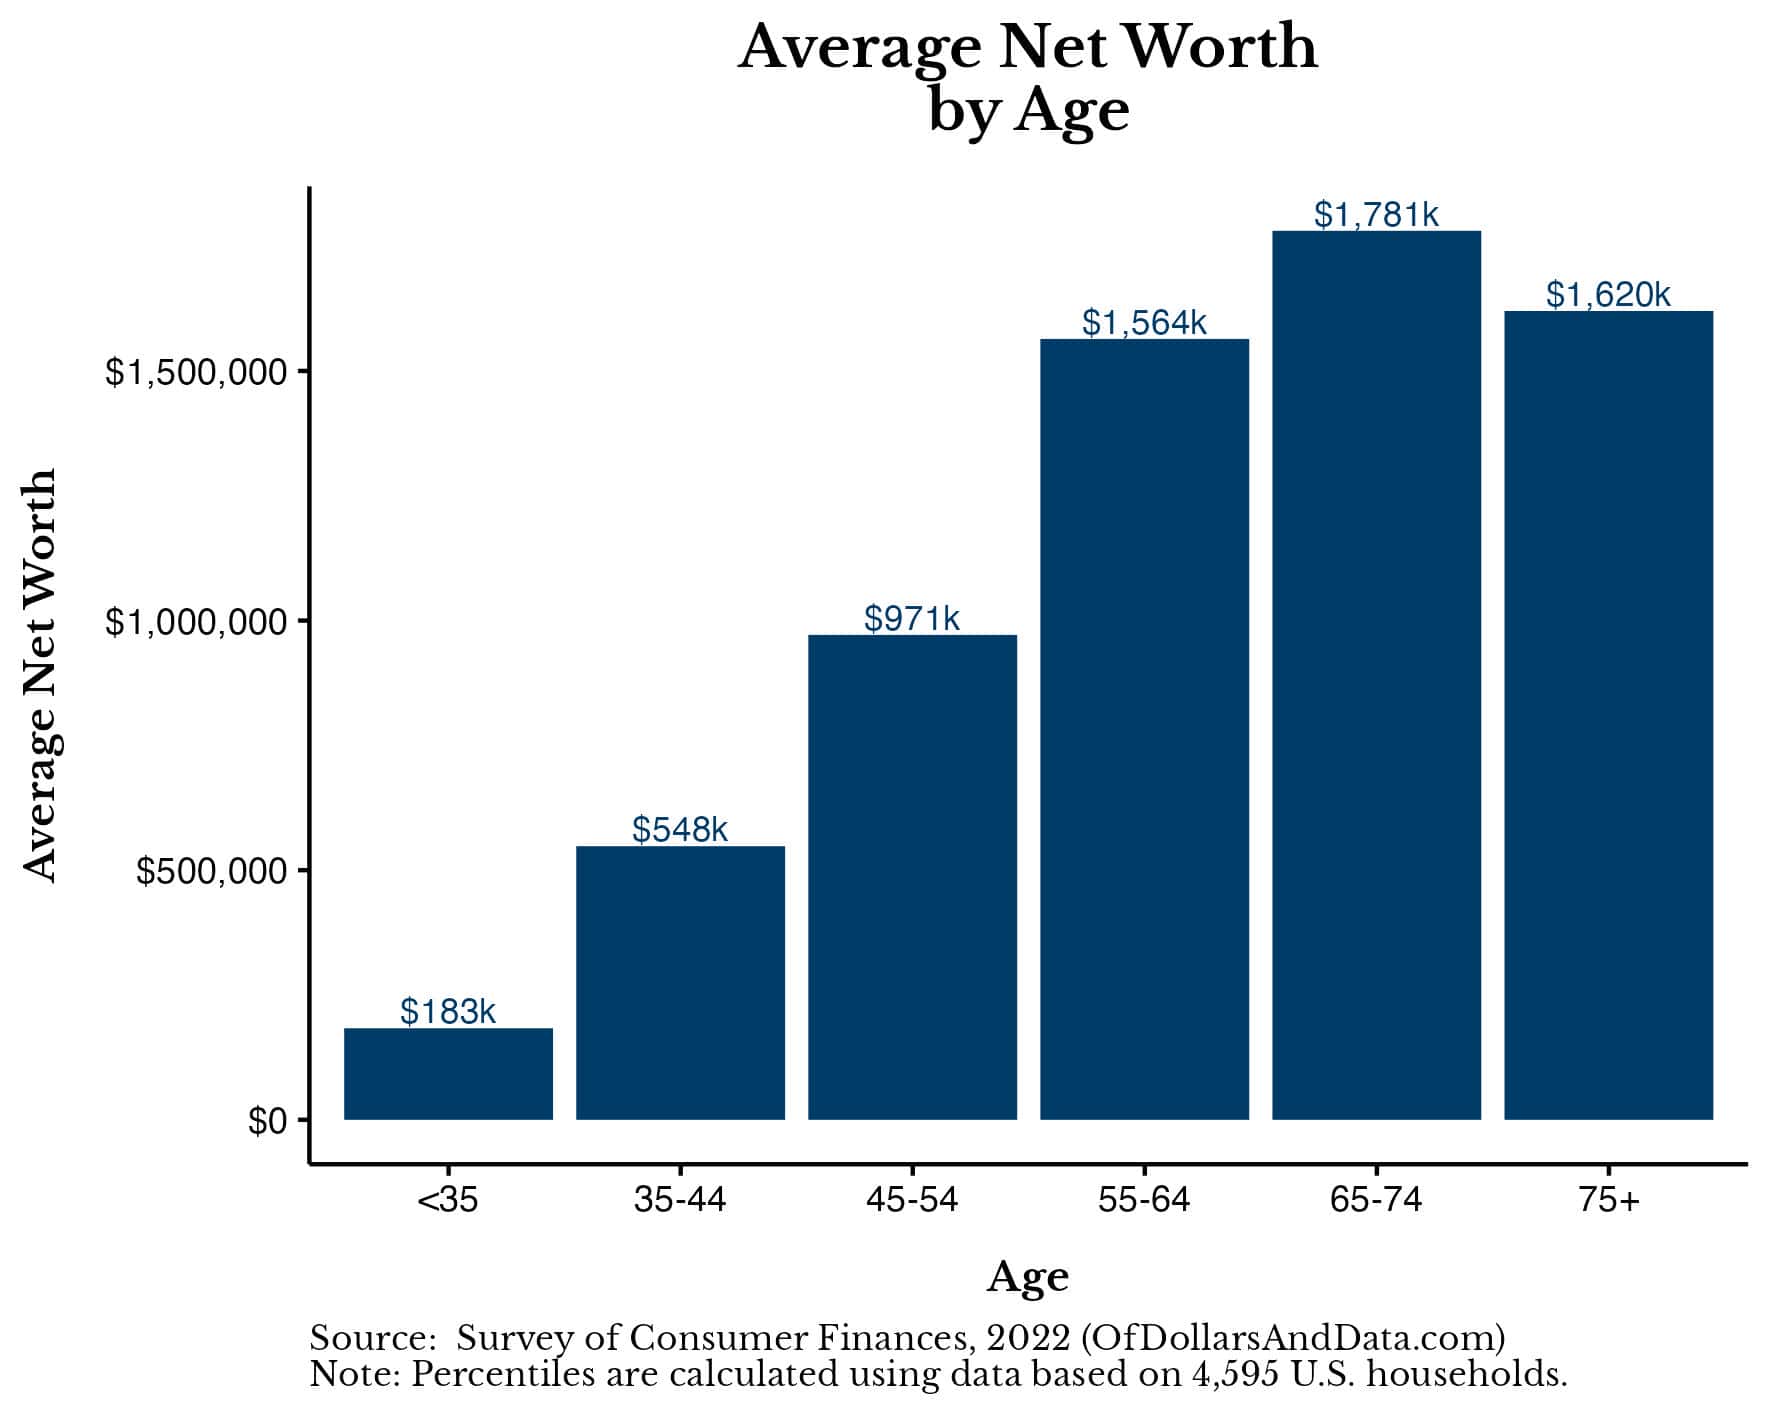
Once again, the average net worth by age tends to be skewed by the wealthiest households in each age bracket.
When we look at the median U.S. household’s net worth by age, these figures are far more relatable to the typical American:
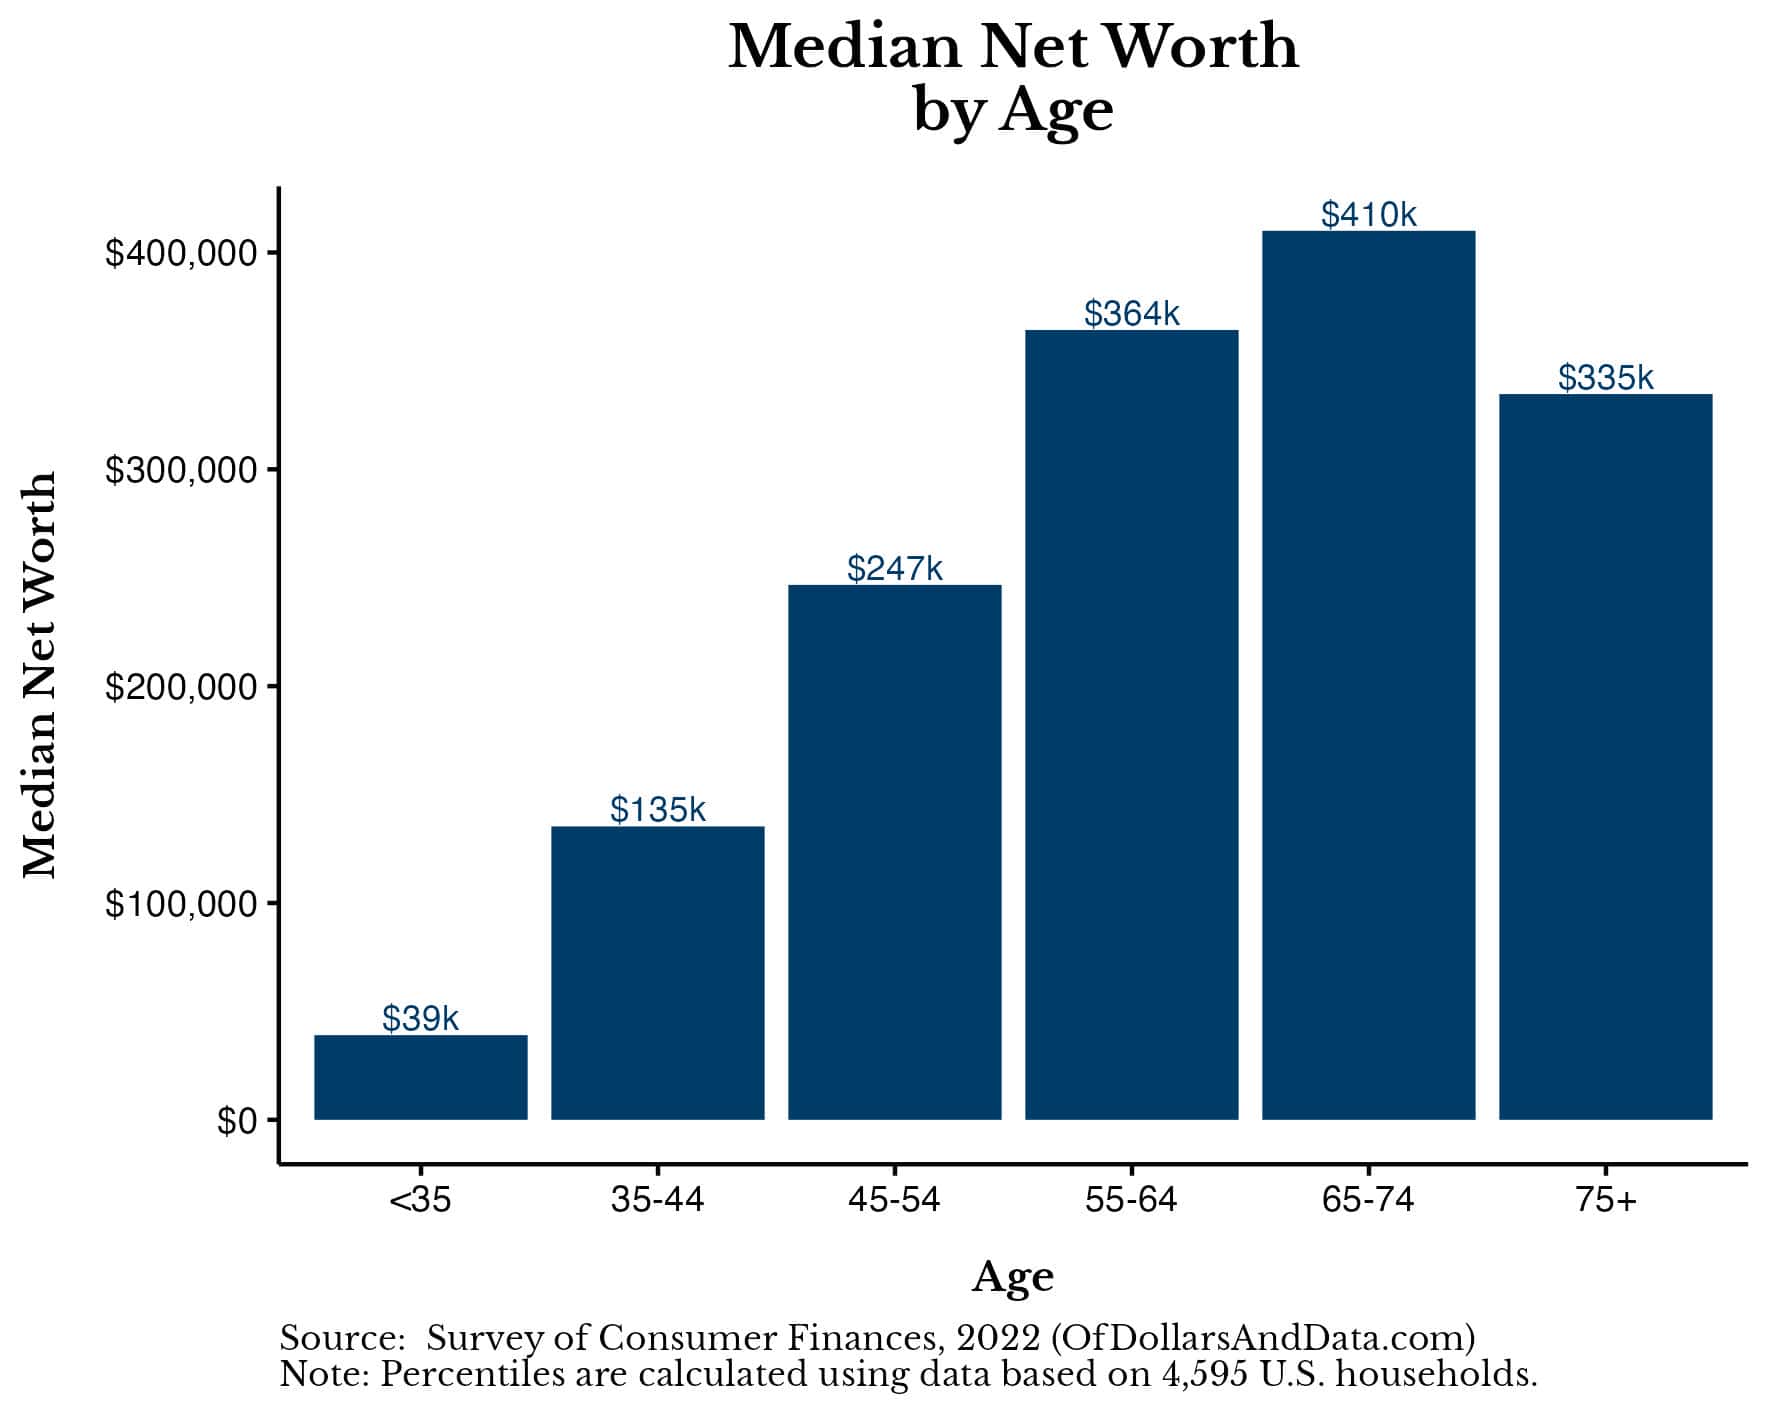
While we still see the pattern of rising net worth to age 65-74 followed by a decline afterwards, these median figures are far lower than the average net worth by age figures.
If we break this data out into even smaller age ranges, we can better see how wealth tends to change over time and where it peaks:
| Age Range | Average Net Worth | Median Net Worth |
|---|---|---|
| 20-24 | $120,896 | $10,800 |
| 25-29 | $120,185 | $30,160 |
| 30-34 | $258,073 | $89,801 |
| 35-39 | $501,289 | $141,200 |
| 40-44 | $590,718 | $134,730 |
| 45-49 | $781,923 | $212,800 |
| 50-54 | $1,132,532 | $272,800 |
| 55-59 | $1,442,075 | $320,700 |
| 60-64 | $1,675,214 | $394,010 |
| 65-69 | $1,836,884 | $394,300 |
| 70-74 | $1,714,085 | $433,100 |
| 75-80 | $1,630,969 | $316,000 |
Based on this table, household wealth tends to peak in age 65-69 (i.e. right around retirement). While there probably are some cohort effects impacting this data based on when you were born and future market performance, the fact that wealth peaks around the typical retirement age makes logical sense.
If you want to dig deeper into household net worth by age, I recommend this net worth by age calculator I created for this purpose.
Now that we’ve looked at the average net worth by age (along with the median) let’s explore the data for those doing better or worse than the median.
What About Those Doing Worse or Better Than the Median?
The average/median can be a useful measure, but we all don’t take the same financial journey. Some of us work in fields that pay more. Some of us get inheritances. Some of us are luckier and some of us are less fortunate. You should keep these things in mind when viewing the financial situations of those outside of the norm.
To start, we will look at the 25th percentile of net worth by age:
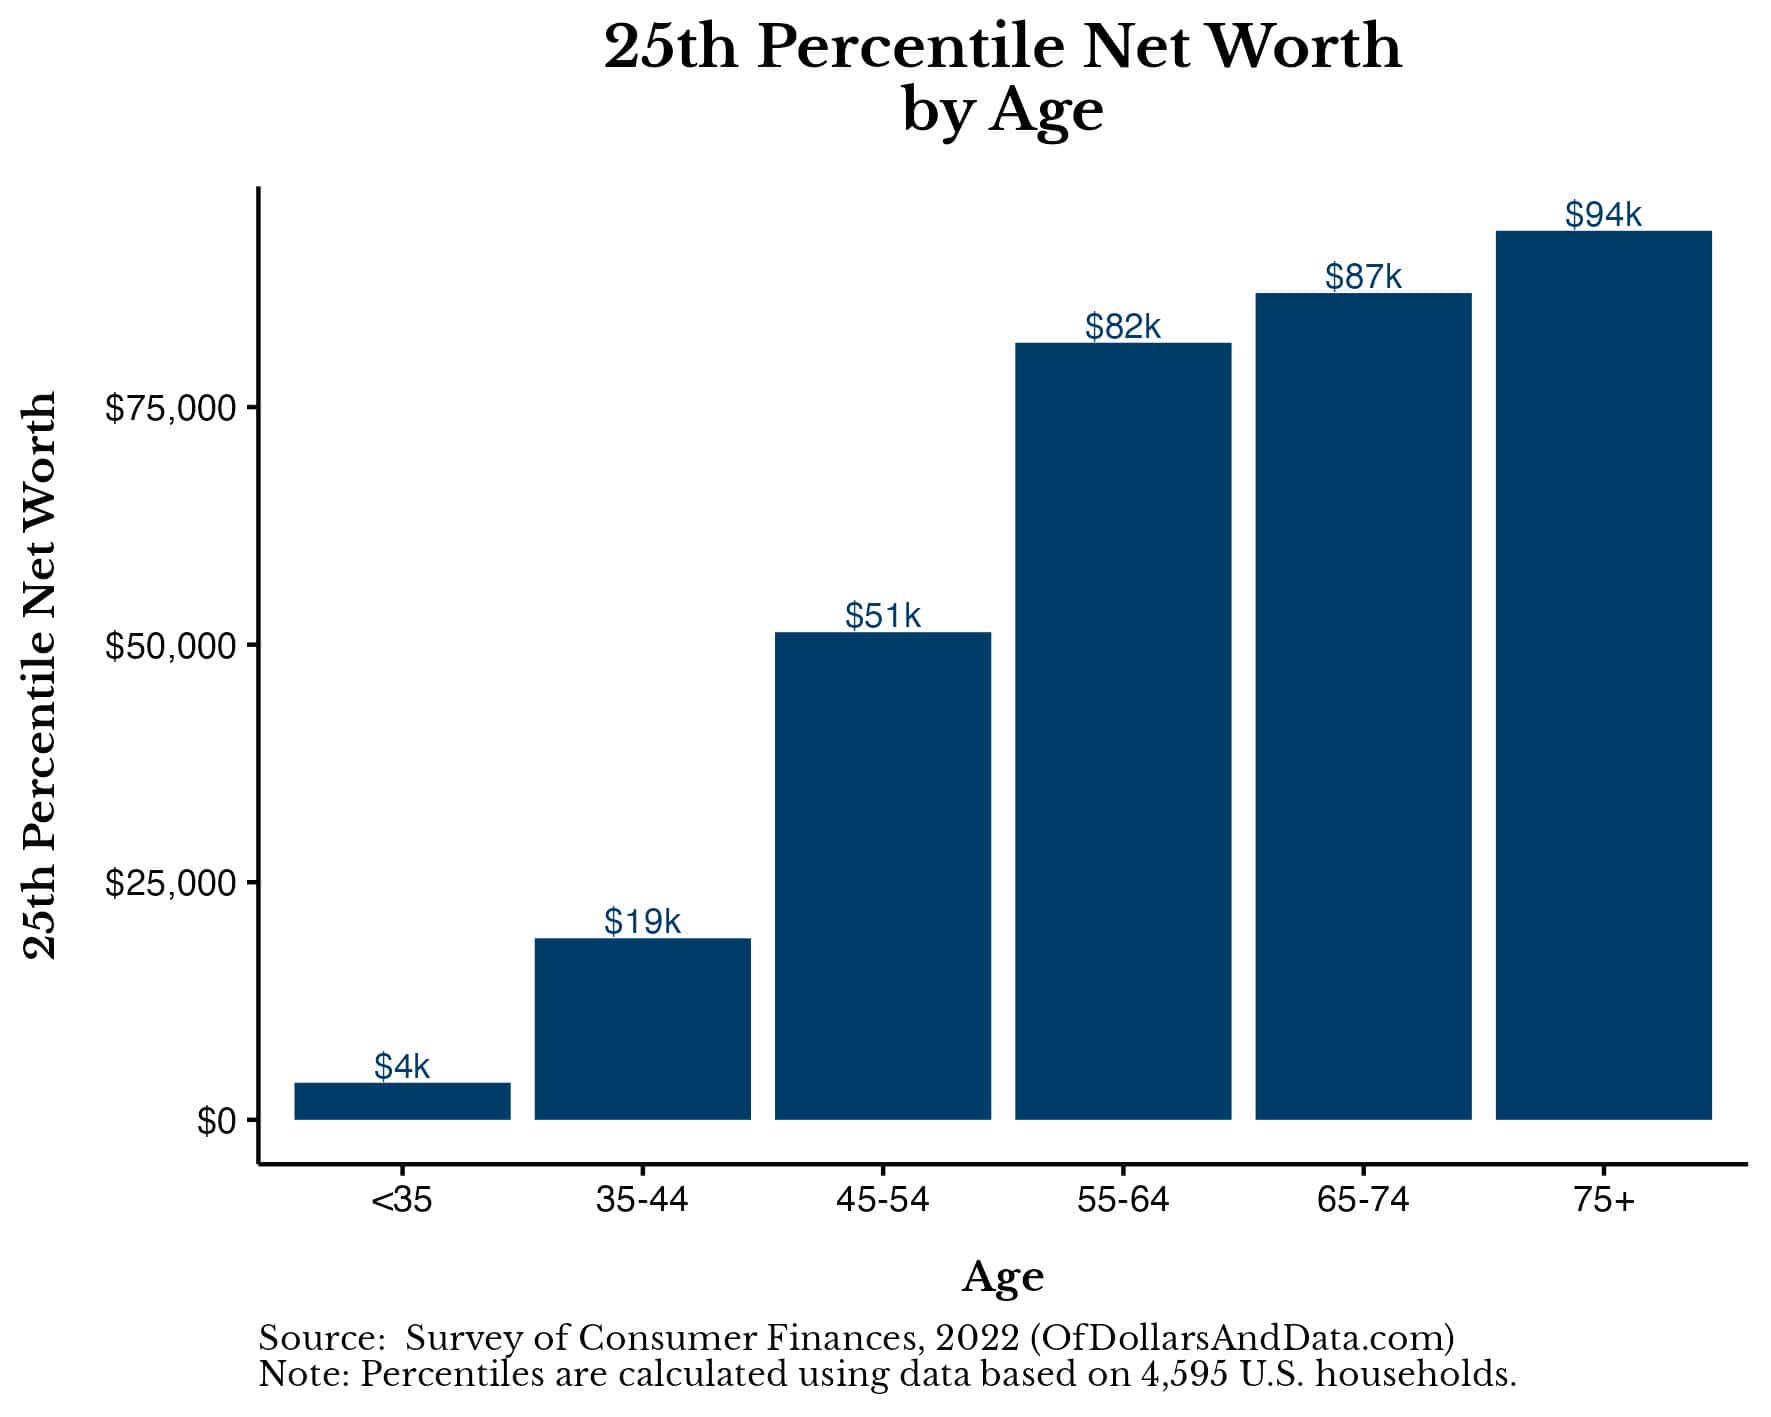
As you can see, even the households at the 25th percentile tend to have positive net worths across every age range. This is an improvement over the 2019 data which had households under 35 with a net worth near $0 at the 25th percentile.
On the flip side, there exists the 75th percentile households by net worth broken out by age:
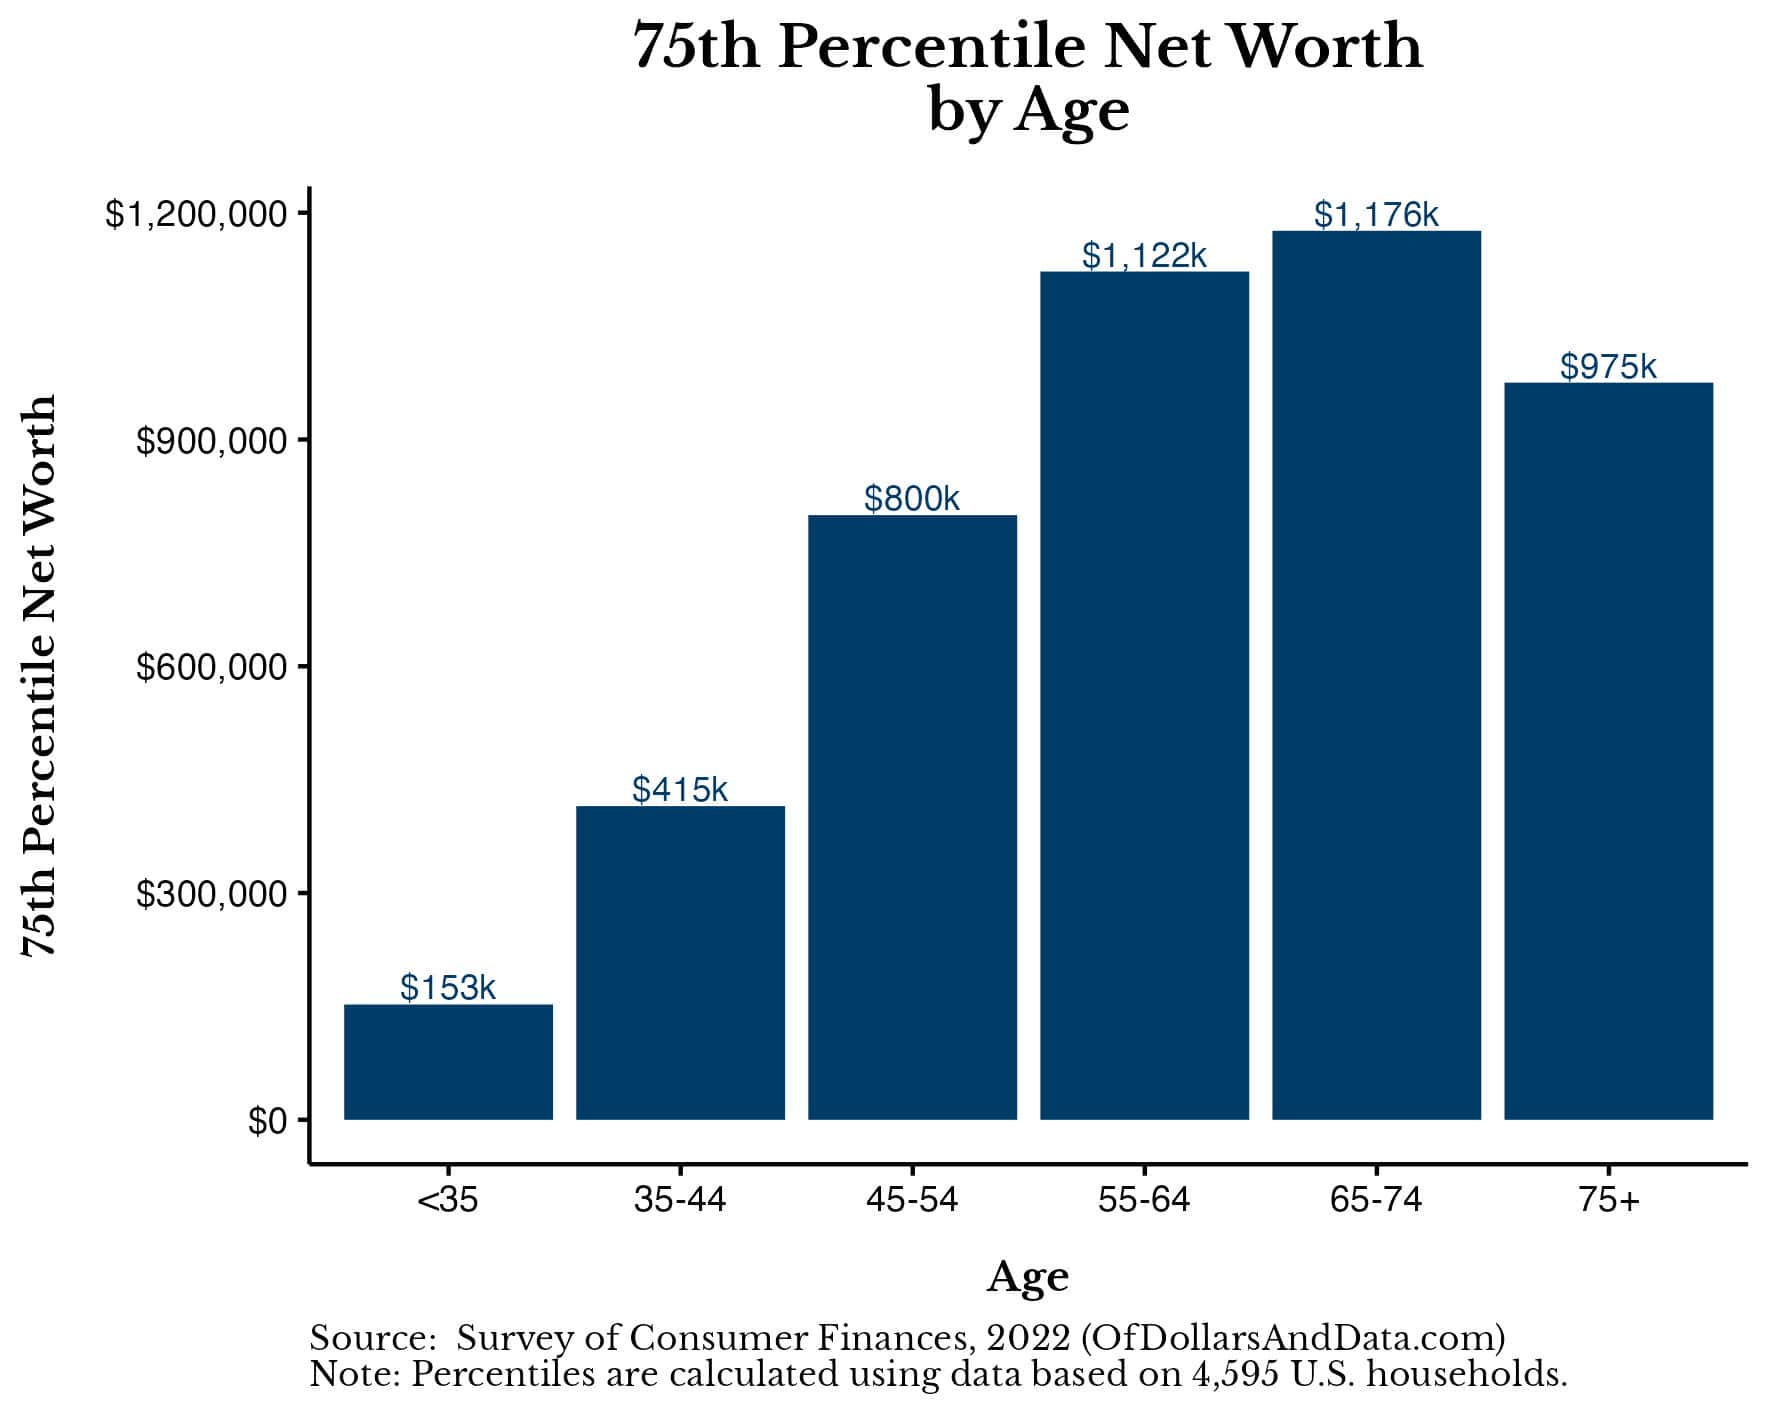
These households are doing a bit better than the median and are technically closer to the average.
Lastly, we will look at the households in the top 10% for those that want to strive for more:
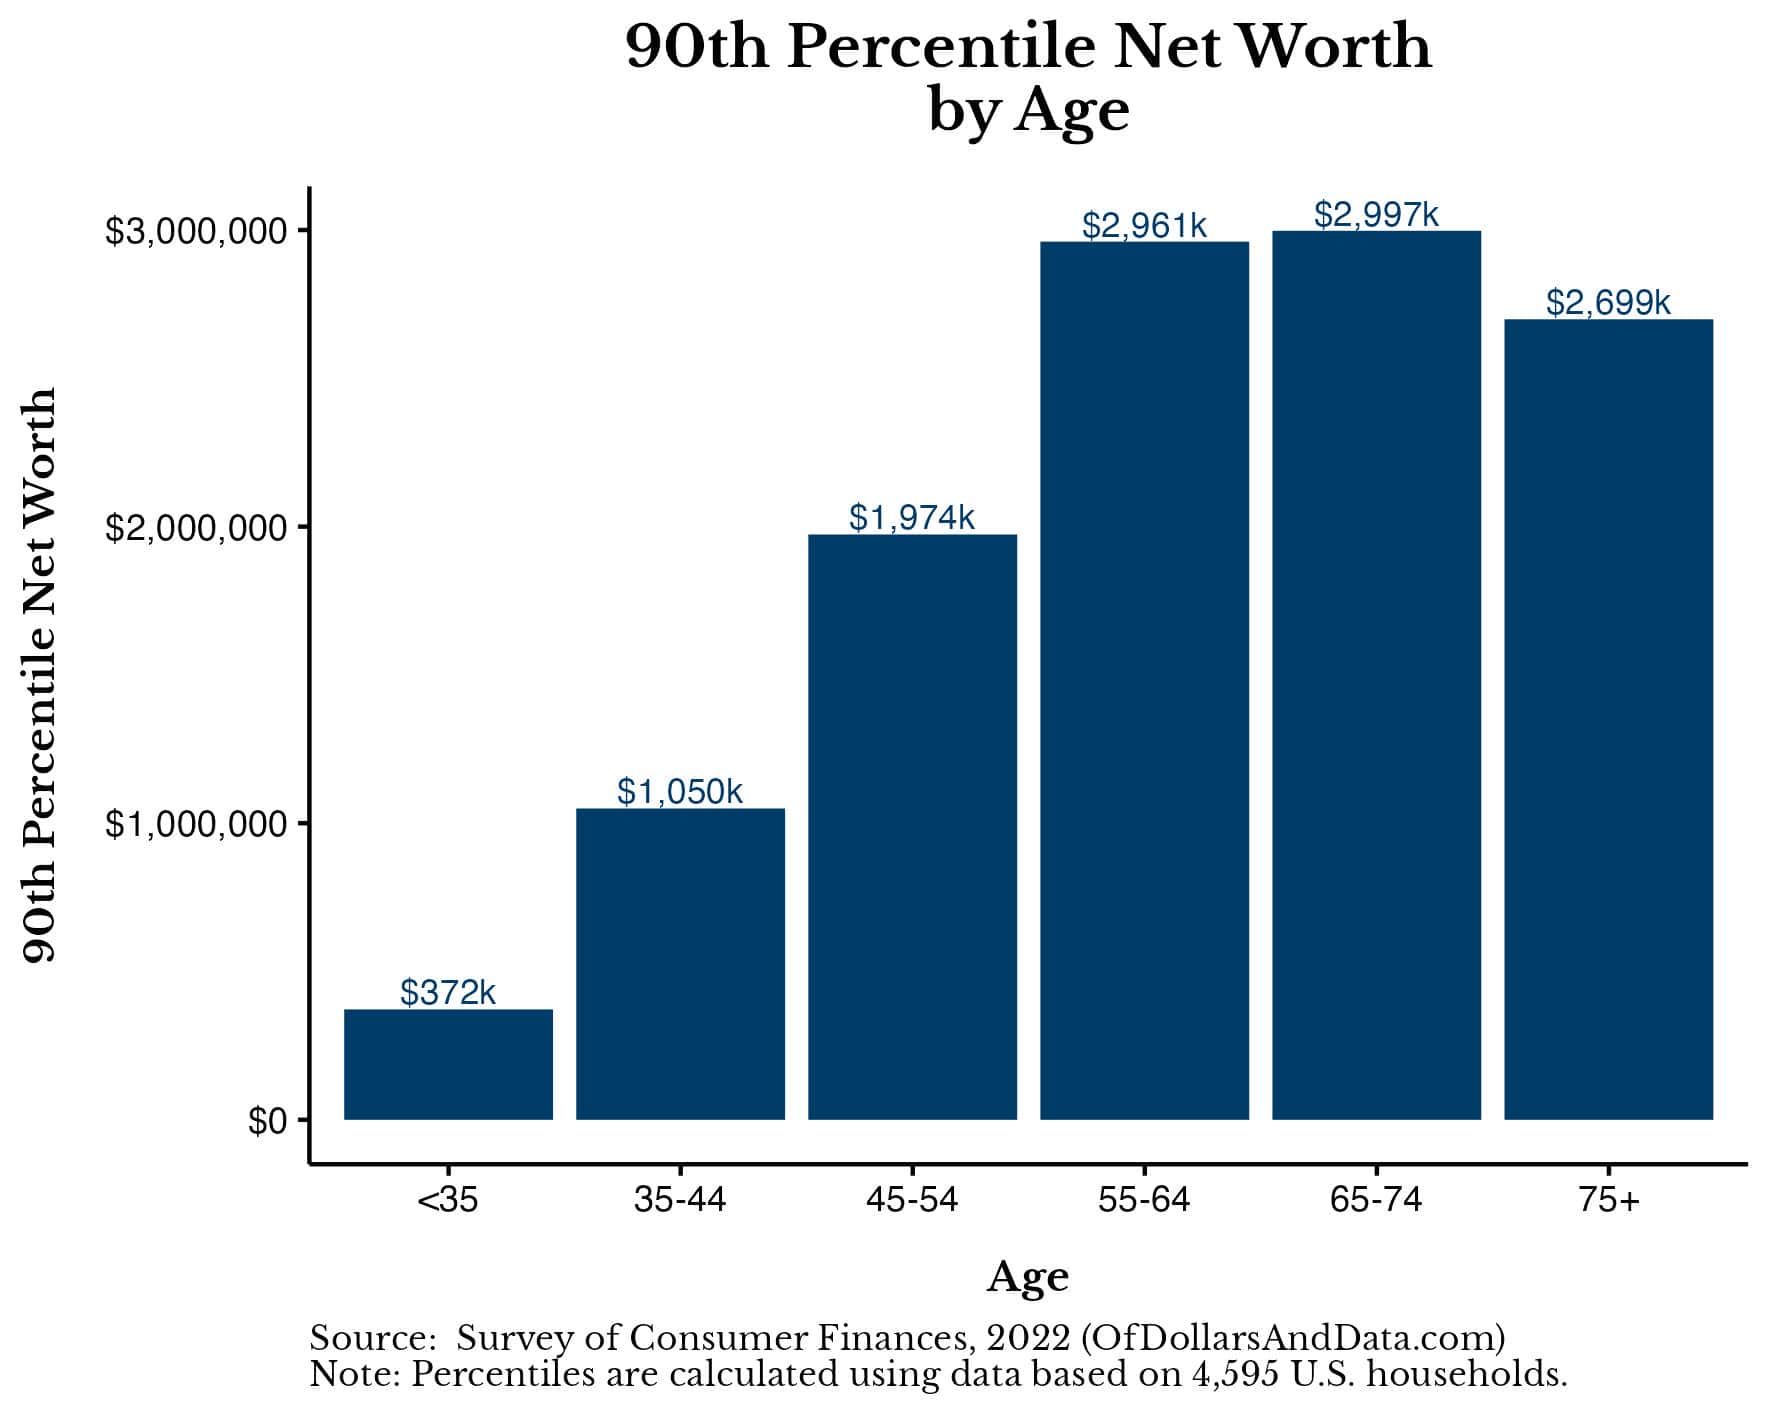
At the upper end of the wealth spectrum, the net worth numbers shoot up considerably with households in the top 10% having multiple millions as they near retirement.
Putting this all together I’ve created a single chart that shows the 25th, 50th (median), 75th, and 90th percentile household net worths by age. Note that this chart uses the same y-axis across each sub-chart to illustrate the relative differences between the percentiles in the distribution of net worth by age:
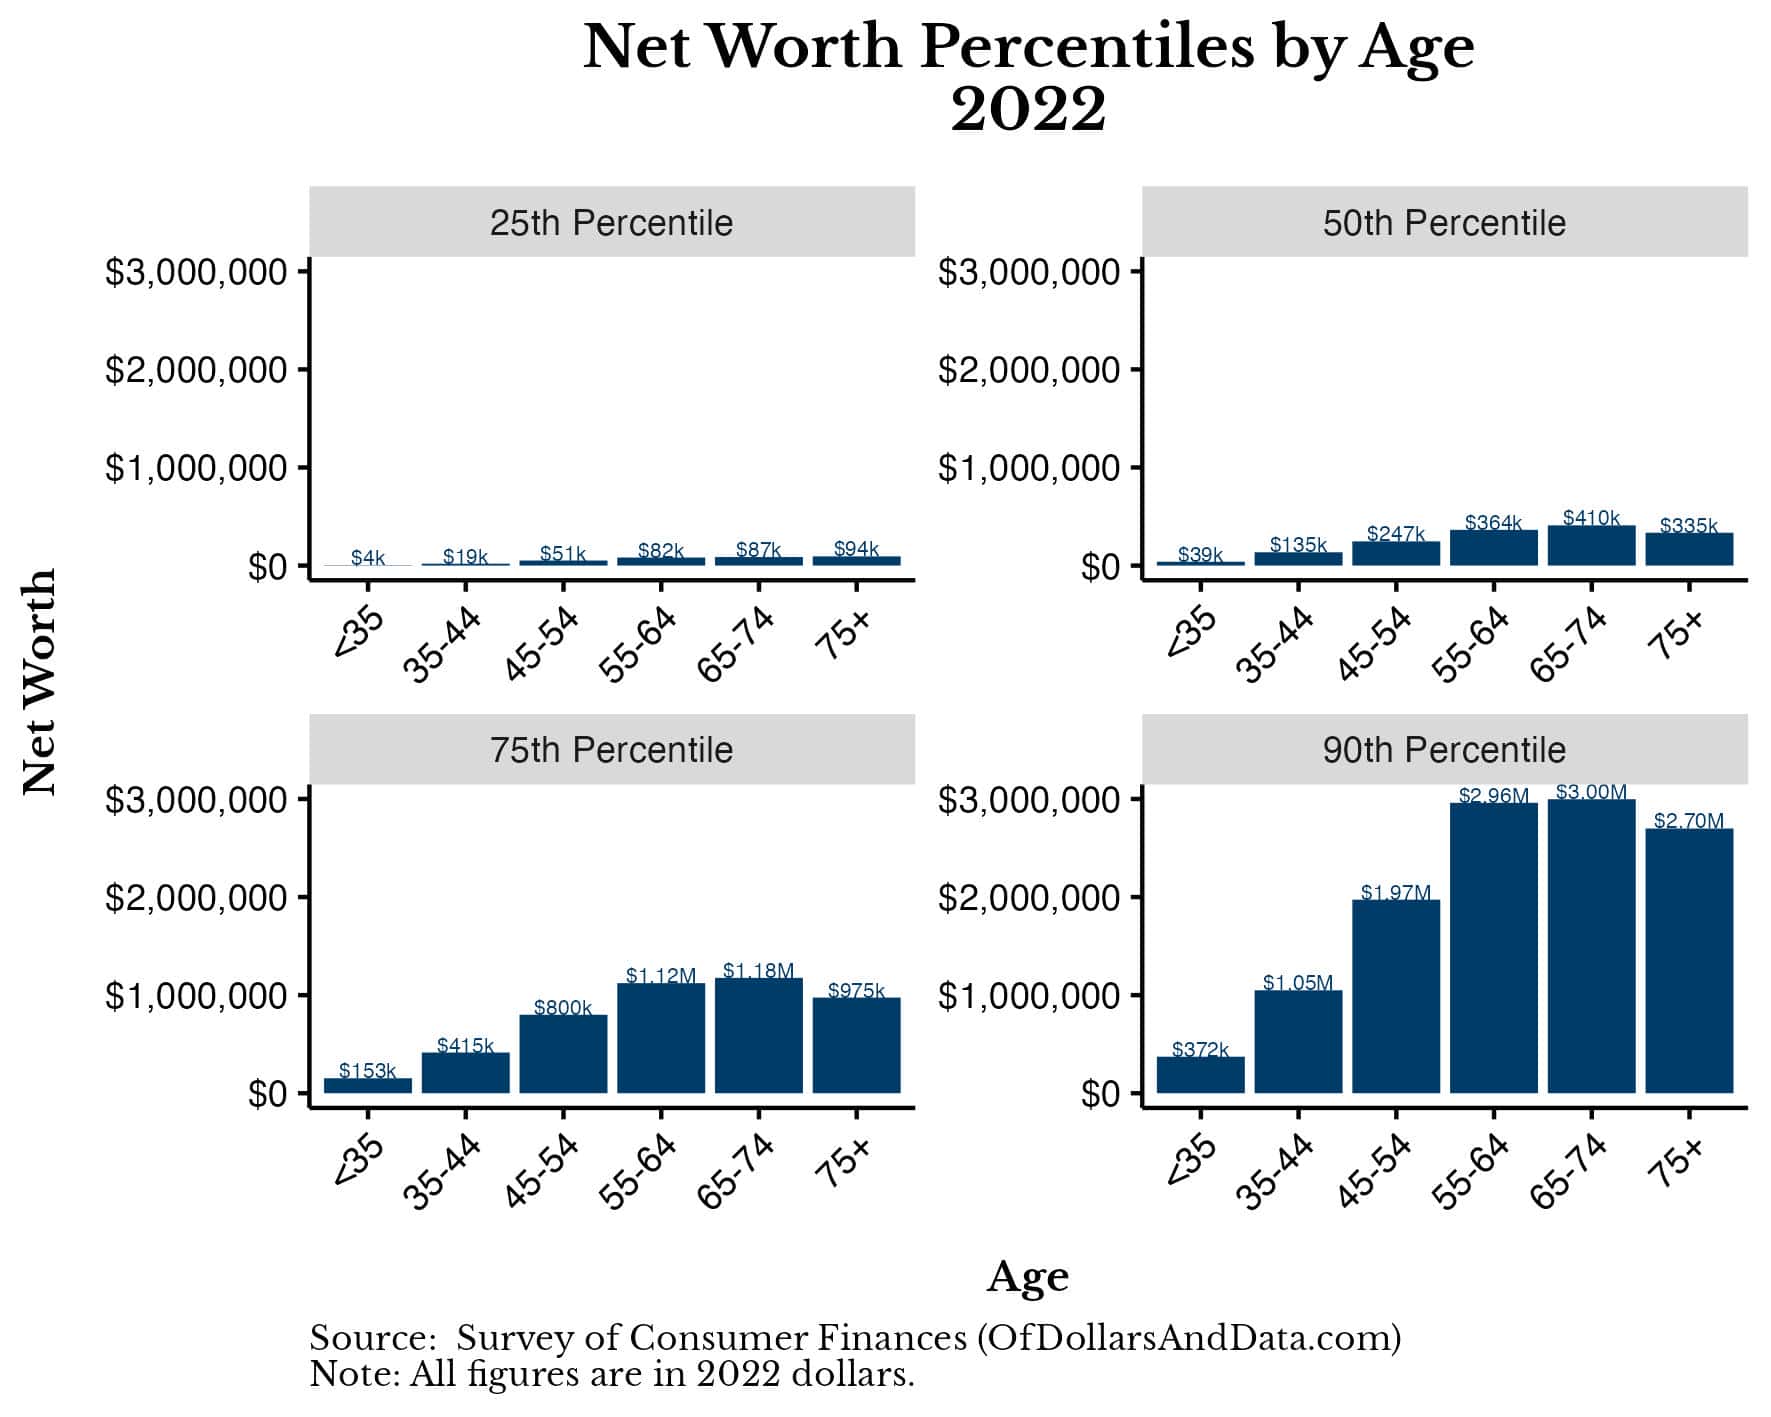
This chart makes it much easier to see just how much wealthier the 90th percentile households are than their less fortunate counterparts.
Now that we’ve taken a look at the rest of the wealth distribution, let’s spend a little time examining how wealth has changed over time for U.S. households before wrapping things up.
How Has American Net Worth Changed Over Time?
Since 1989, the median inflation-adjusted net worth among U.S. household has more than doubled from $93,600 to $192,700 by 2022:
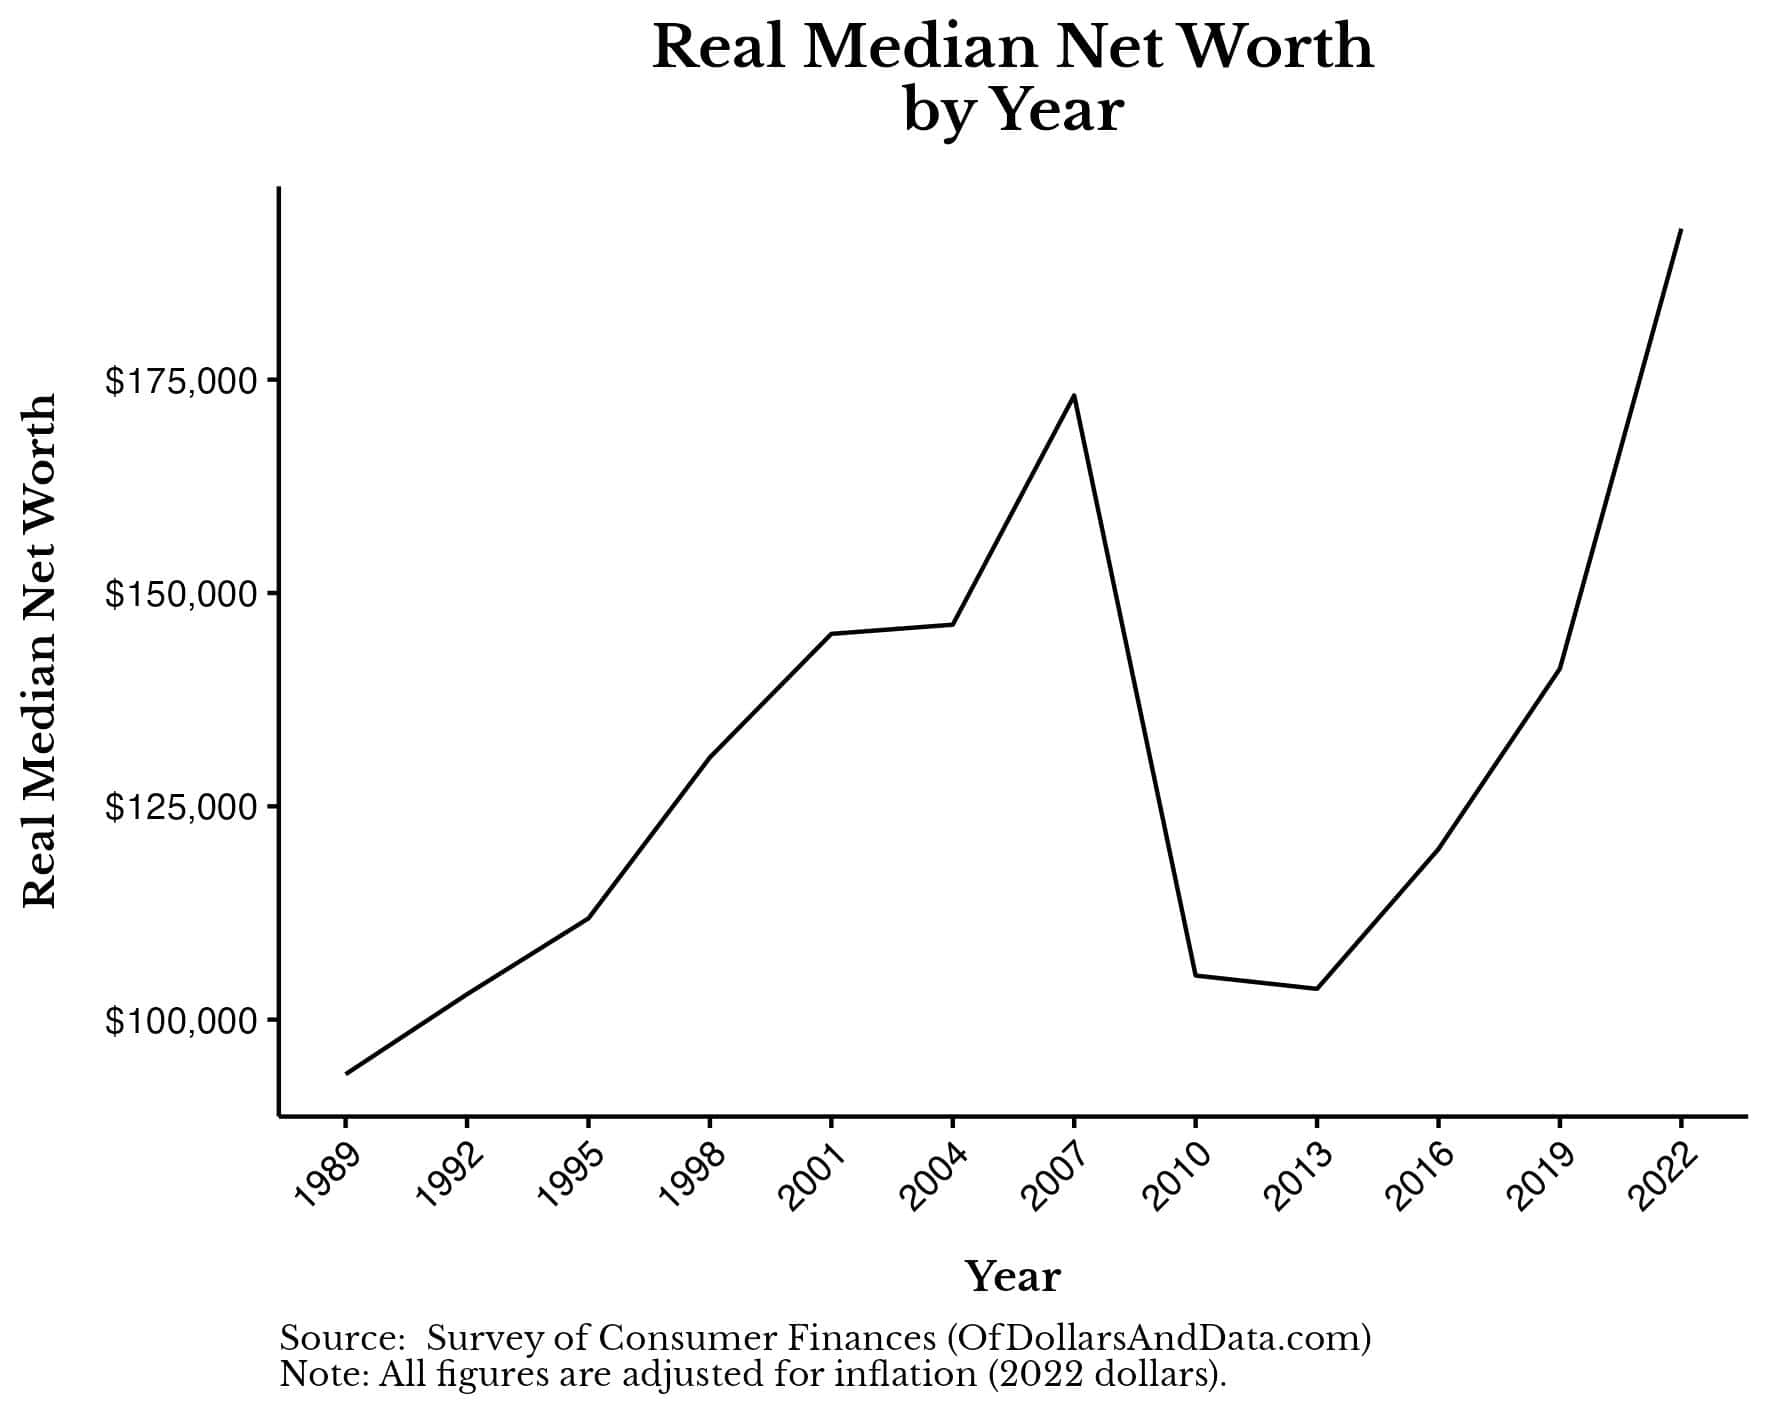
More importantly, from 2019 to 2022 the median U.S. household’s net worth increased by 37%! The median American household now has more wealth than it had before the Great Financial Crisis (“GFC”). While it has been a long, tough decade for many Americans, this latest data suggests that the typical American is starting to prosper yet again.
When we break this data out by age we can see that these gains are happening across the age spectrum as well:
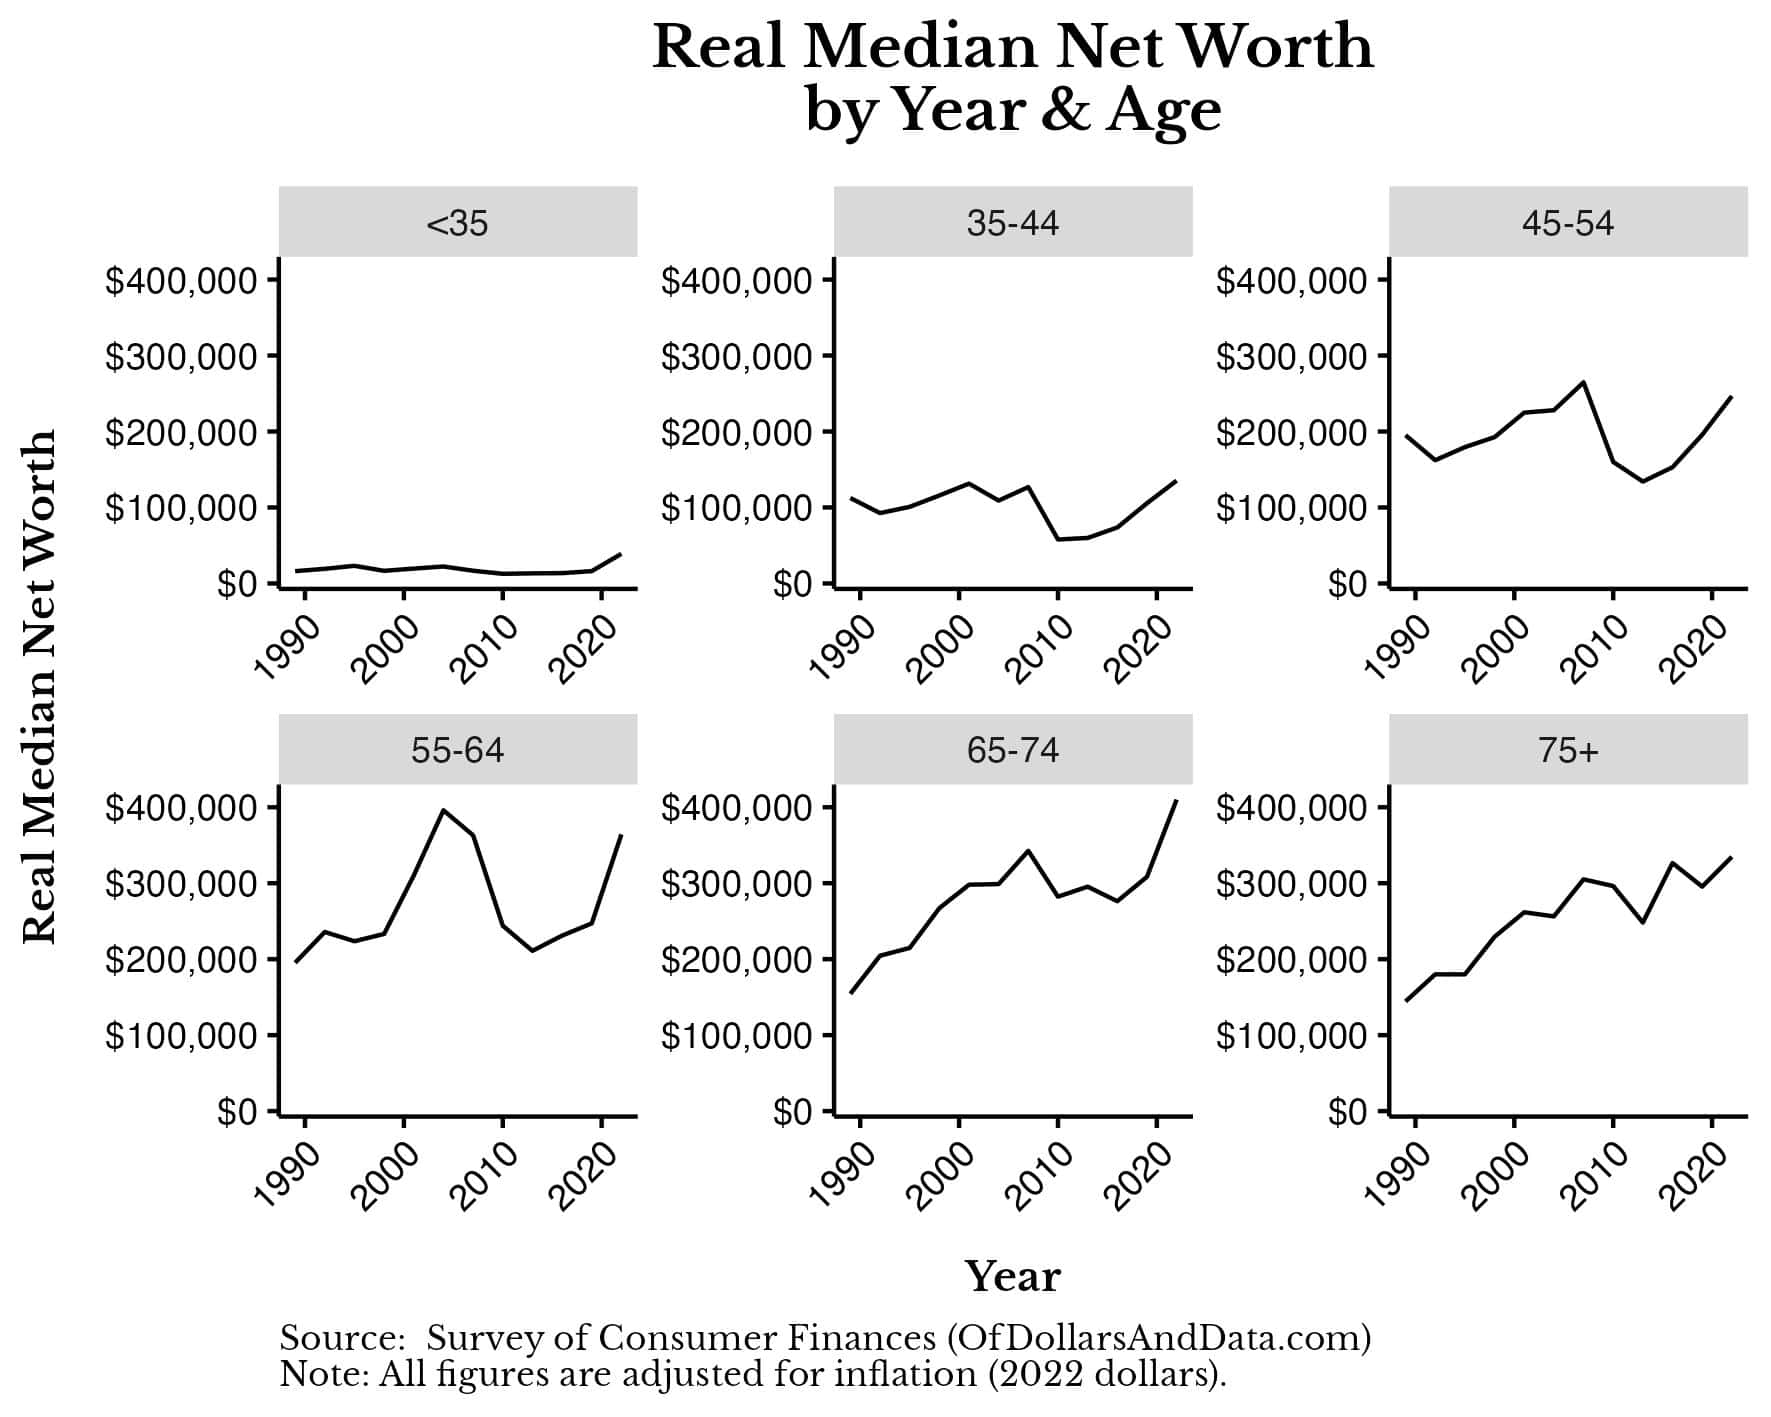
Every single age group is doing roughly the same or better than they were in 2007 (i.e. pre-GFC). This is especially true among households under 35.
For a long time the media has noted how younger households have been unable to get ahead. And, while I agree that the data looked bleak in prior years, the latest data tells quite a different story:
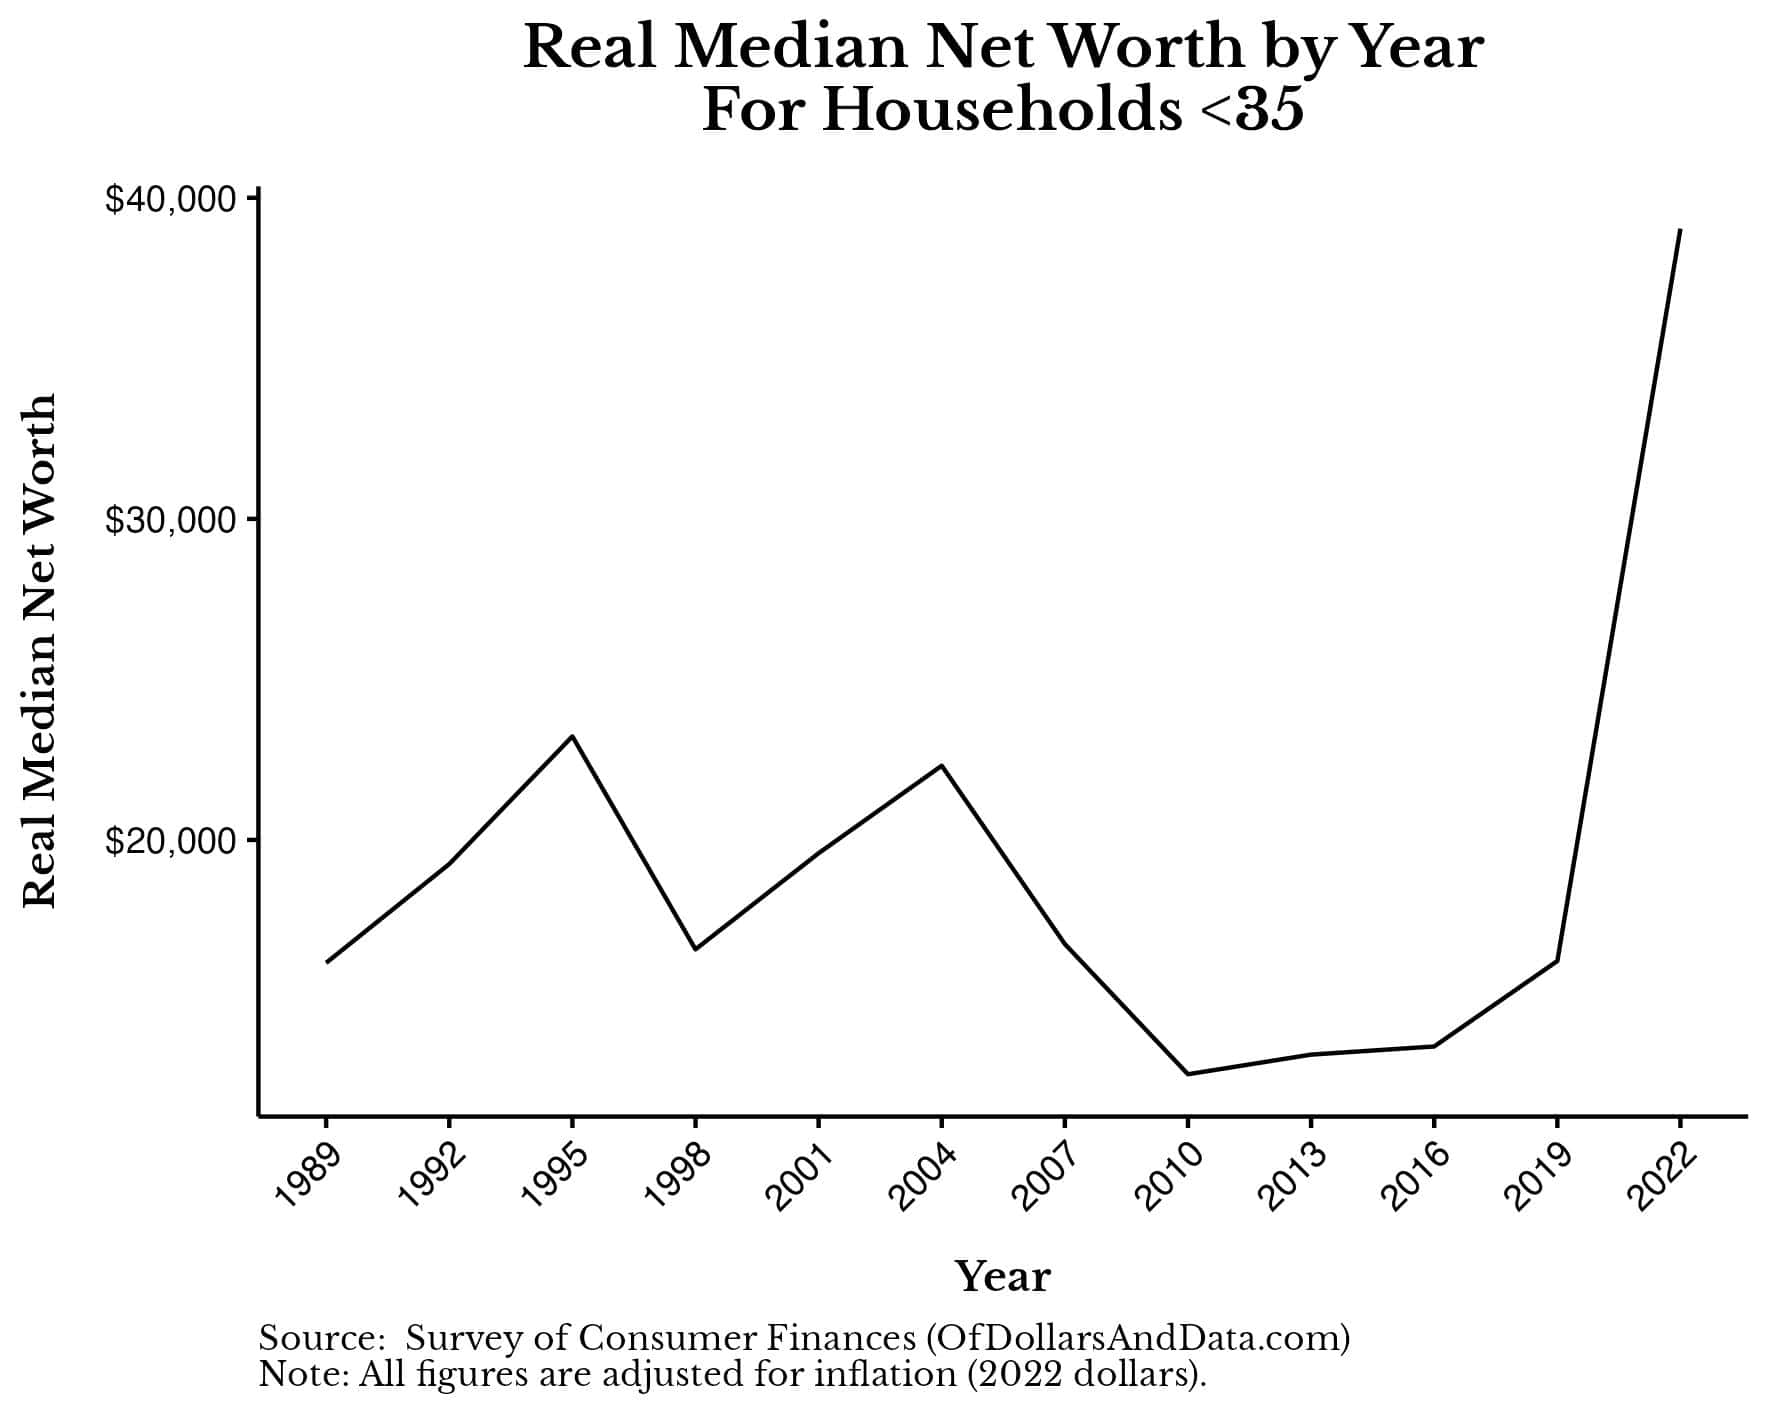
The wealth of the youngest American households has exploded in the last three years. What caused this rapid rise in wealth?
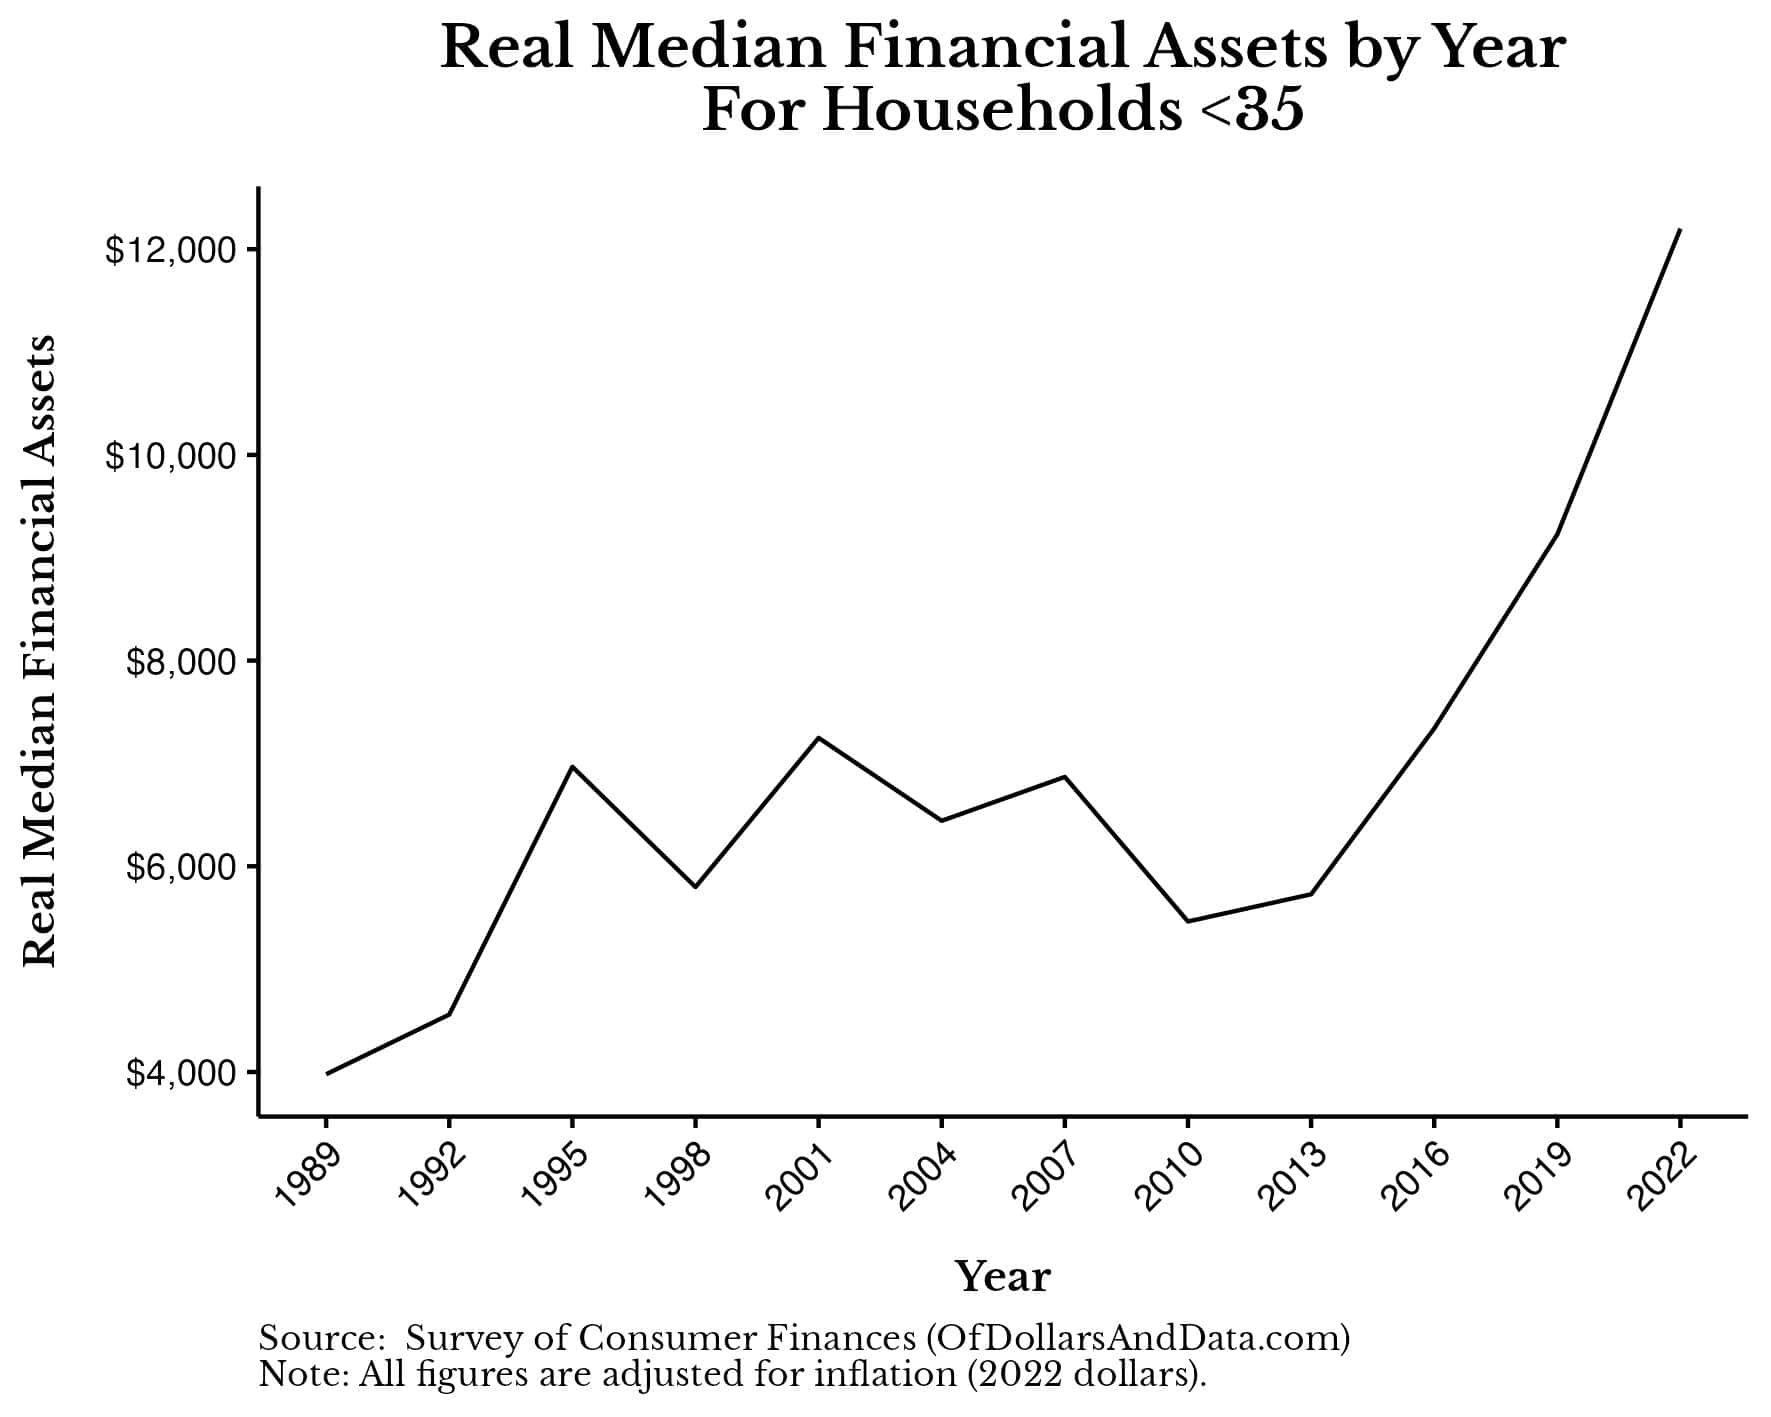
Asset values increased far more than debt loads. We can see this in the large increases in financial assets, home equity, and non-financial assets (e.g. vehicle values). For example, below is a chart showing the increase in median financial assets for those households under 35:
And we see the same thing if we were to look at the median vehicle value for these households as well:
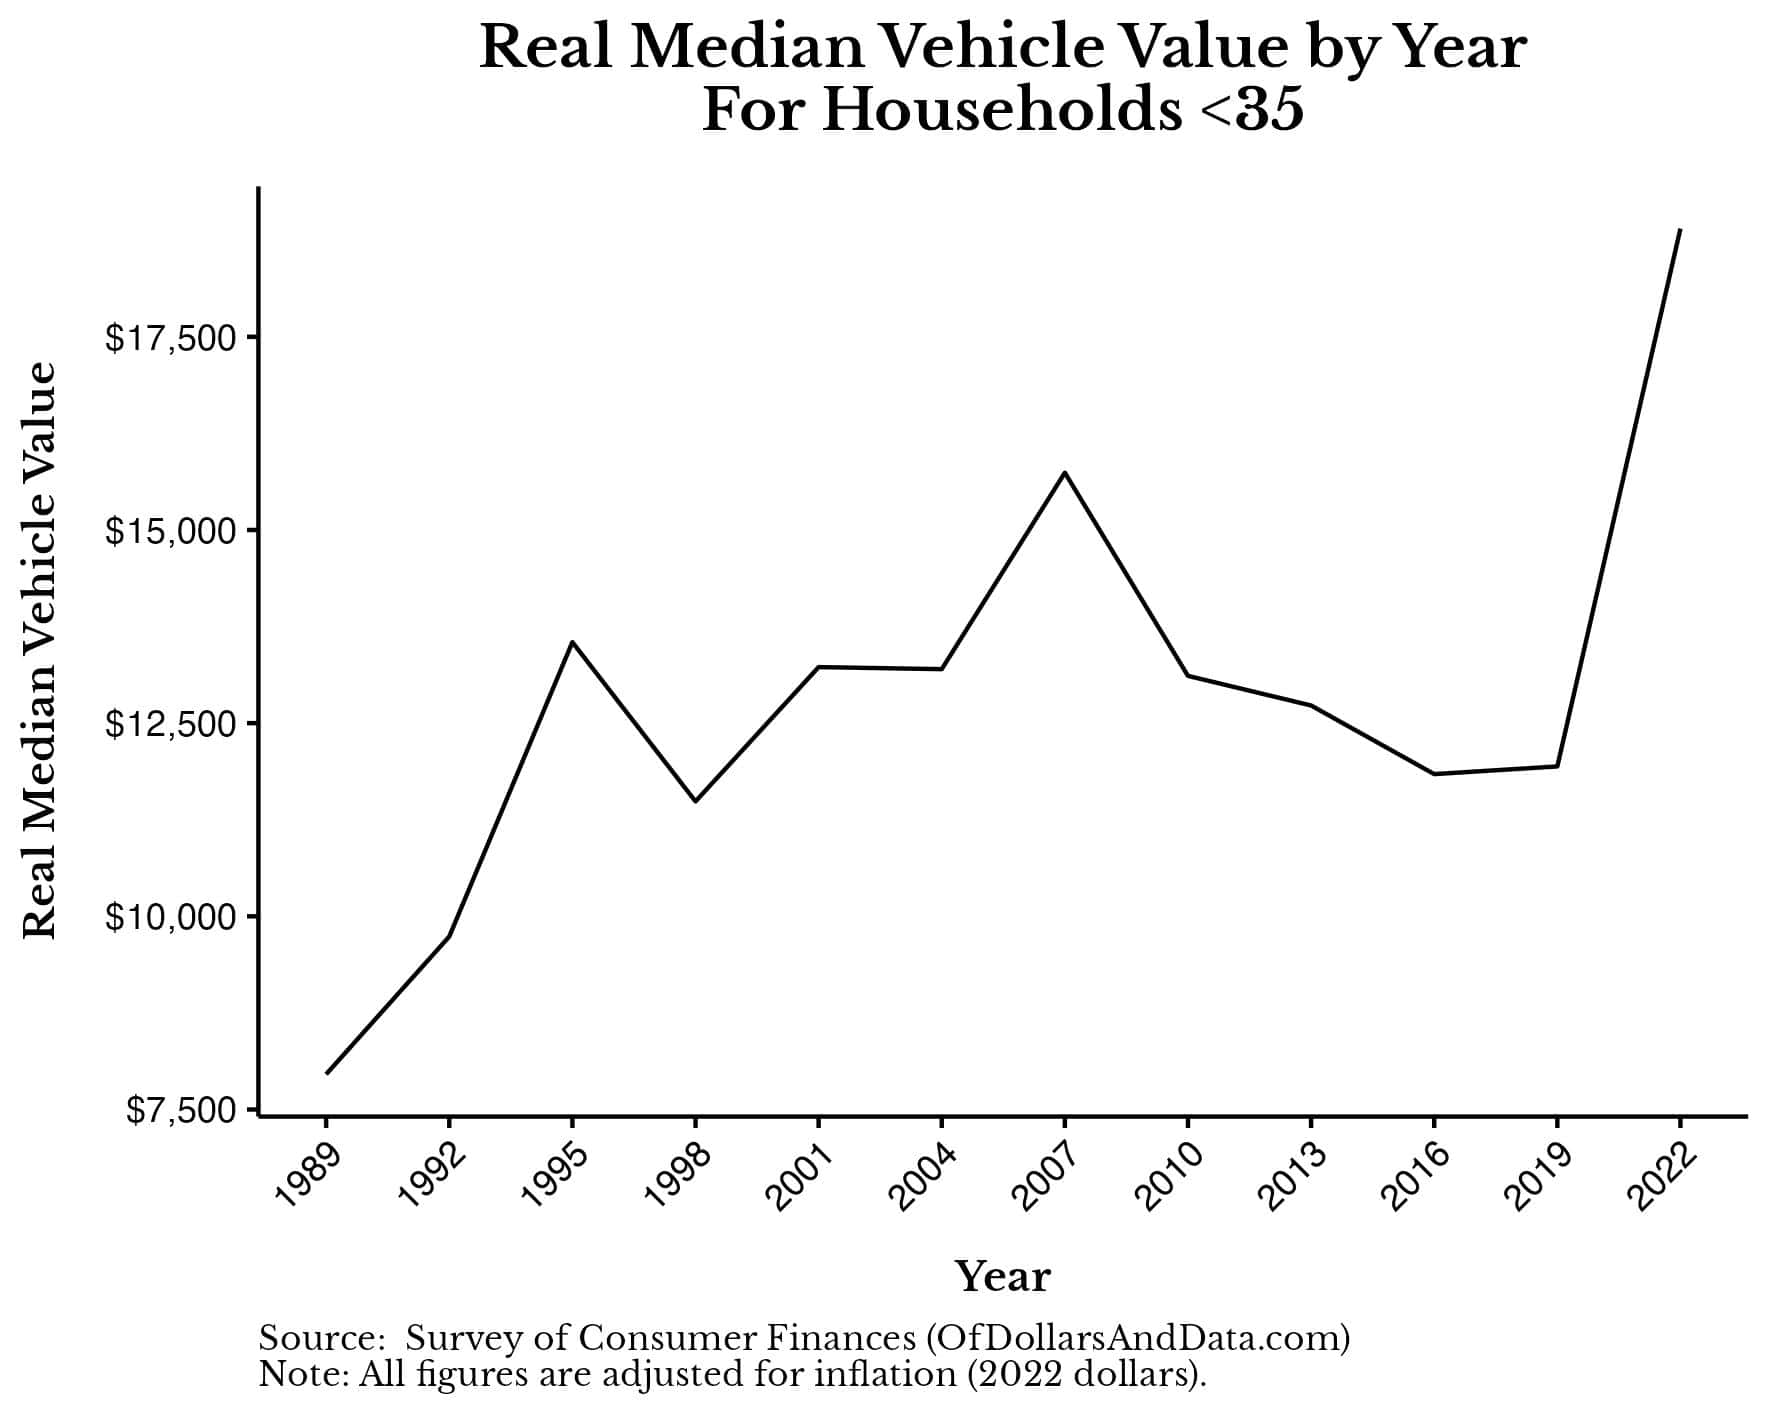
All of this suggests that the Millennials aren’t doing as badly as the media has often portrayed them. I’ve argued this point before when another data sourced suggested that this was the case, but now the SCF has proven this beyond a reasonable doubt. Of all the changes I’ve seen in the net worth by age data over time, this is the one that gives me the most hope.
While the media might make it seem like the typical U.S. household is on the verge of collapse, the latest data suggests otherwise. The rising tide of American capitalism seems to be lifting all boats across all age groups, especially among the youngest households.
Now that we’ve taken a look at how American net worth has changed over time, let’s wrap things up by discussing what it means for you.
The Bottom Line
Understanding the average net worth by age and how it changes is more than just a financial exercise—it’s also a way to gauge your financial health in the context of your peer group. While the average net worth figures shown above can be skewed by outliers, looking at the distribution of outcomes—and particularly the median—can offer a more relatable snapshot.
Regardless of whether you are at the 25th percentile or the 90th percentile of the wealth spectrum, it’s crucial to remember that these are just benchmarks. Your financial journey is yours alone and will be influenced by a variety of factors such as career choice, inheritance, and luck. Don’t lose sight of this as you digest the figures listed above.
Either way, keep moving towards your financial goals as they are the only ones that will matter in the end. Happy investing and thank you for reading!
If you liked this post, consider signing up for my newsletter.
This is post 369. Any code I have related to this post can be found here with the same numbering: https://github.com/nmaggiulli/of-dollars-and-data

