


In October of last year I asked people on Twitter whether they knew how well their investments had done since they started investing. Of those that answered, 33% said “Yes” and 66% said “No.” Chances are that you are in the “No” camp. So was I, until recently.
Around the same time as my Twitter poll, YCharts released a tool called Dynamic Model Portfolios, which allows you to recreate your exact portfolio performance based on your allocation over time. The tool takes in an Excel file of dates, ticker symbols, and weights and then creates your portfolio in their system. Once it is entered, you can then compare your portfolio’s performance to any other asset/portfolio that you want. I explain how it works in more detail here.
Since I had my asset allocation recorded going back to 2013, I decided to run the numbers and see how well I had done over time. But, before we get to that, let me tell you what’s in my portfolio.
The Nick Maggiulli Portfolio
My portfolio allocation has varied over time. I’ve traded in and out of gold more than once, I’ve altered the size of my bond allocation, and, in recent years, I’ve purchased art and Bitcoin as well. While investing is clean in theory, it can be messy in practice.
As a result, instead of providing my exact allocation at each point in time (which is what I did when inputting my data into YCharts), I’ve created an average of sorts for simplicity’s sake. What you see below, I believe, accurately reflects my investment performance since 2013 (assuming annual rebalancing).
With that being said, the Nick Maggiulli Portfolio consists of:
- 30% U.S. Stocks (S&P 500)
- 30% International Stocks
- 15% Developed Markets
- 15% Emerging Markets
- 15% Intermediate U.S. Bonds
- 10% U.S. Small Cap Value Stocks
- 10% U.S. Real Estate Investment Trusts (REITs)
- 5% Gold
As you can see, this portfolio has only 15% in U.S. bonds, which reflects my younger age and my higher appetite for risk. In addition, while 40% of the portfolio is allocated to U.S. stocks, 45% of the portfolio is allocated to other risk assets.
How Well Has My Portfolio Performed?
After uploading my historical allocation data, here is what I found:
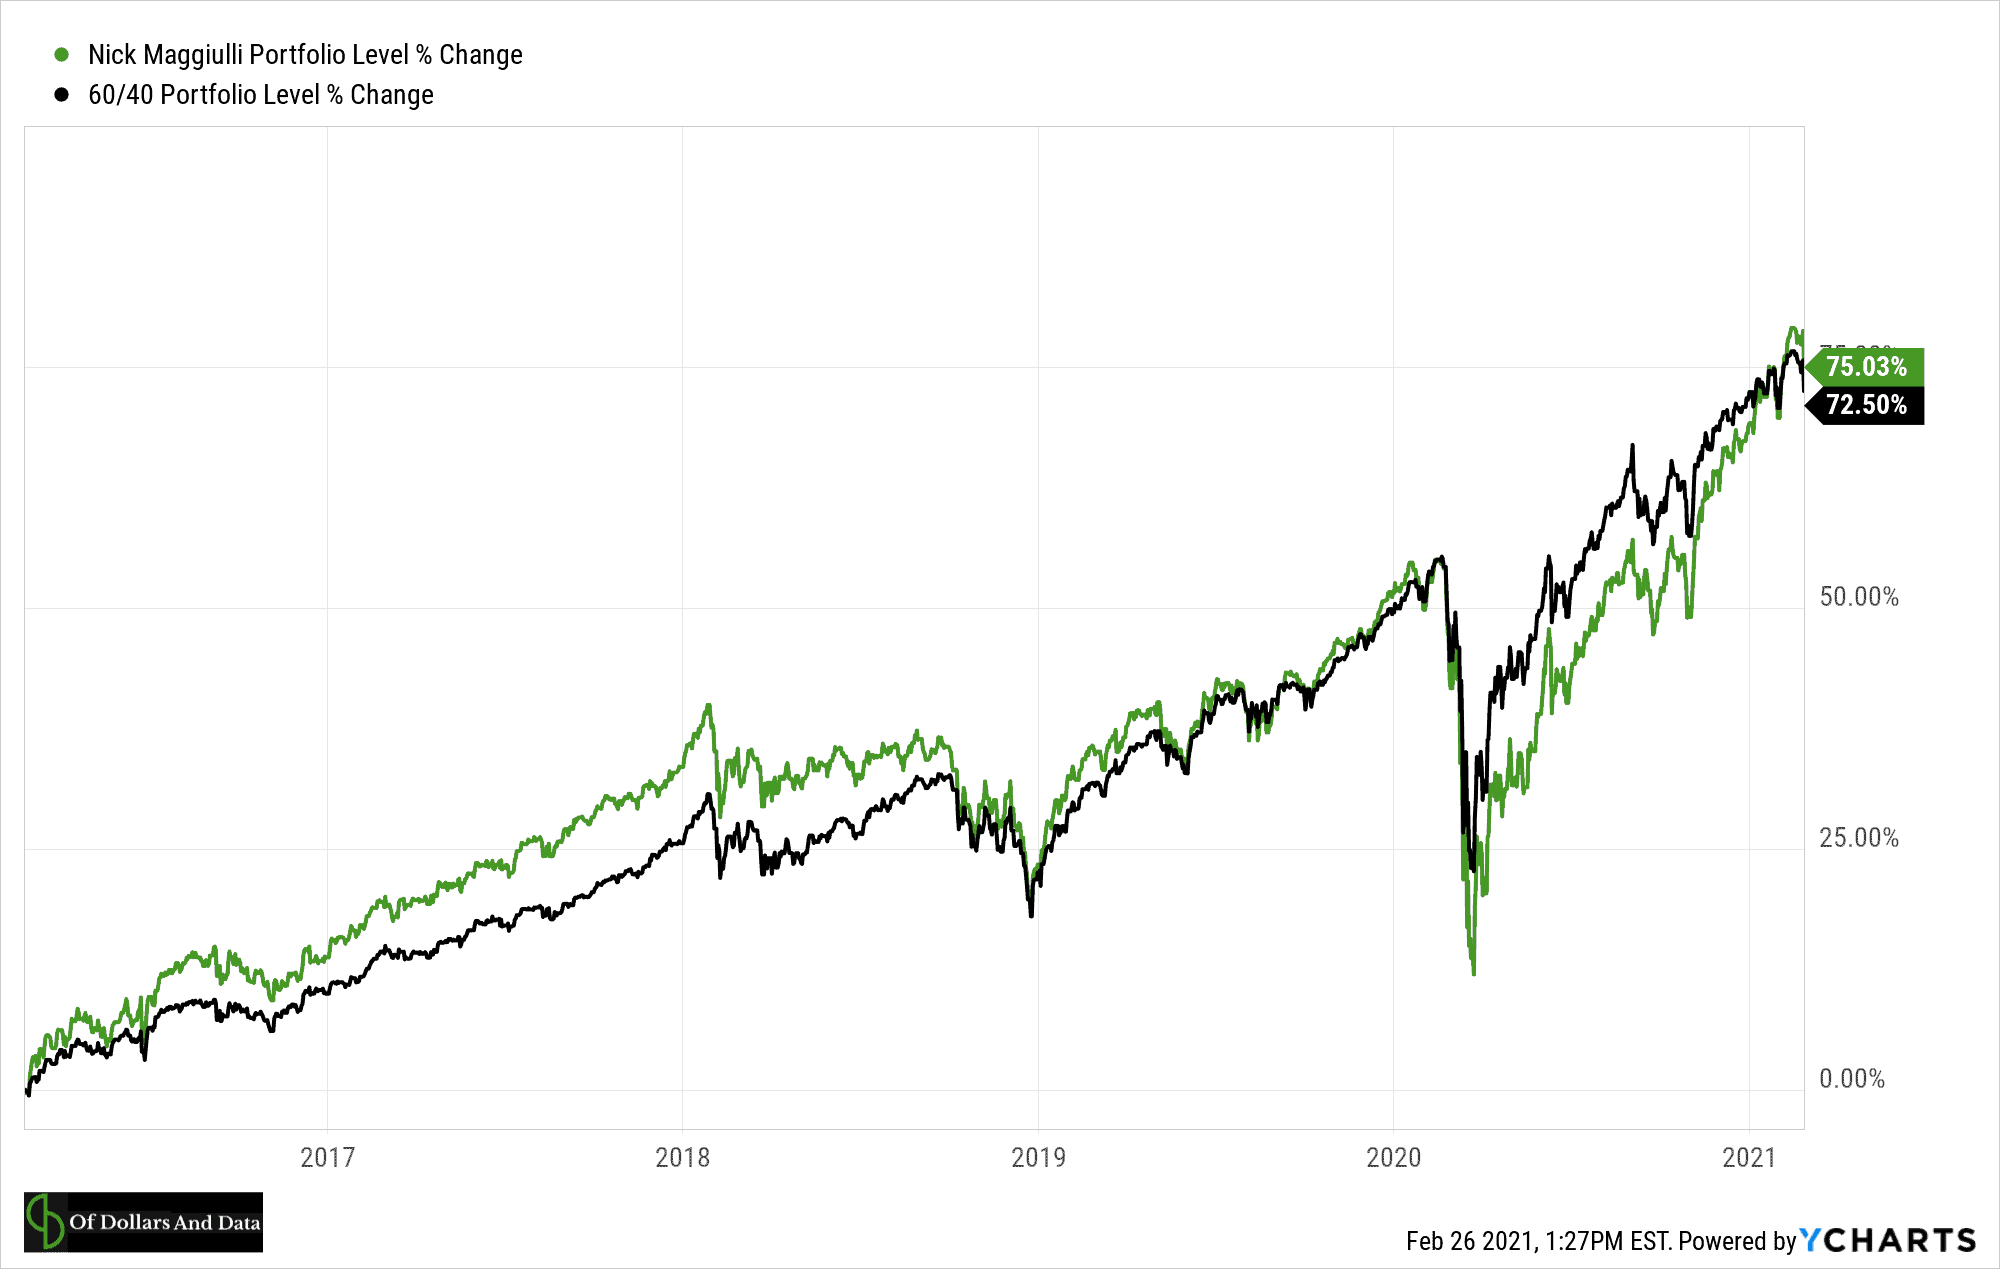
- If we compare my portfolio to a traditional 60/40 (U.S. stock/bond) portfolio, you can see that the relative performance has varied over time:
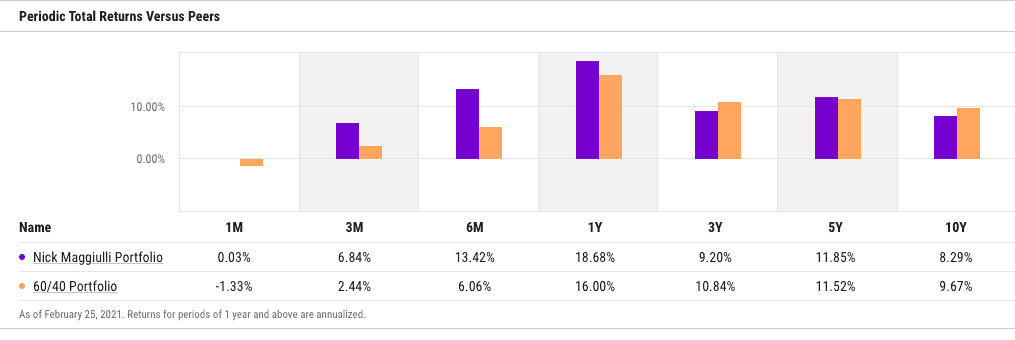
- For example, while my portfolio has underperformed over the last decade, it has slightly beaten a 60/40 portfolio over the last five years:
- However, my portfolio has been crushed by the S&P 500 in those same five years:
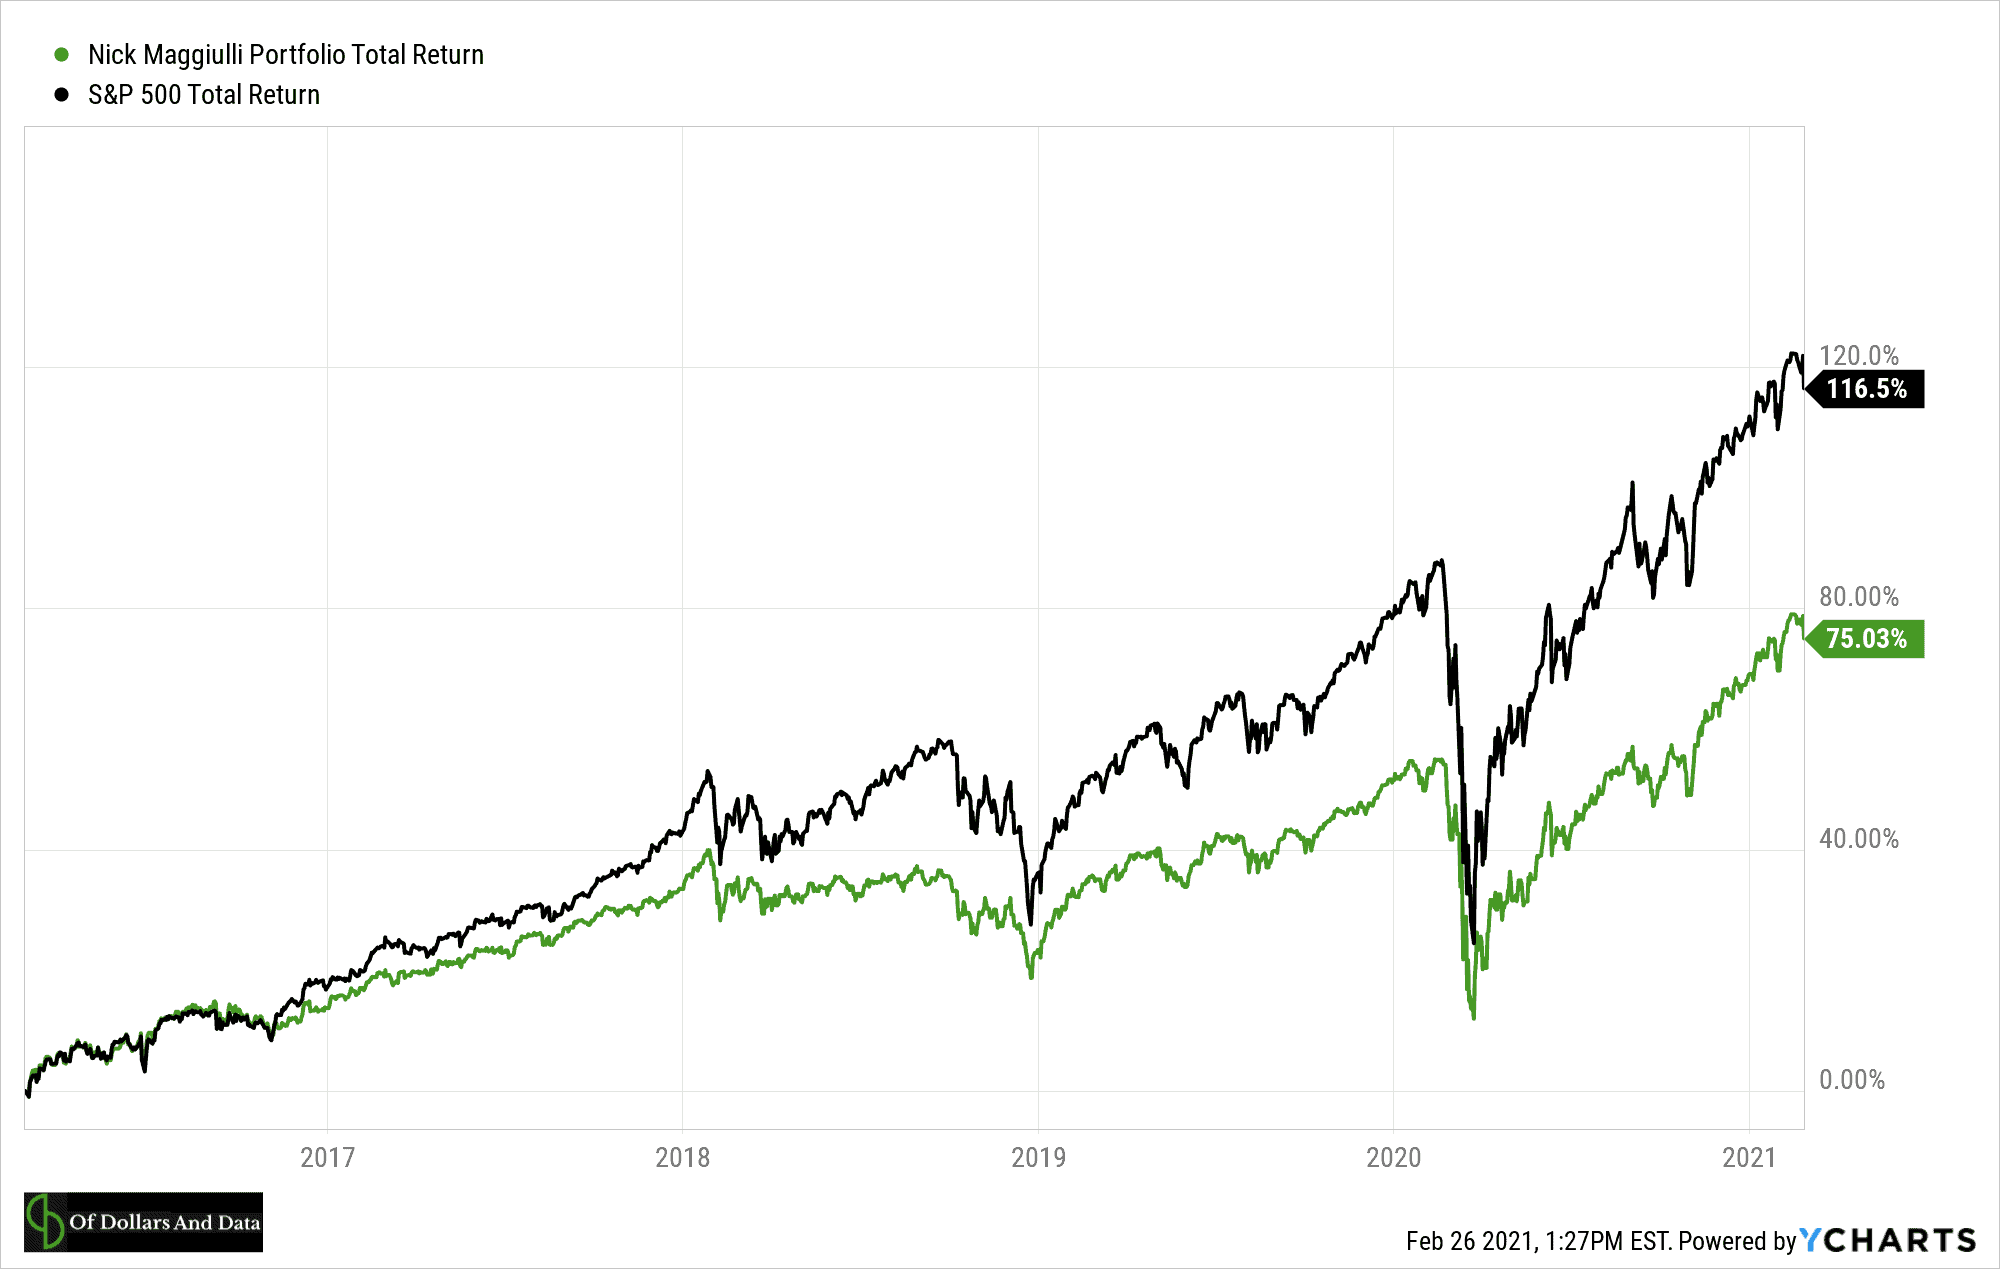
In fact, since 2013 the annual return of the Nick Maggiulli Portfolio has been 9.2% compared to 10.5% for a 60/40 portfolio and 13.2% for the S&P 500.
Why has my portfolio lagged these popular benchmarks?
Two reasons:
- I own U.S. bonds.
- I own international stocks.
The bonds explain why I have underperformed the S&P 500. Since bonds tend to have lower returns than stocks, a portfolio with more bonds should underperform a portfolio with more stocks most of the time. However, this doesn’t explain why my portfolio underperformed a 60/40 portfolio despite only having 15% in U.S. bonds.
This is where international stocks come in. Though I have less bond exposure than a 60/40, I have 30% of my portfolio allocated to international stocks. And because international stocks have severely underperformed the S&P 500, I’ve underperformed as well.
In fact, developed market stocks have returned 4% per year while emerging market stocks have returned 2.1% per year since 2013. That’s basically 10% in annual underperformance when compared to the S&P 500 over the same time period!
It’s been a rough decade for international equity investors. I know it far too well.
However, that’s not the only factor that explains my underperformance, it’s just the biggest factor. The other risk assets that I have owned (Gold, U.S. REITs, and U.S. Small Cap Value Stocks) haven’t done as well as the S&P 500 either:
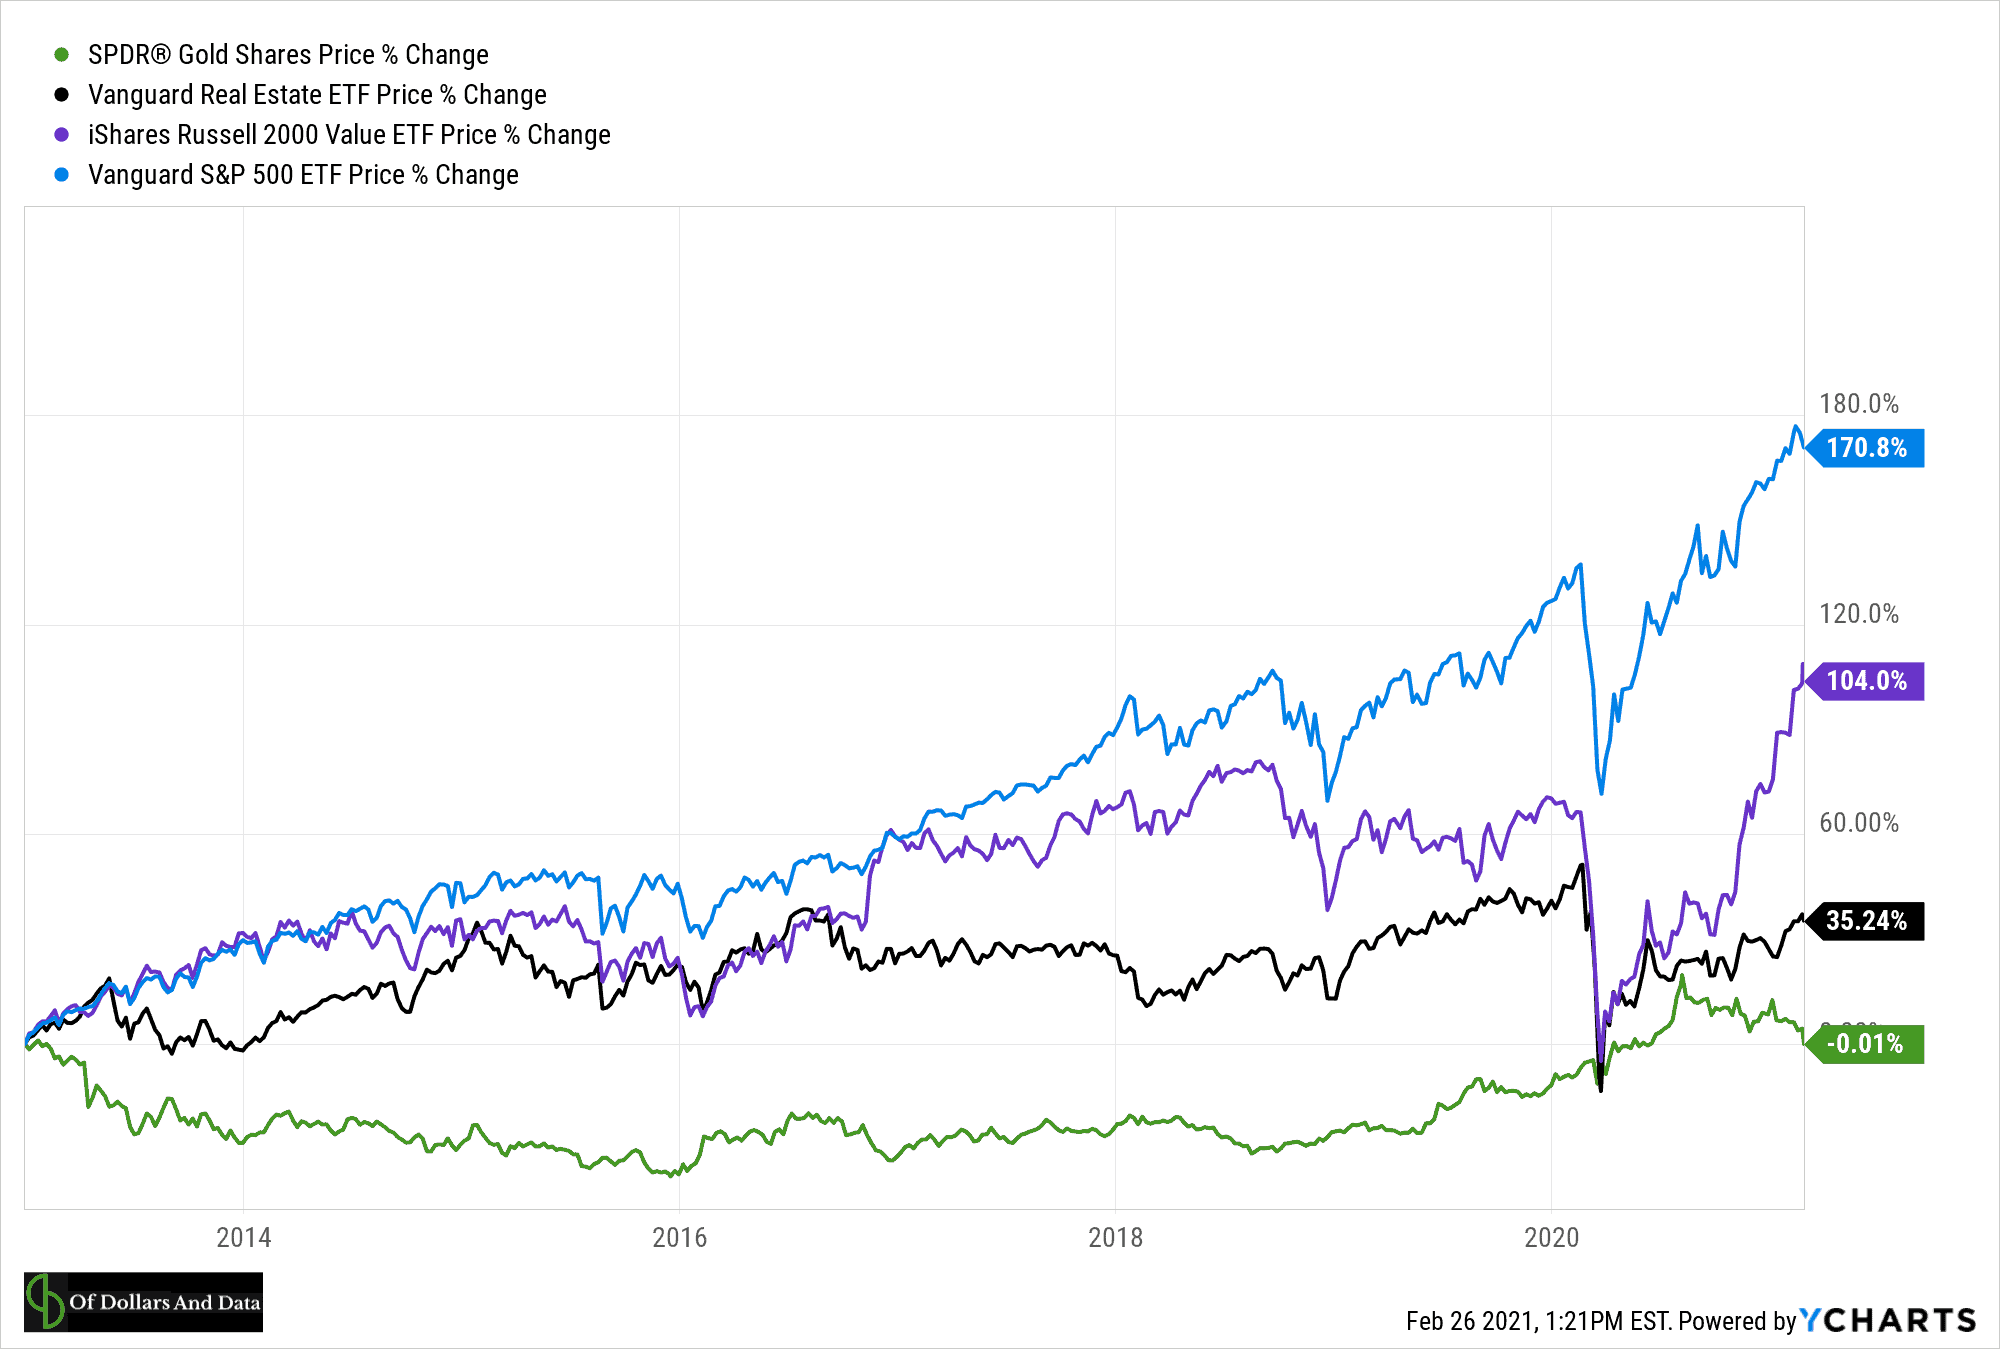
As you can see, even my best performer relative to the S&P 500 (U.S. Small Cap Value) still underperformed by 67% in total. There’s no other way to say it—the S&P 500 has killed it and few asset classes have kept up.
However, this says nothing about my absolute performance, just my relative performance.
Why Absolute Performance is All That Matters
On absolute terms, the Nick Maggiulli Portfolio has done well. Getting 9% each year (or 6%-7% after inflation) is more than I could have ever hoped for. In all of the financial projections I have ever done for myself , I’ve assumed a 4% real rate of return. So getting 6%-7% is a huge win. I know this won’t be guaranteed in the future, but it’s nice.
Still, this won’t stop people from focusing on my relative performance. Underperforming by 1%-4% a year (depending on your benchmark) isn’t easy to gloss over. But does this relative underperformance even matter? Not at all.
The only thing that matters is whether your portfolio is providing enough growth to meet your future financial needs. If you are unable to meet your financial needs with your current returns then, yes, underperformance feels terrible. However, your absolute performance is what you should care about. As I have written previously:
If you had invested from 1960-1980 and beaten the market by 5% each year, you would have made less money than if you had invested from 1980-2000 and underperformed the market by 5% a year.
It’s a crazy statistic, but it’s true. From 1960-1980, U.S. stocks returned a real 2% per year. From 1980-2000 it was closer to 13%. Therefore, (2% + 5%) < (13% – 5%). Yes, this example is an extreme form of cherry-picking, but it illustrates the power of absolute performance over relative performance. Alpha is great, but Beta is better.
This is why I have little interest in discussing whether you or anyone (besides Jim Simons) can beat the market. Few people can do it consistently and those who do may just be lucky. And by the time you verify that someone isn’t lucky, they may have lost their edge altogether. Outperformance is never so permanent.
More importantly though, you shouldn’t need market beating performance to reach your financial goals. If you do, then your financial problems are much bigger than your investment performance. Because markets rarely deliver the returns you want when you want them. This is why you have to build your finances around conservative assumptions that are likely to hold up over time. If you don’t, then you could end up disappointed down the road.
Yes, it’s good to be honest about your investment performance and where it can be improved. However, it’s more important to realize how much it will actually matter in the long run.
If you are interested in analyzing your own investment performance, you can sign up for YCharts here and get 20% off (new users only). Happy investing and thank you for reading!
If you liked this post, consider signing up for my newsletter.
This is post 230. Any code I have related to this post can be found here with the same numbering: https://github.com/nmaggiulli/of-dollars-and-data