This is the last article you will ever need to read on market timing. It’s a bold claim, but I’m not messing around. So strap in, because the training wheels are off on this one. To start, let’s play a game:
Imagine you are dropped somewhere in history between 1920 and 1979 and you have to invest in the U.S. stock market for the next 40 years. You have 2 investment strategies to choose from.
- Dollar-cost averaging (DCA): You invest $100 every month for all 40 years.
- Buy the Dip: You save $100 each month and only buy when the market is in a dip. A “dip” is defined as anytime when the market is not at an all-time high. But, I am going to make this second strategy even better. Not only will you buy the dip, but I am going to make you omniscient (i.e. “God”) about when you buy. You will know exactly when the market is at the absolute bottom between any two all-time highs. This will ensure that when you do buy the dip, it is always at the lowest possible price.
The only other rule in this game is that you cannot move in and out of stocks. Once you make a purchase, you hold those stocks until the end of the time period.
So, which strategy would you choose: DCA or Buy the Dip?
Logically, it seems like Buy the Dip can’t lose. If you know when you are at a bottom, you can always buy at the cheapest price relative to the all-time highs in that period. However, if you actually run this strategy you will see that Buy the Dip underperforms DCA over 70% of the time.
This is true despite the fact that you know exactly when the market will hit a bottom. Even God couldn’t beat dollar-cost averaging.
Why is this true? Because buying the dip only works when you know that a severe decline is coming and you can time it perfectly. Since dips, especially big ones, haven’t happened too often in U.S. market history (i.e. 1930s, 1970s, 2000s), this strategy rarely beats DCA. And the times where it does beat DCA require impeccable timing. Missing the bottom by just 2 months lowers the chance of outperforming DCA from 30% to 3%.
Instead of taking my word for it, let’s dig into the details to see why this is true.
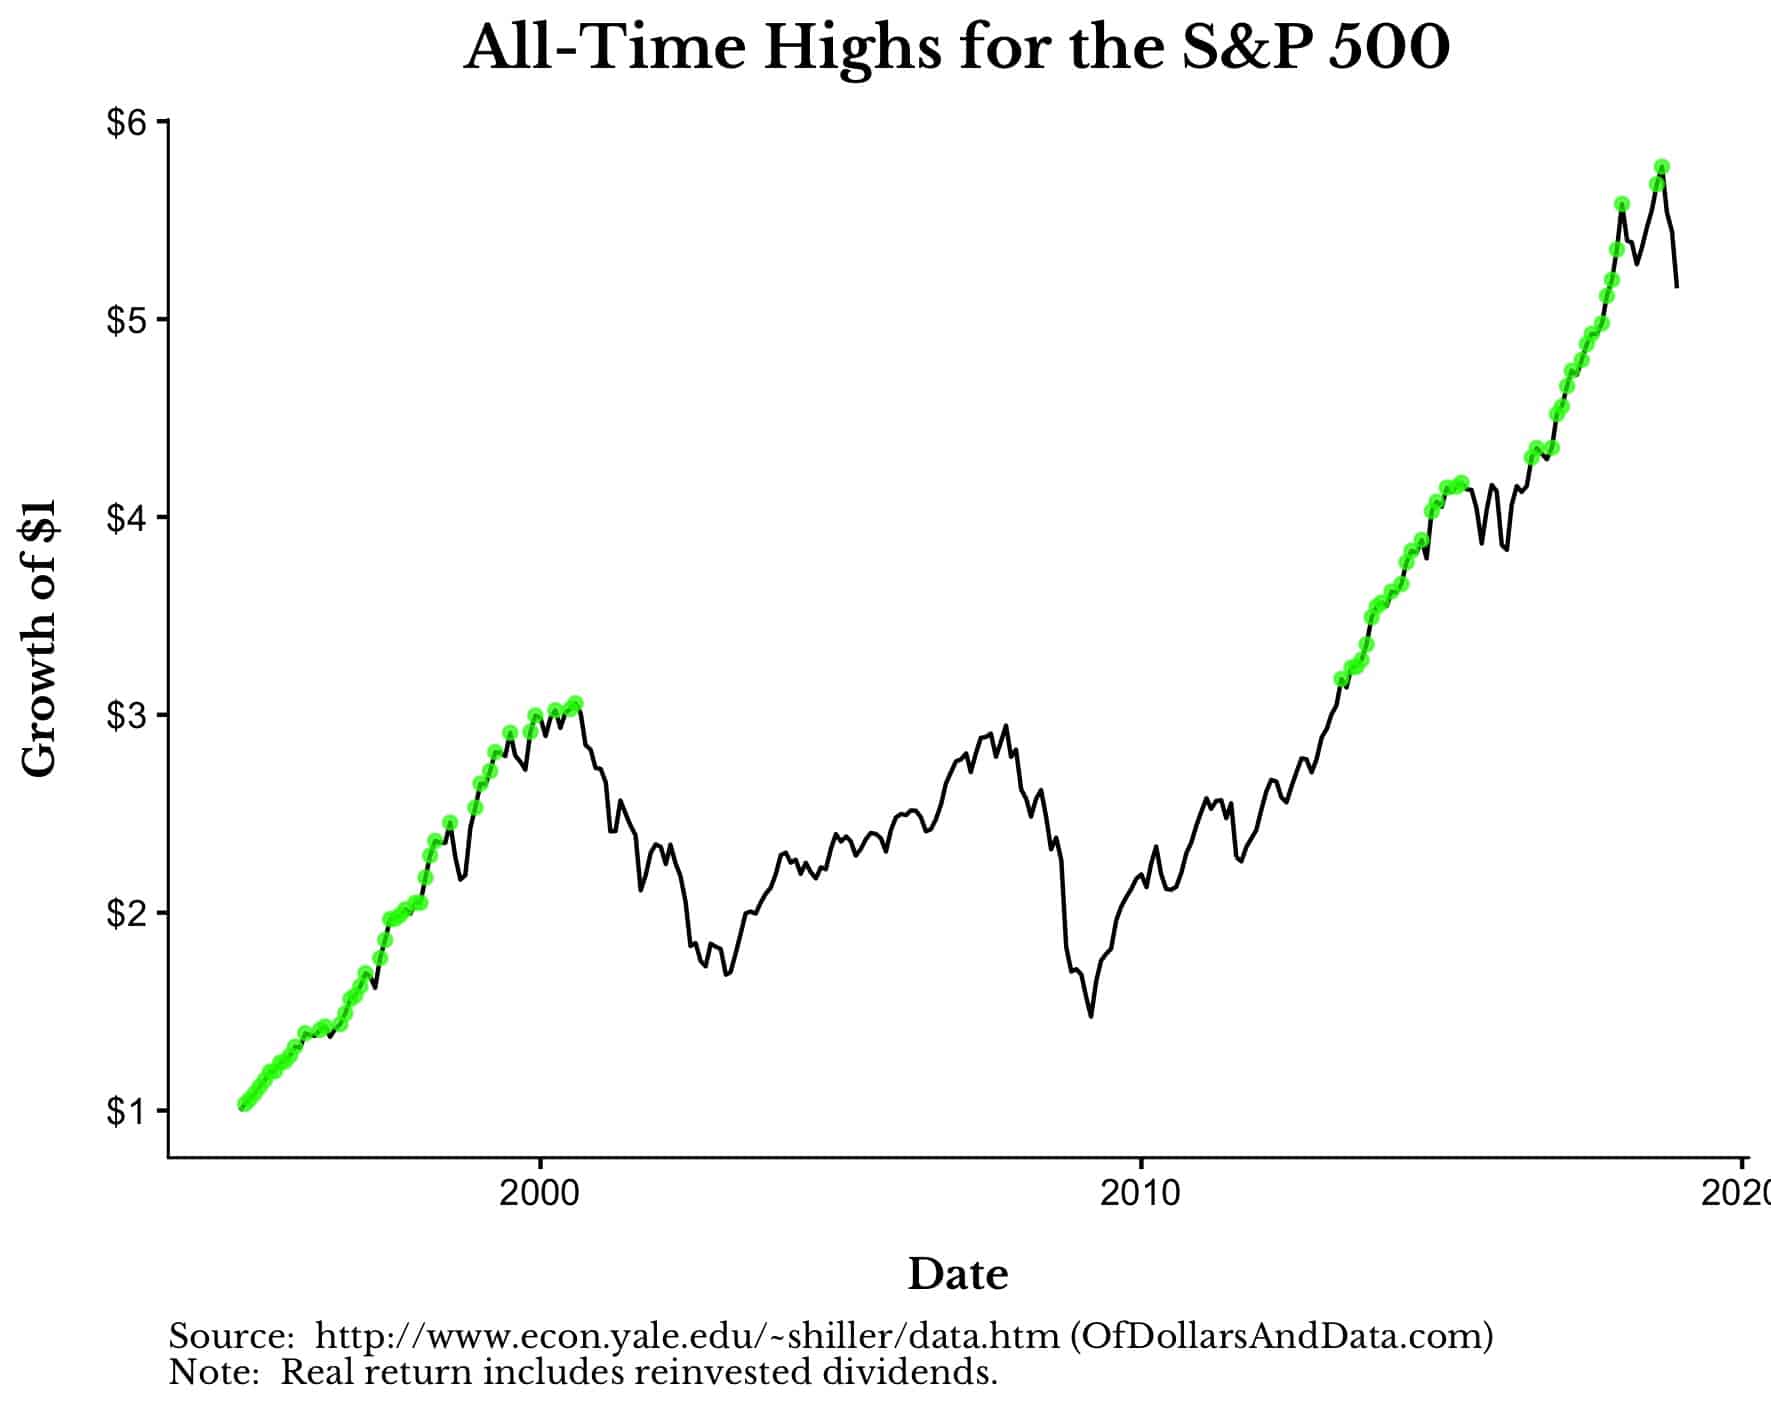
To start, let’s consider the U.S. stock market from January 1995 to December 2018 to familiarize ourselves with this strategy. Below I have plotted the S&P 500 (with dividends and adjusted for inflation) over this time period with the all-time highs colored green:
Now, I am going to show the exact same plot as above, but I am going to add a red dot for every “dip” in the market (the biggest decline between a pair of all-time highs). These dips are the points at which the “Buy the Dip” strategy would make purchases.
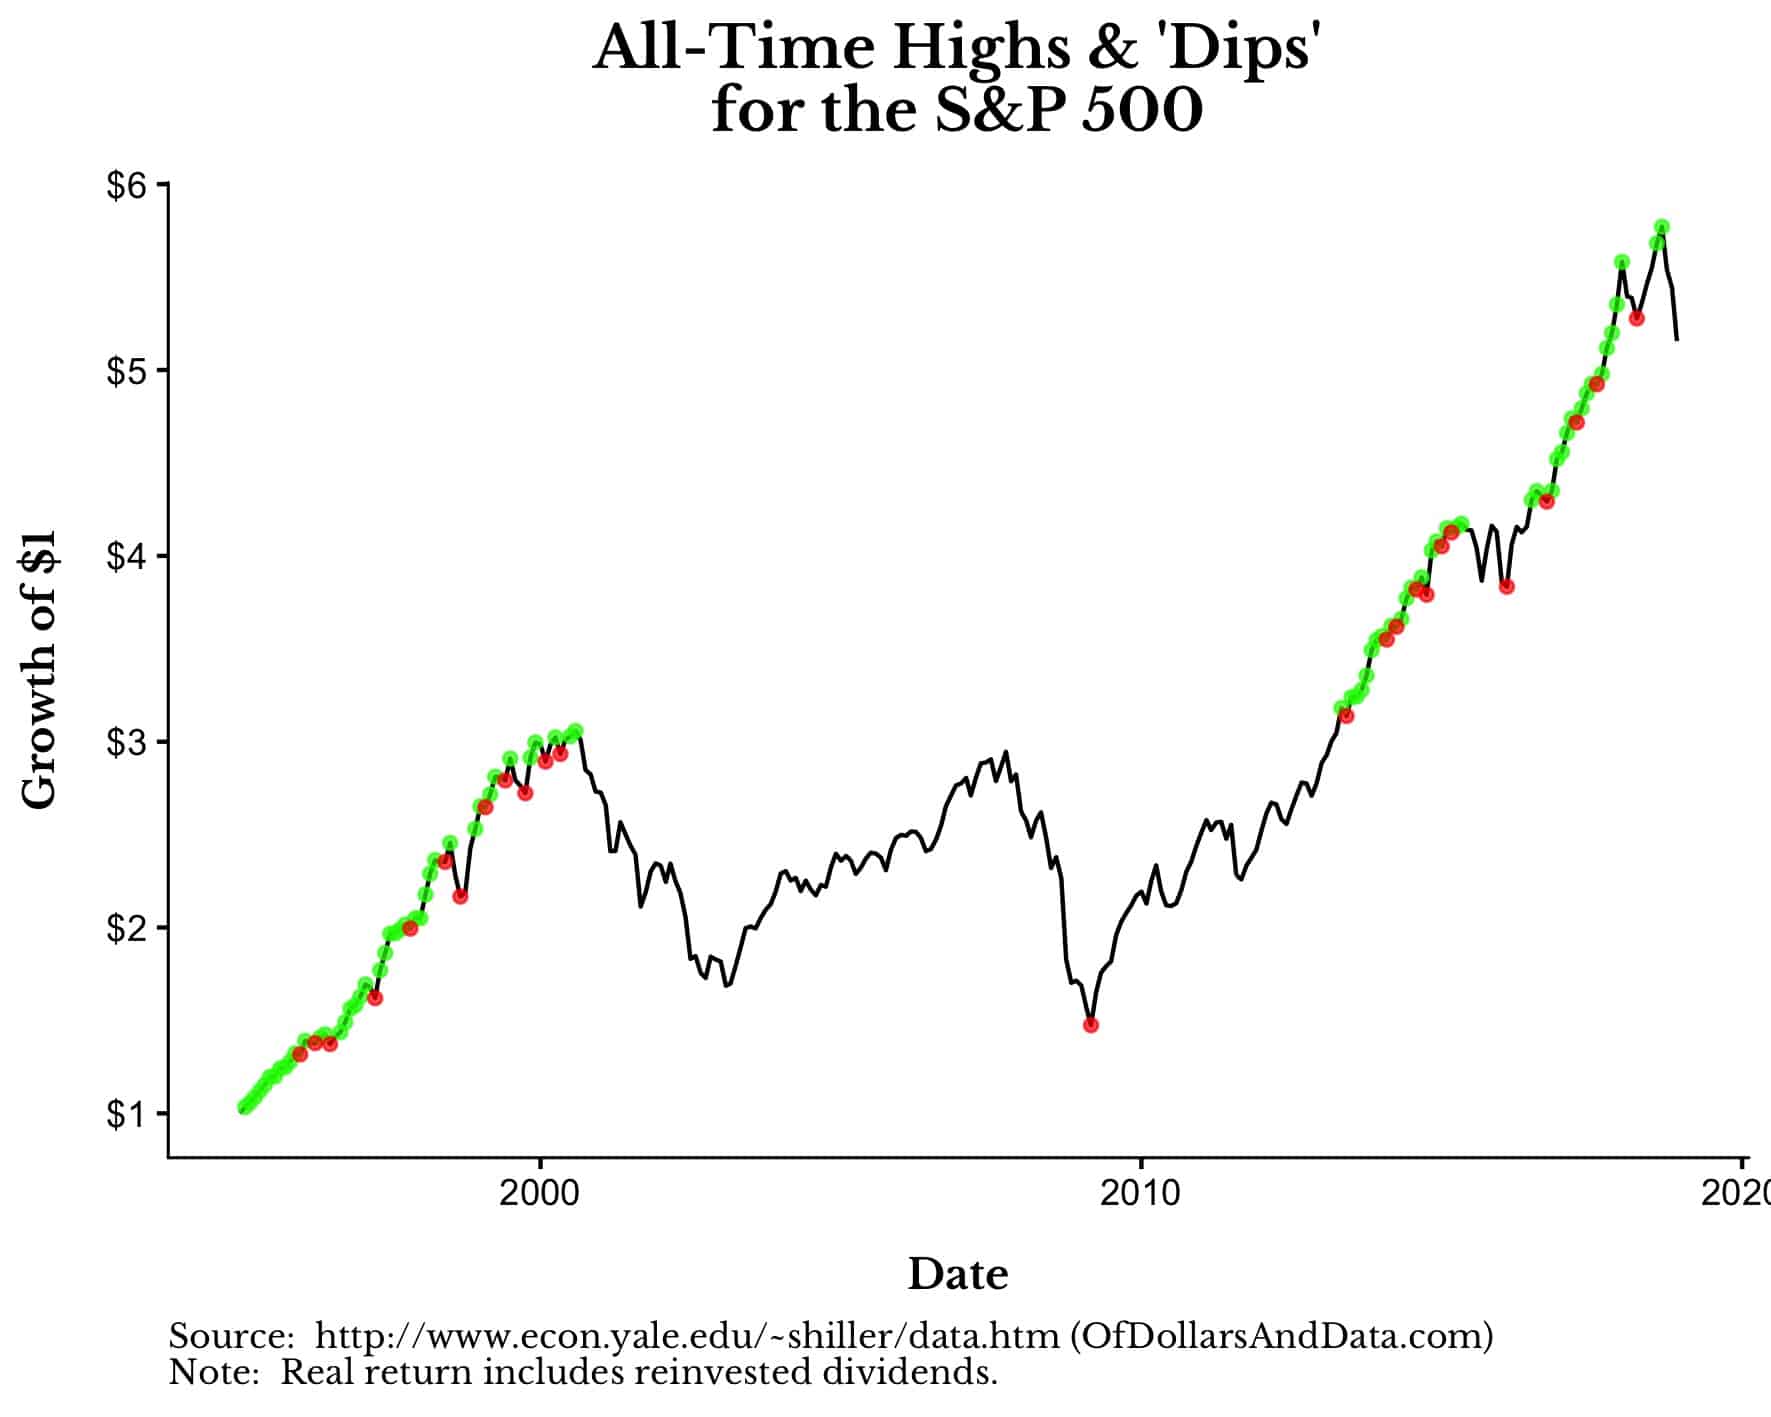
As you can see, the dips (red dots) occur at the lowest point between any two all-time highs (green dots). The most prominent “dip” over this time period occurred in March 2009 (the lone red dot before 2010), which was the lowest point after the market high in August 2000. However, you will also notice that there are many less prominent dips that are nested between all time highs. These dips cluster during bull markets (i.e. mid-to-late 1990s, mid 2010s).
If we wanted to visualize how the Buy the Dip strategy works, I have plotted the amount the strategy has invested in the market and its cash balance over this time period:
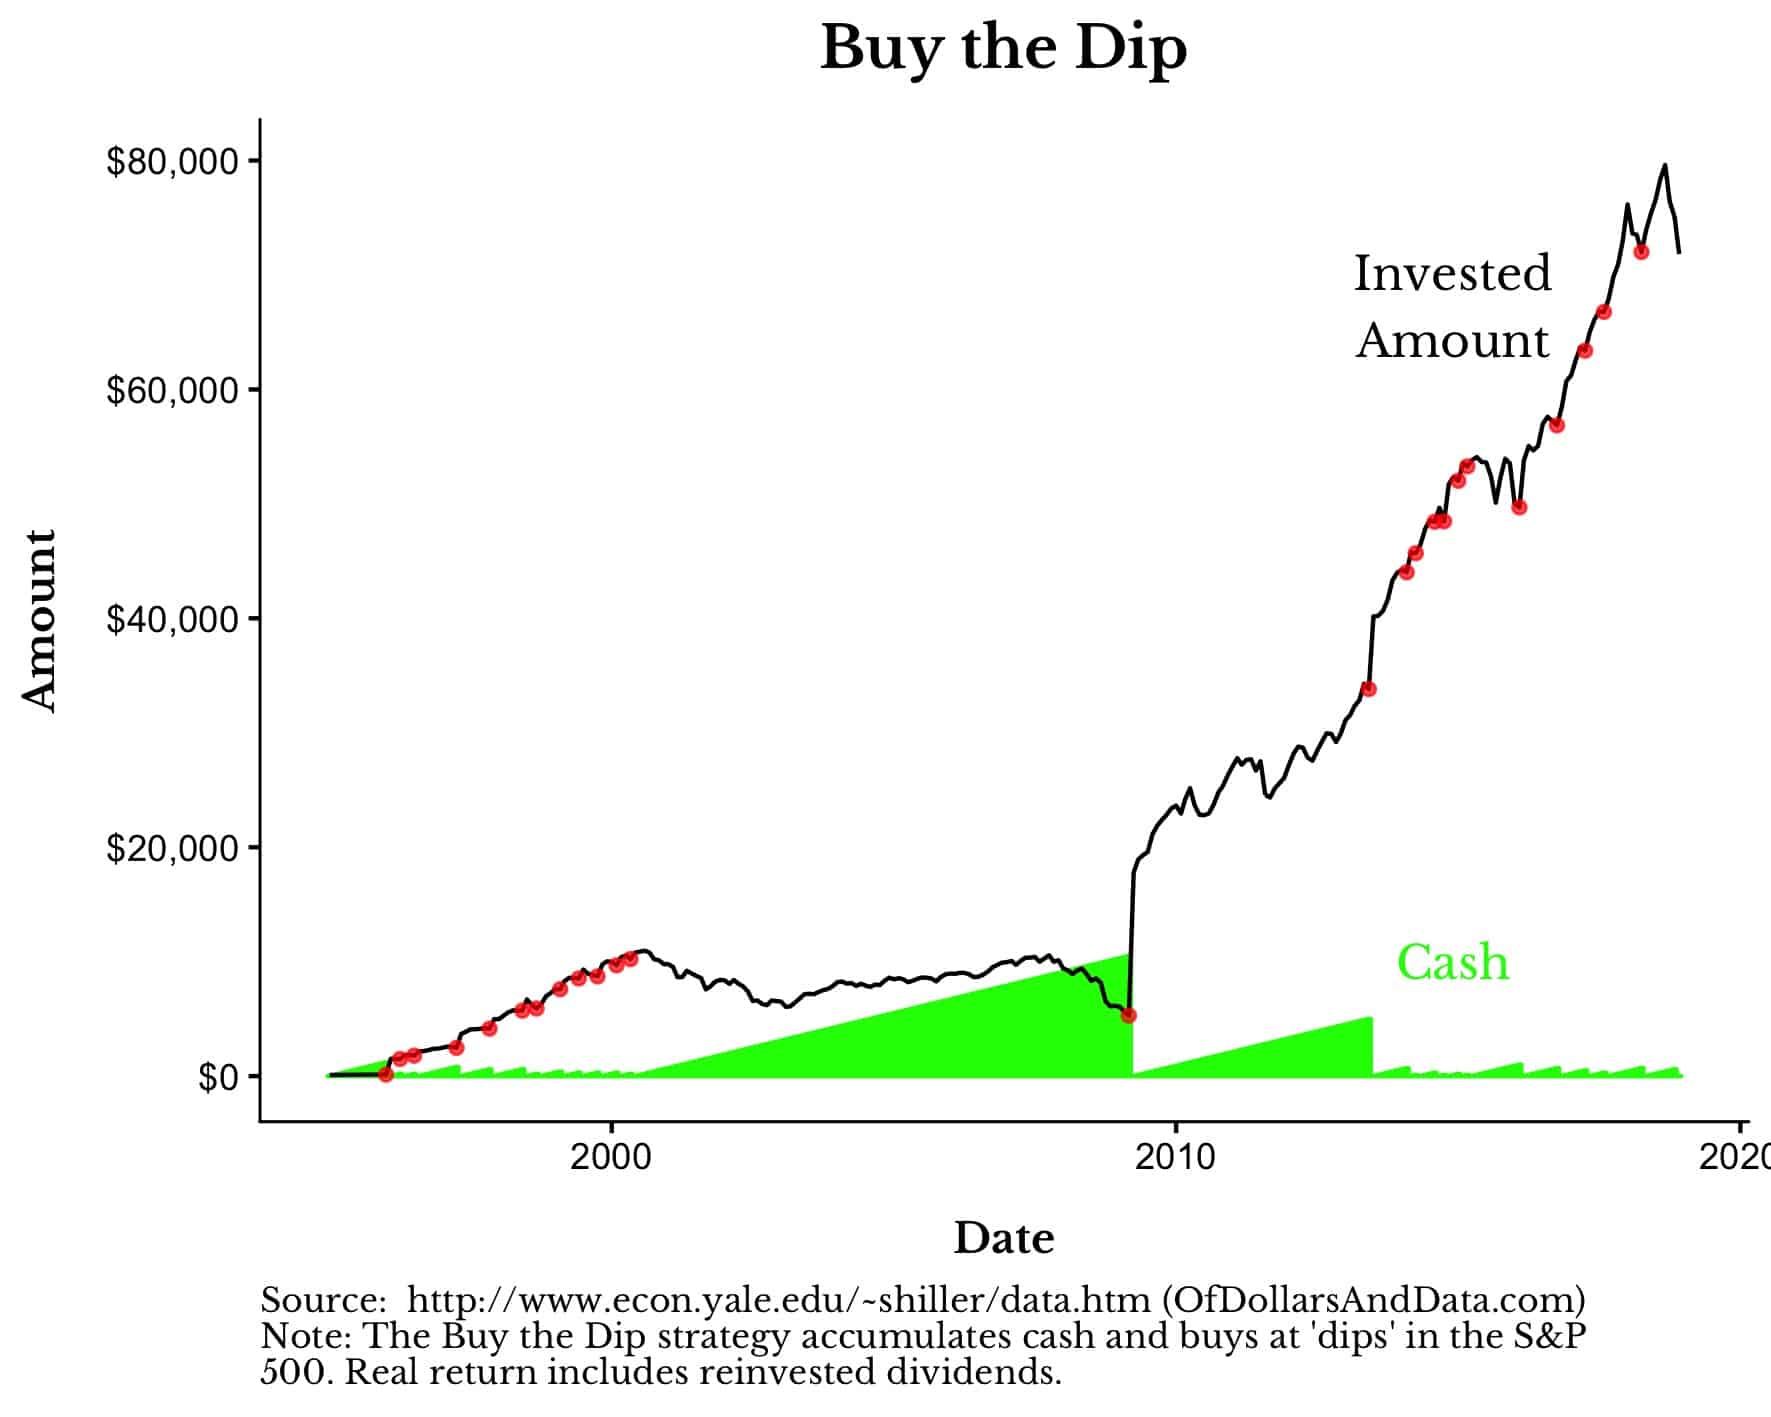
Every time the strategy buys into the market (the red dots), the cash balance goes to zero and the invested amount moves upward accordingly. This is most obvious when we look at March 2009 when, after nearly 9 years of cash savings, $10,600 is put into the market.
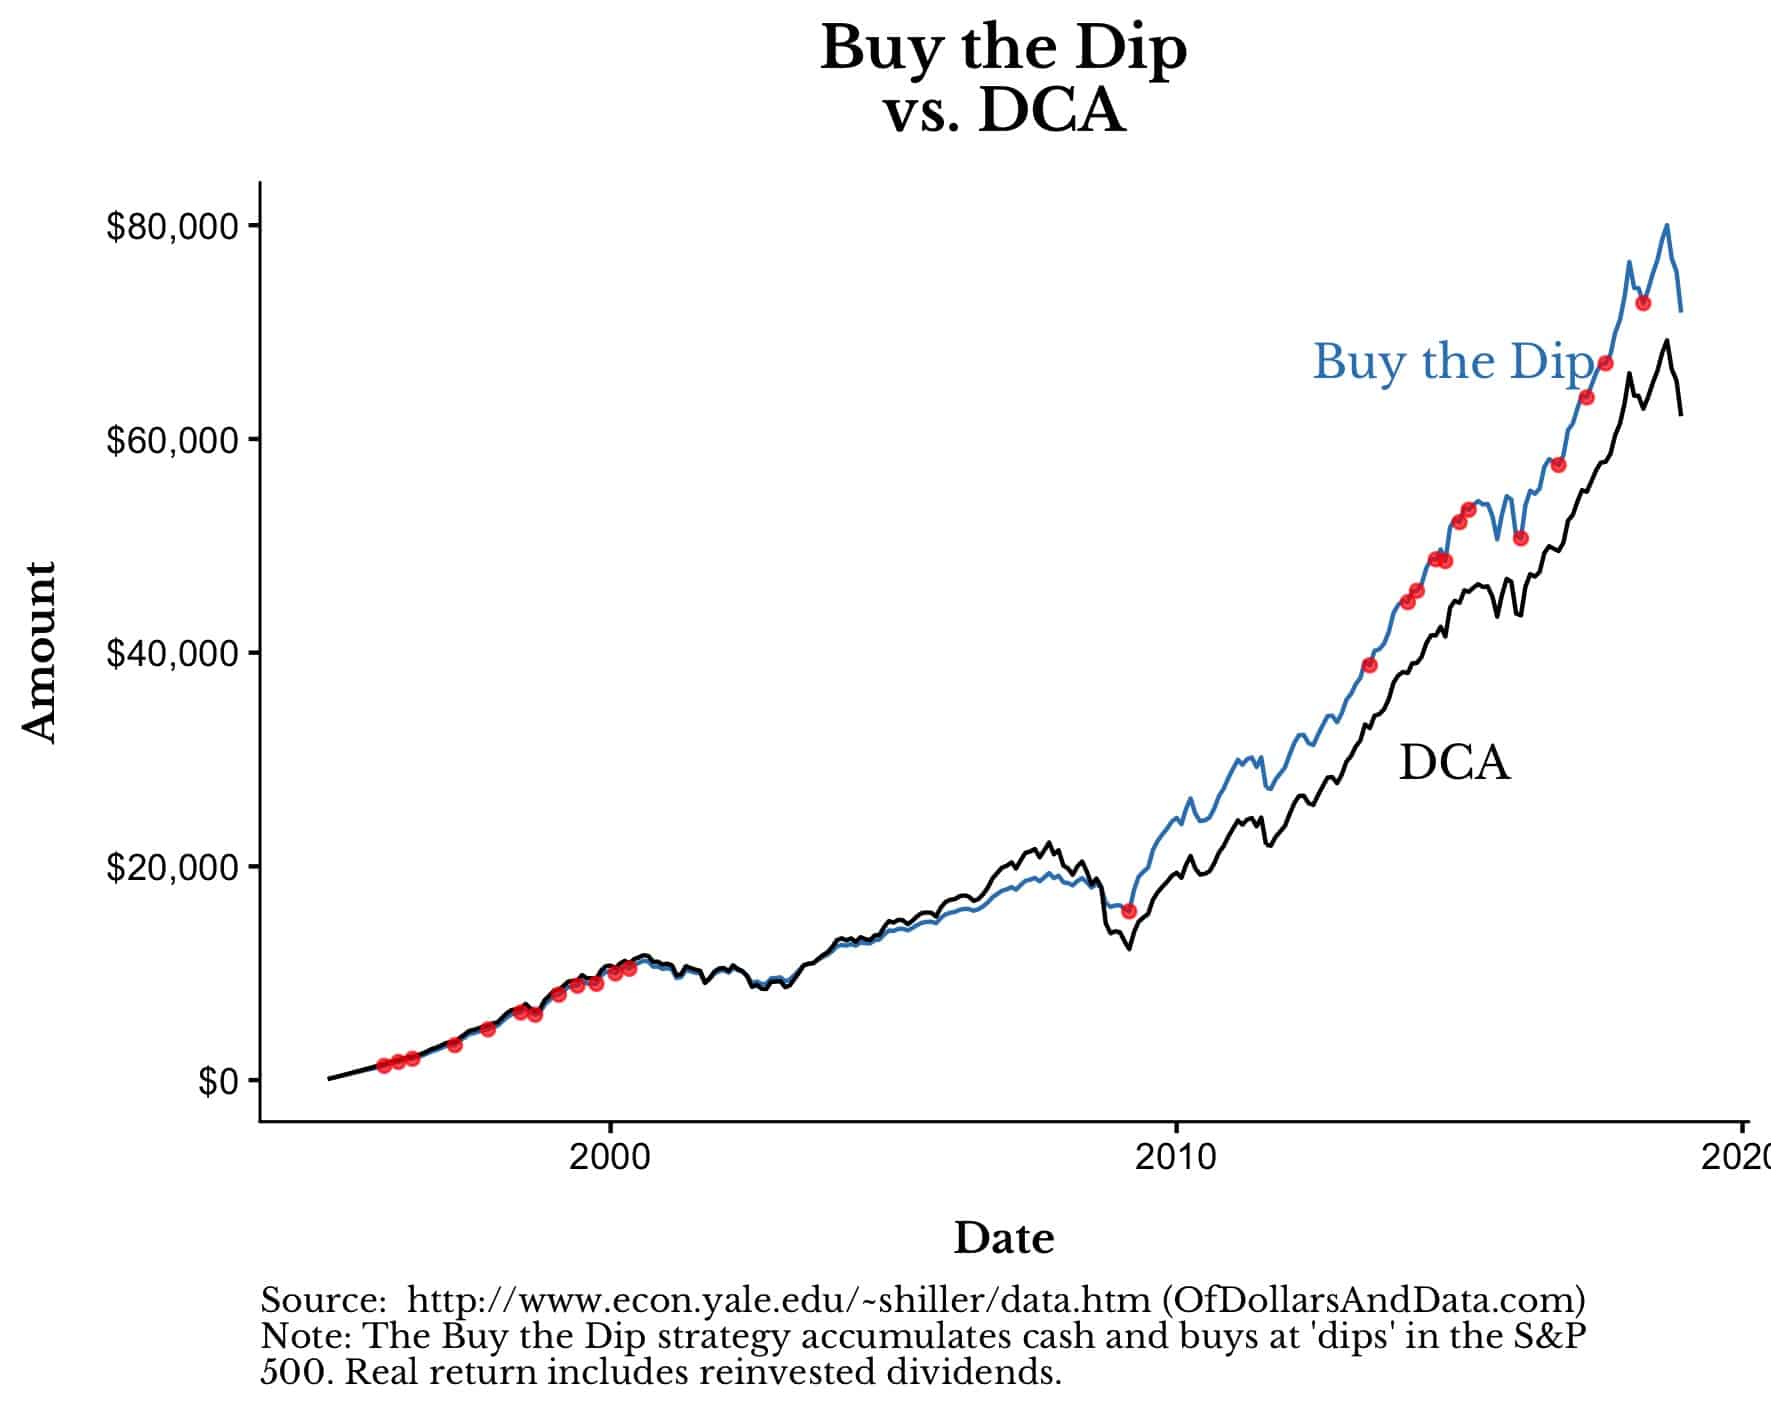
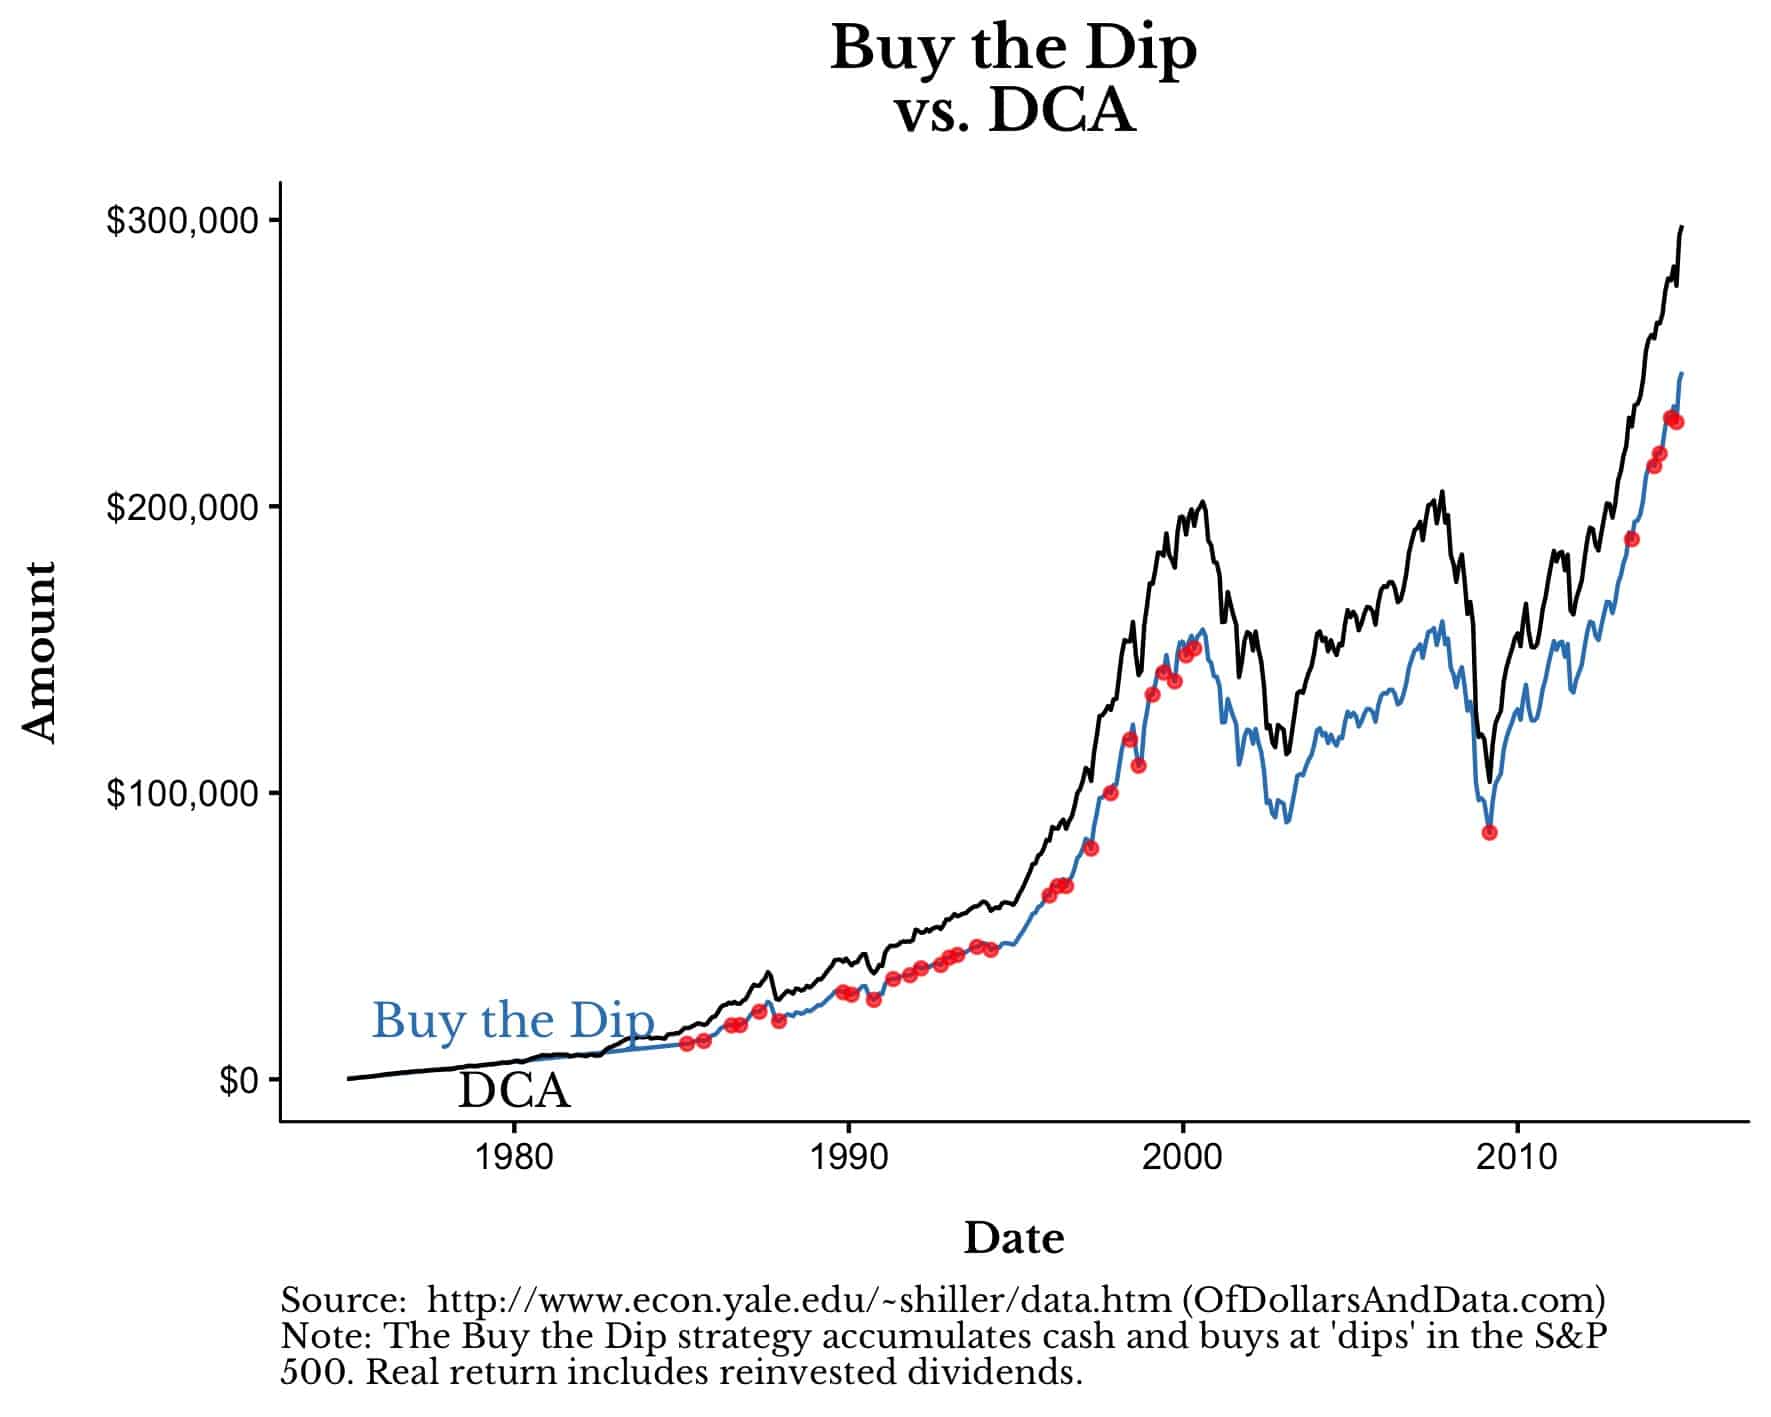
If we compare the portfolio value of Buy the Dip and DCA, you will see that the Buy the Dip strategy starts outperforming around the March 2009 purchase:
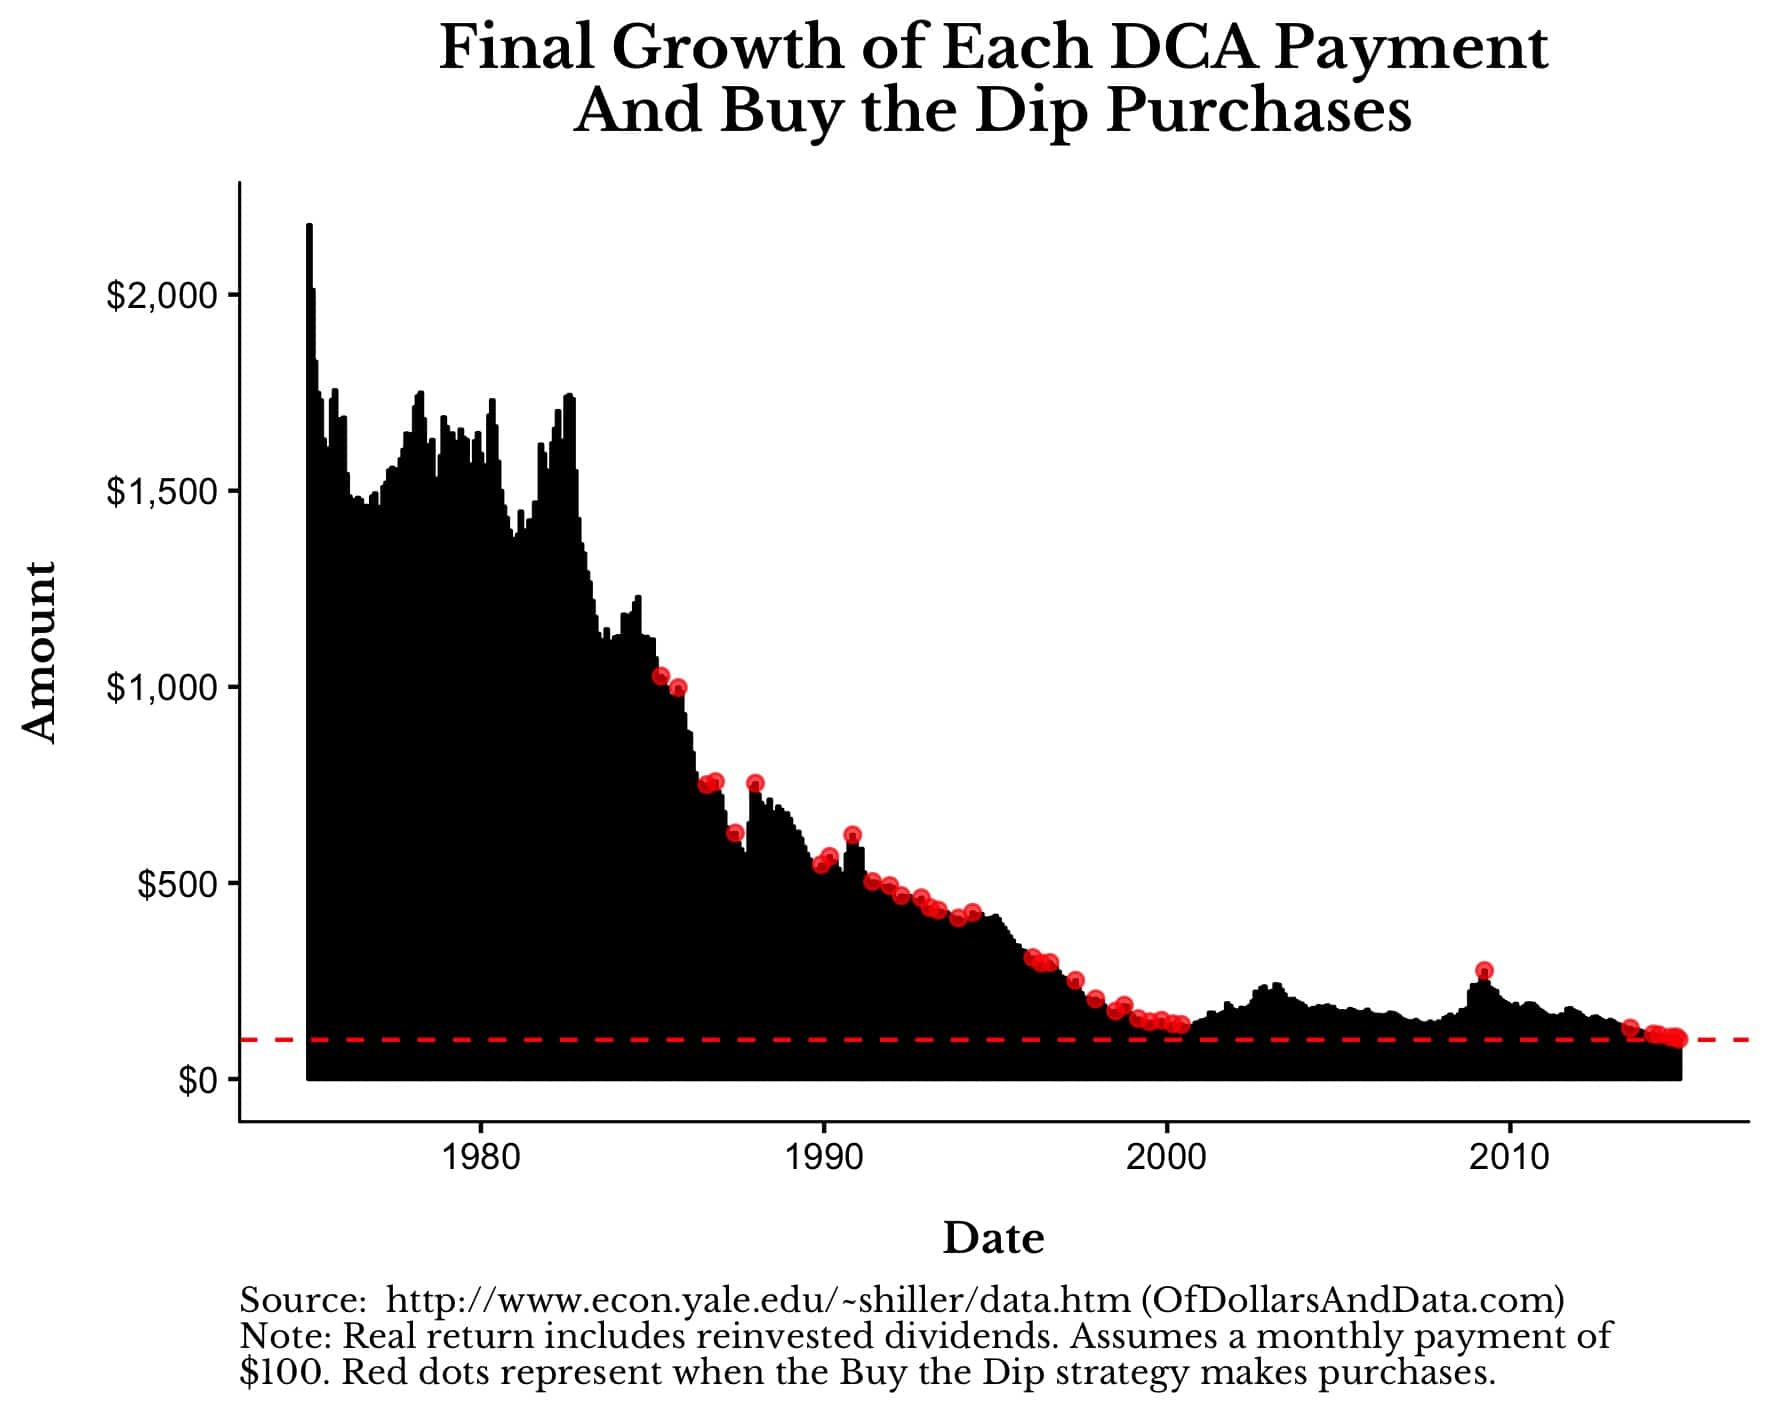
If you want to understand why this one purchase is so important, let’s consider how much each individual purchase for the DCA strategy grows to by the end of the time period. Each black bar in the chart below represents how much a $100 purchase grew to by December 2018.
For example, the $100 purchase in January 1995 grew to over $500. The red dots (once again) represent when the Buy the Dip strategy makes purchases:

This chart illustrates the power of buying the dip as every $100 invested in March 2009 (that single red dot towering near 2010) would grow to ~$350 by December 2018. This one purchase (and its growth) accounts for 52% of the final portfolio value for the Buy the Dip strategy in December 2018. In addition, there are two things to notice about this plot:
- The earlier payments, on average, grow to more (Yay for compounding!!)
- There are a handful of big dips (i.e. February 2003, March 2009) where some payments grow to a lot more than others.
If we put these two points together, this means that Buy the Dip will outperform DCA when big dips happen earlier in the time period. The best example of this is the period 1928-1957, which contains the largest dip in U.S. stock market history (June 1932):

Buy the Dip works incredibly well over this period because it buys the biggest dip ever (June 1932) early on. Every $100 you invested at the bottom in June 1932 would have grown to $4,000 in real terms! There is no other time period in U.S. market history that even comes close to this.
I know it might sound like I am trying to sell the Buy the Dip strategy, but the 1995-2018 and the 1928-1957 periods just happen to be two where there were prolonged, severe bear markets.
If we look over longer time frames, historically, Buy the Dip doesn’t outperform most of the time. The chart below shows the amount of outperformance from Buy the Dip (as compared to DCA) over every 40-year period over time. Outperformance is defined as the final Buy the Dip portfolio value divided by the final DCA portfolio value.
When Buy the Dip ends with more money than DCA it is above the 0% line, and when it ends with less money than DCA it is below the 0% line. To be precise, over 70% of the time, Buy the Dip underperforms DCA (i.e. it is below the 0% line):

What you will notice is that Buy the Dip does well starting in the 1920s (due to the severe 1930s bear market) with an ending value up to 20% higher than DCA. However, it stops doing as well after the 1930s bear market and does continually worse. Its worst year of performance (relative to DCA) occurs immediately after the 1974 bear market (starting in 1975).
This 1975-2014 period is particularly bad for Buy the Dip because it misses the bottom that occurred in 1974. Starting in 1975, the next all-time high in the market doesn’t occur until 1985, meaning there is no dip to buy until after 1985. Due to this unfortunate timing for Buy the Dip, DCA is easily able to outperform:
You can see this more clearly if we look at the purchase growth plot for this period:
As you can see, unlike the 1928-1957 or 1995-2018 plots, Buy the Dip does not get to buy large dips early. It does get to buy the March 2009 dip, but it happens so late in the simulation that it doesn’t provide enough benefit to outperform.
My point in all of this is that Buy the Dip, even with perfect information, typically underperforms DCA. So if you attempt to build up cash and buy at the next bottom, you will likely be worse off than if you had bought every month. Why? Because while you wait for the next dip, the market is likely to keep rising and leave you behind.
What makes the Buy the Dip strategy even more problematic is that we have always assumed that you would know when you were at every bottom (you won’t). I ran a variation of Buy the Dip where the strategy misses the bottom by 2 months, and guess what?
Missing the bottom by just 2 months leads to underperforming DCA 97% of the time! So, even if you are somewhat decent at calling bottoms, you would still lose in the long run.
I wrote this post because sometimes I hear about friends who save up cash to “buy the dip” when they would be far better off if they just kept buying. My friends do not realize that their beloved dip may never come. And while they wait, they can miss out on months (or more) of continued compound growth.
Because if God can’t beat dollar cost averaging, what chance do you have?
God Still Has the Last Laugh
One of the most important things I re-learned from crunching all the numbers for this post is how dependent we are on timing luck (formally known as sequence of return risk). This is something that is completely out of our control.
For example, the best 40-year period between 1920 and 1979 was from 1922-1961, where your $48,000 (40 years * 12 months * $100) in total purchases grew to over $500,000. Compare this to the worst period 1942-1981, where your $48,000 in total purchases only grew to $153,000. That is a difference of 226%, which is much larger than any divergences we saw between the DCA and Buy the Dip timing strategies!
Your strategy is less important than what the market does. God still has the last laugh.
If you made it this far, congratulations on finishing this monster post. I hope it makes you re-consider having “cash on the sidelines” ever again. Lastly, special thanks to this Alpha Architect article for inspiring the post title and thank you for reading.
If you liked this post, consider signing up for my newsletter.
This is post 110. Any code I have related to this post can be found here with the same numbering: https://github.com/nmaggiulli/of-dollars-and-data

