I’ve never written a post on portfolio rebalancing before because I thought it was a closed issue. Based on everything I had read previously, it didn’t seem to matter whether you rebalanced your portfolio monthly, quarterly, or yearly. As William Bernstein concluded in his analysis on this topic, “No one rebalancing period dominates.” Similar results have been found elsewhere.
Corey Hoffstein came out with a post recently that highlighted that when you rebalance can affect your performance by 1%-4% annually for the same set of underlying securities. His research seems to bolster the other evidence that inter-asset rebalancing (across asset classes) is heavily determined by luck.
But, what about intra-asset rebalancing (within an asset class)? Many of us own index funds that rebalance for us automatically, likely on a quarterly basis. But could rebalancing more or less frequently within an asset class improve performance? Enter Breaking the Market (BTM).
In his post Why Market Indexing Works, BTM explains that market indexing works because an index fund rebalances out of failing stocks and into winning stocks over time. This change in the underlying components of the index is what gives it its long-term positive return. But, what makes this post intriguing is that BTM argues that you can beat the index if you just rebalance more frequently than it does.
Logically, this assertion makes sense. Given that only 4% of stocks account for the entire gain in the U.S. stock market above Treasury bills, rebalancing more frequently would mean holding onto long-term losers for less time and switching into the winners more quickly. BTM demonstrated that this worked with stocks in the Dow, but I wanted to test it for myself using the S&P 500.
Using data from YCharts, I got returns data for 605 companies that were in the S&P 500 at one point between 2005 and 2019. [Note: Over this time period, there were 867 individual stocks that were in the S&P 500 at one point in time, but, due to delistings, mergers, and acquisitions, I was only able to get data on 605 of these. I will address the survivorship issue this creates later in this post.]
With this data I created 1,000 simulations of random equal-weight portfolios of various sizes (from as little as 5 stocks to as many as 250 stocks) and compared their performance based on how often they were rebalanced. Using rebalancing frequencies ranging from once a week to once a year, the results fit the theory:
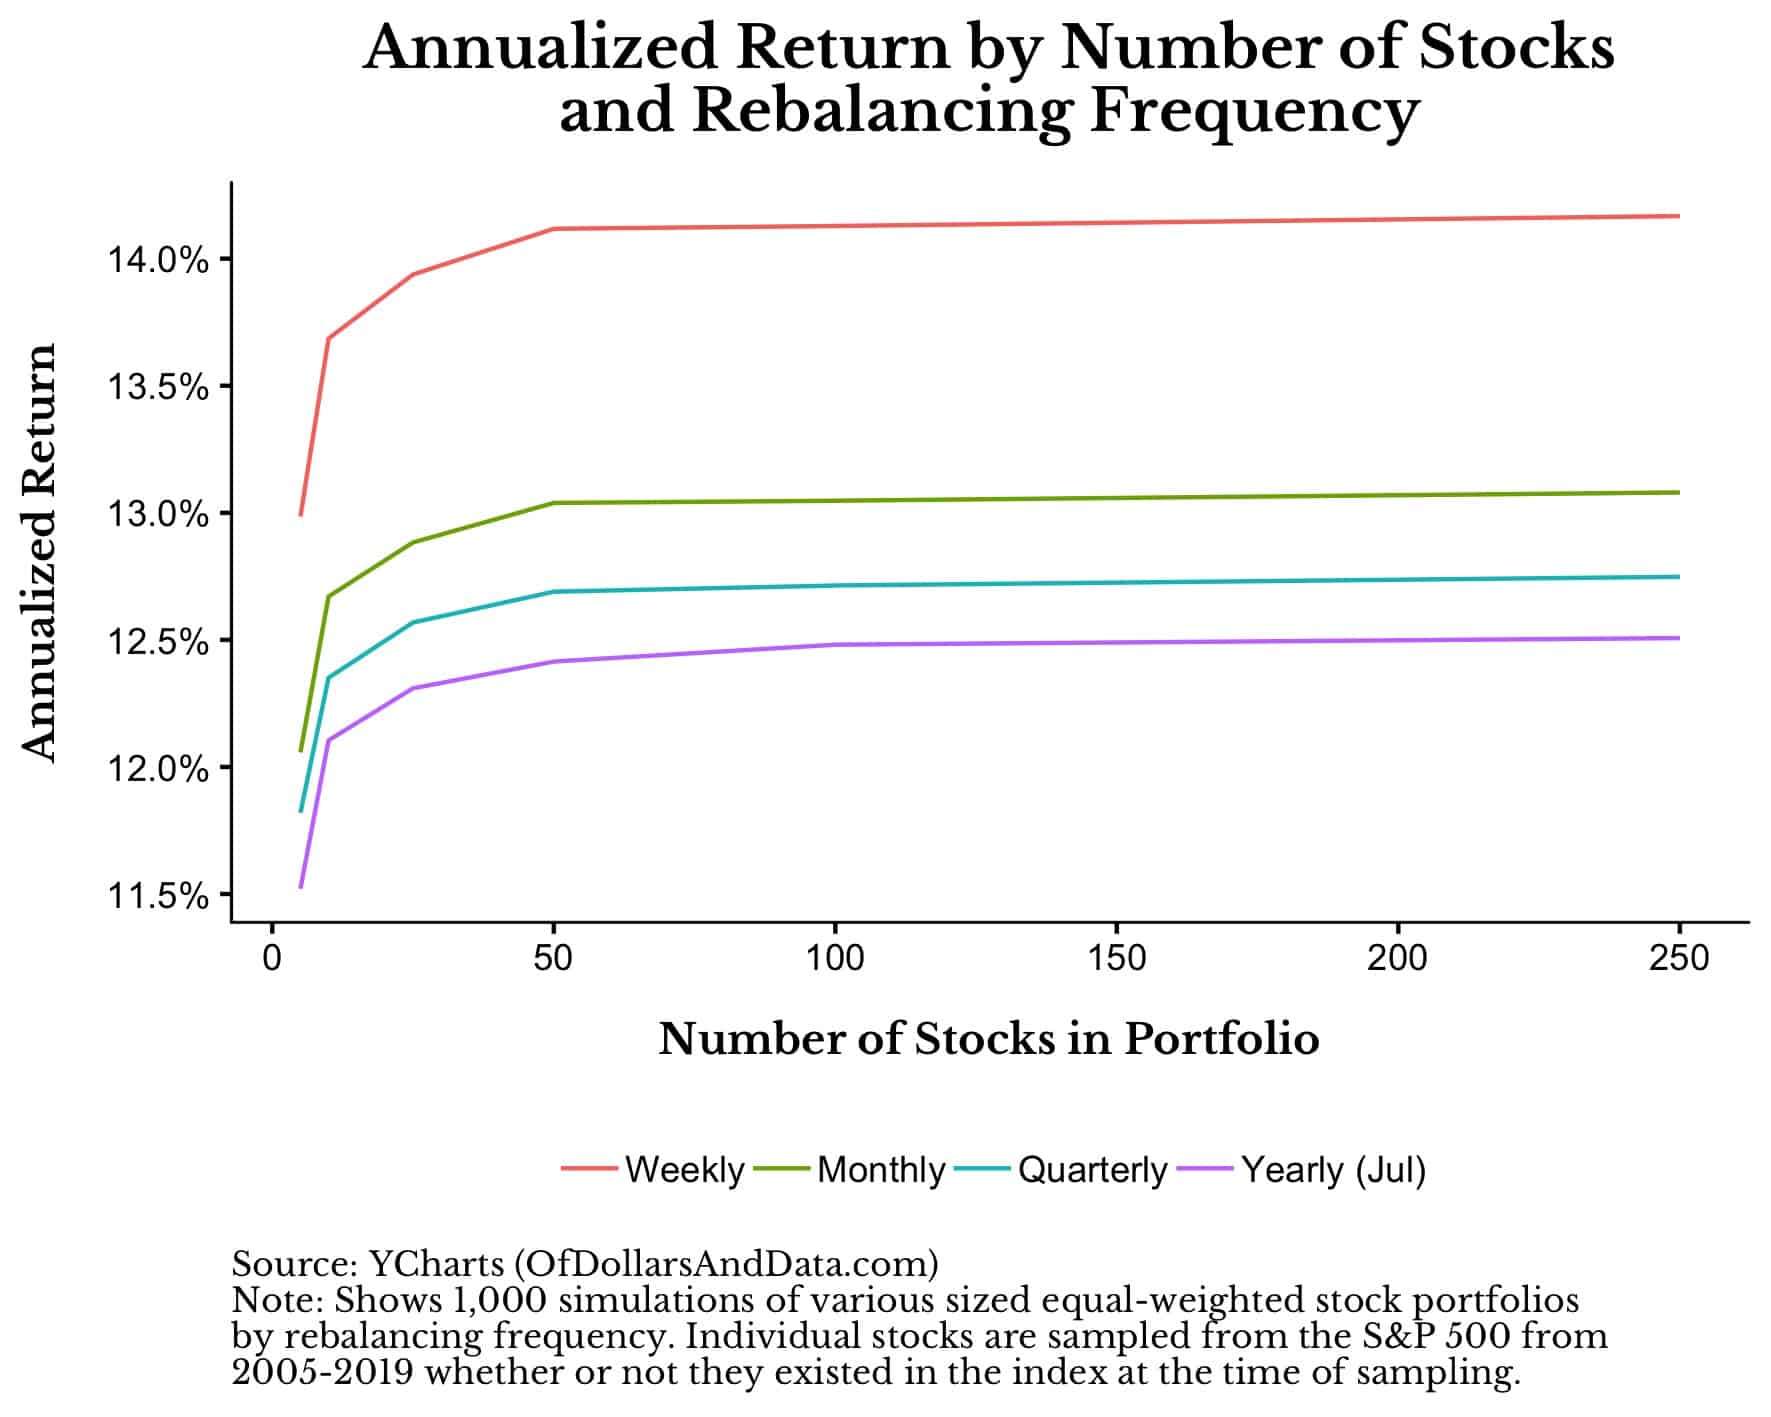
As you can see, the more frequently one rebalances, the higher the annualized total return will be (on average) for a random set of S&P 500 stocks. Additionally, there was no added performance benefit to having more than 50 stocks in a portfolio, which matches what I have read previously.
After seeing this result I was quite pleased. I had replicated BTM’s work and was ready to write this post. But…I started to wonder. What if this was some sort of fluke? In the above simulations I rebalanced the annual portfolio at the end of July. Would rebalancing that annual portfolio in a different month make a difference? Would Corey Hoffstein’s dumb timing luck rear its head after all?
I re-ran the 1,000 simulations above, but this time with the annual rebalancing date at the end of January:
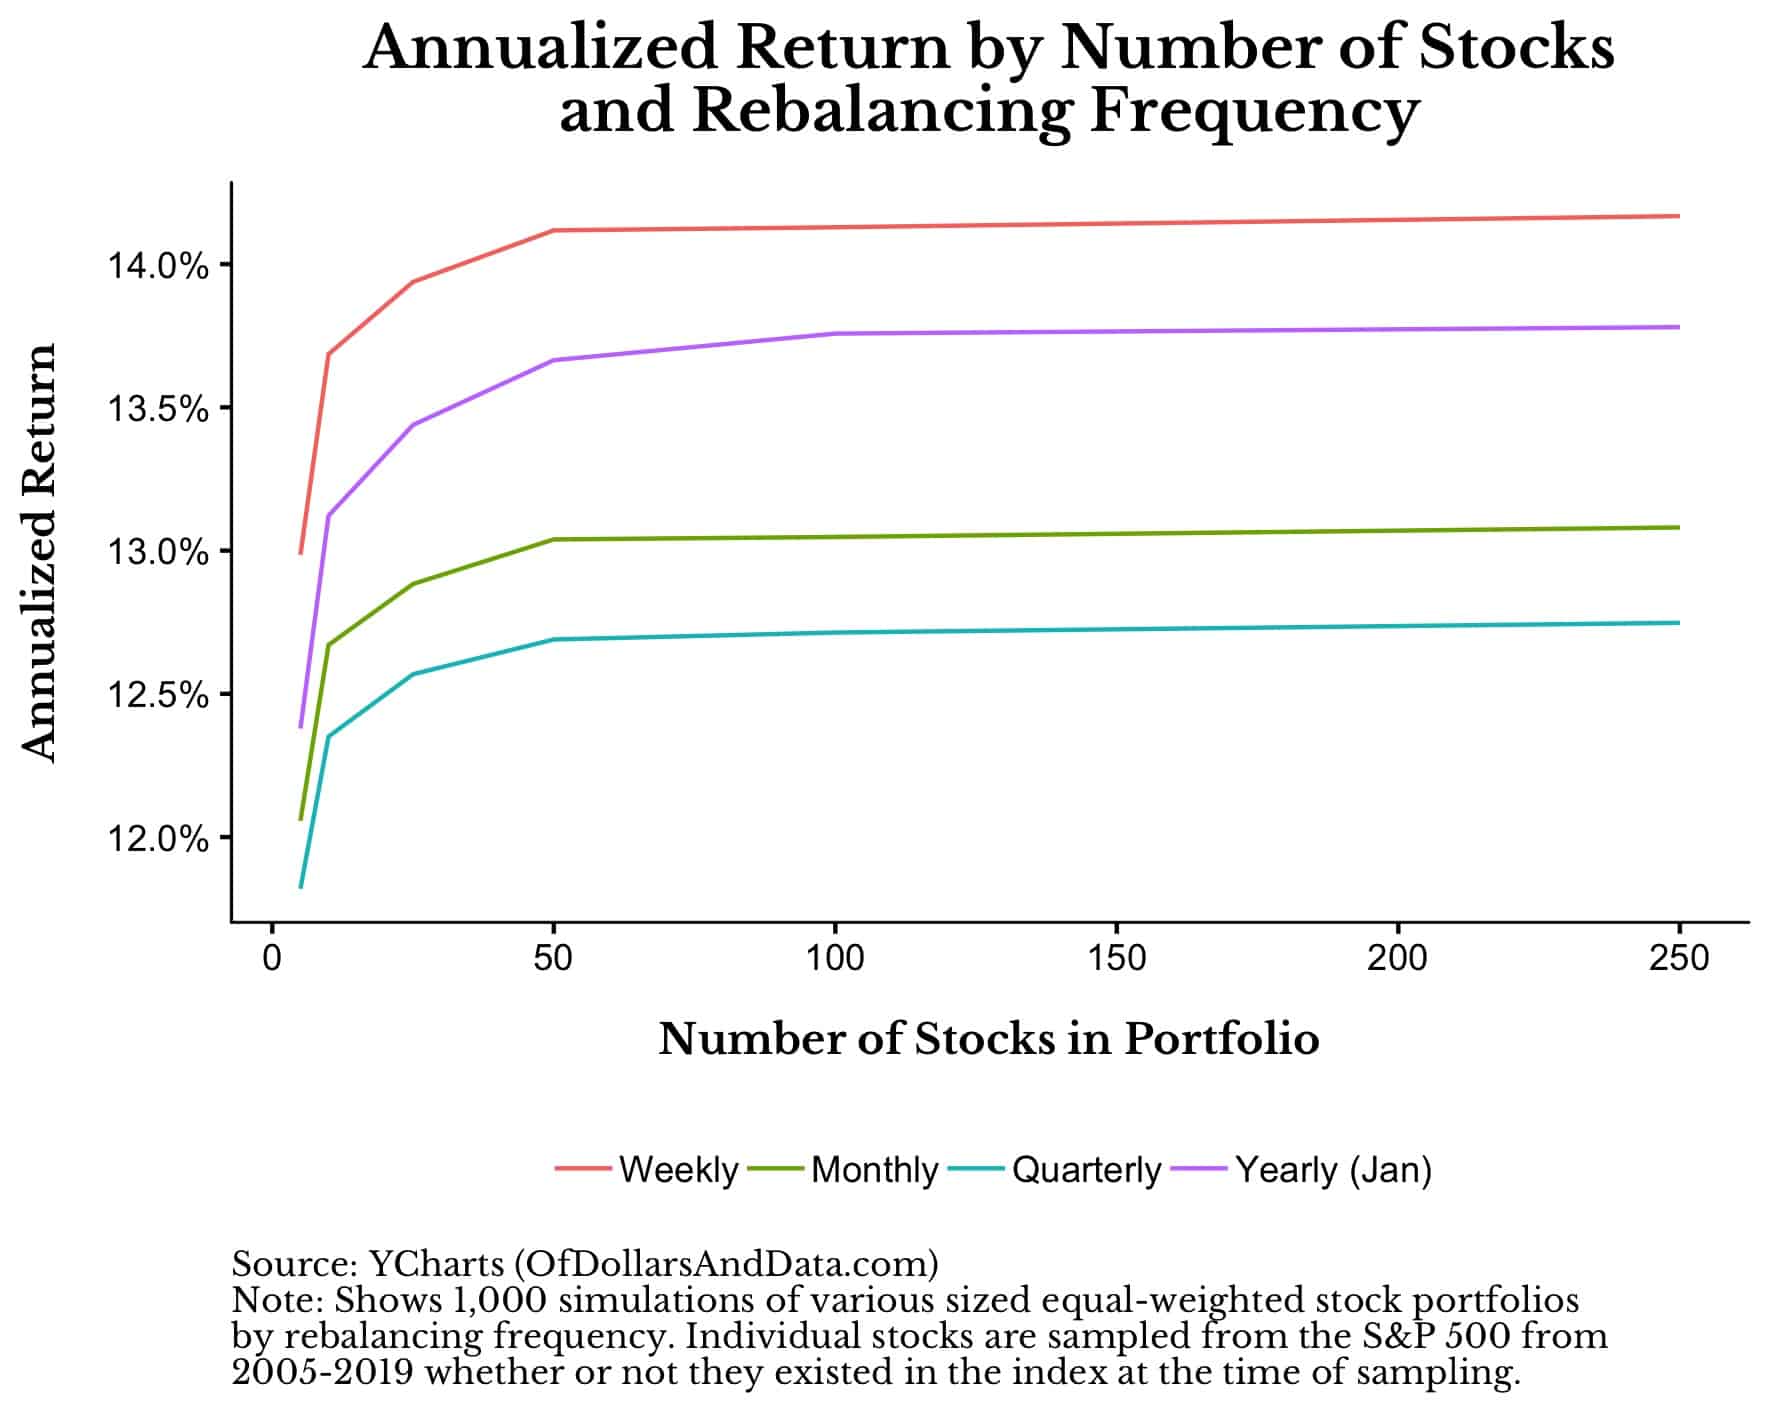
As you can see, Mr. Hoffstein had the last laugh. Now, yearly rebalancing beats monthly and quarterly rebalancing and the theory about intra-asset rebalancing frequency is no longer on such solid ground. I also did this analysis in other months (i.e. end of March, end of October) and confirmed that the January rebalance wasn’t just a fluke.
I asked BTM about this and he said the amount of data I used (2005-2019 ) only experiences 15 annual rebalances which may not be enough to show the effect, but I’m not entirely sure this explains it. My prior with most market-based analyses is that the patterns we observe are just noise and randomness. Given the conclusions found from those who have studied rebalancing previously, I am inclined to believe that this is true in this case as well. Maybe there is some benefit to rebalancing more frequently within an index, but I am not 100% convinced yet.
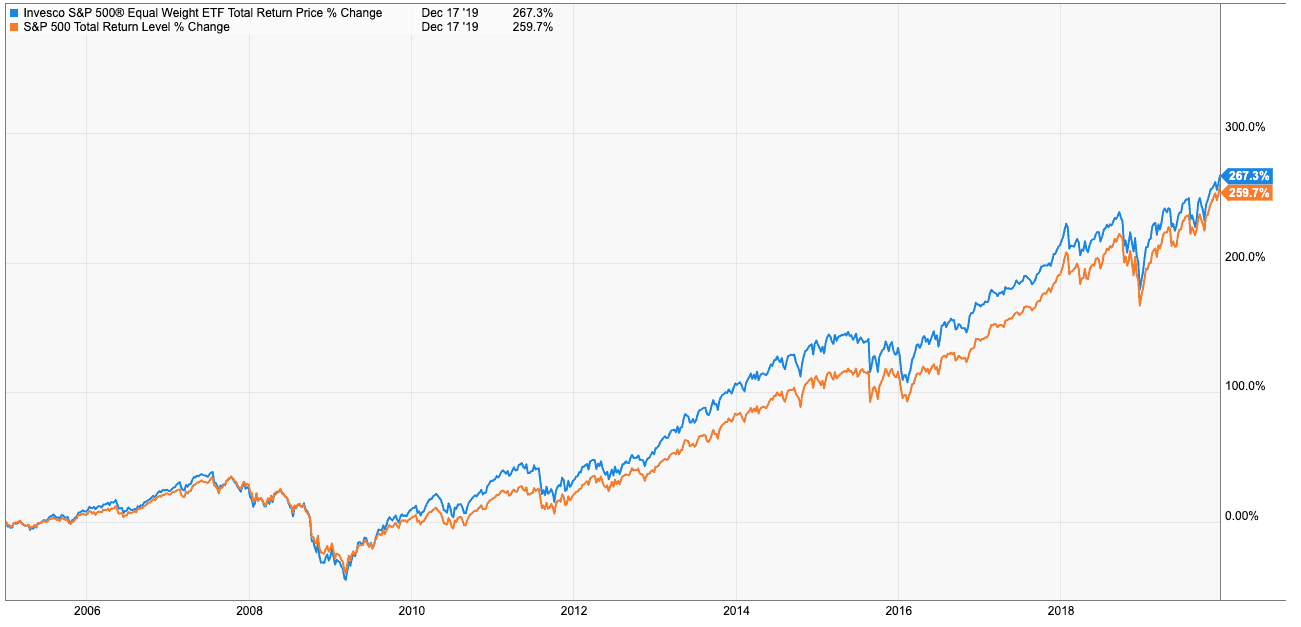
Lastly, the annualized total returns you see in the plots above are far higher than what an actual equal-weighted S&P 500 portfolio would have done over the 2005-2019 time period because of survivorship bias. Since I am only plotting the returns of those tickers that haven’t been delisted, this increases the returns above what we would see for the actual index. I did a quick calculation and found that an equal-weighted S&P 500 portfolio would have returned 9.06% annually (with dividends) from 2005-2019, compared to 8.90% annually (with dividends) for the market-cap weighted index:
If anything this illustrates how important it can be to avoid the losing stocks. If you could avoid just those stocks that you knew would be delisted in the near term, you would be able to improve your returns by a few percentage points a year. Too bad no such crystal ball easily exists…
Challenging Your Beliefs
A big part of why I write online is to challenge my beliefs. Many times I find that some of my original assertions are false after more intense scrutiny. I almost made that mistake in this very post before discovering the error in my ways.
But that’s what this process is all about. Research is the act of challenging what you know in hopes of finding something new. Sometimes we find something incredible and sometimes we don’t. Unfortunately, this post was more of the latter.
However, the real lesson here isn’t about rebalancing frequency, but to never stop questioning what you’ve been told. I appreciate people like Breaking the Market for continuing to challenge common wisdom and for providing the inspiration for this post. Check out his blog for even more great work.
Thank you for reading!
If you liked this post, consider signing up for my newsletter.
This is post 157. Any code I have related to this post can be found here with the same numbering: https://github.com/nmaggiulli/of-dollars-and-data

