Last week, someone called into the Dave Ramsey show confused about how large of a withdrawal rate they could have in retirement. The caller stated that they had read that 4%-5% was the safe withdrawal rate, but then mentioned how George Kamel (another pundit in the Dave Ramsey network) suggested that the safe withdrawal rate was actually closer to 3%.
Upon hearing this, Dave went off on his colleague George stating that a 3% withdrawal rate was “absolutely wrong” and “ridiculous”:
From the Ramsey Show (November 2, 2023):
This disturbing video rant from Dave Ramsey demonstrates an ongoing ignorance of safe withdrawal rates and sequence of returns risk, plus a combative insistence on using 12% average linear returns assumptions over decades.Dave publicly… pic.twitter.com/Mh88TIoKVQ
— Marvin Bontrager, Ph.D. (@mbontrager5) November 9, 2023
Ramsey continued his rant by suggesting that even a 4%-5% withdrawal rate was too low:
I mean if you’re making 12 in good mutual funds and the S&P has averaged 11.8, and, if inflation for the last 80 years has averaged 4%. If you make 12 and you need to leave 4% in there for inflation raises, that leaves you 8. I’m perfectly comfortable drawing 8.
At first glance, his logic makes sense. If you are making 12% and you allow 4% for inflation, it does, in fact, leave you 8% over to spend as you please. Unfortunately, Dave’s strategy relies on three pretty large assumptions:
- High Risk Asset Allocation: You have to have 100% of your portfolio in growth stock mutual funds such AIVSX (one of the funds Dave has relied on for a long time).
- Fund Outperformance: Not only do you have to have a 100% stock allocation, but you have to own a fund that outperforms the overall stock market as well. In the case of AIVSX, this fund has outperformed the S&P 500 by nearly 1% per year going back to 1935.
- Low Volatility in Returns: You have to assume that you will get a 12% return (or close to it) almost every year.
Unfortunately, all of these assumptions are very extreme.
First, assuming a retiree can handle a 100% stock portfolio is quite presumptuous. While a portfolio of 100% U.S. stocks would’ve allow for higher withdrawal rates historically, this portfolio would’ve also incurred far more volatility along the way. Watching your life savings drop by 5% (and possibly up to 20%) in a single day is not something that the typical retiree can brush off.
Second, assuming you can find a fund that can beat the S&P 500 while returning 12% per year is also quite extreme. From January 1935 to December 2022, the S&P 500 had a total return of about 10.94% per year (see calculator here) while AIVSX returned about 11.7% per year, or nearly 1% more over an 88 year period! If you think this performance is common (or likely) in the future, think again.
Lastly, while AIVSX averaged nearly 12% compounded growth going back to 1935, it rarely achieved this “average” return. In fact, more than 93% of the time it had a return that was either below 10% or above 14%. It was only in its “average” range (of 10%-14%) about one in every 14 years. So while making 12% and leaving 4% for inflation works in theory, in practice you would overshoot or undershoot this target in most years.
But, that’s enough theory for now. Let’s examine how well an 8% withdrawal rate would’ve actually performed throughout history using Dave’s growth stock mutual fund of choice.
Testing the 8% Withdrawal Rate
For someone looking to retire for 30 years with a 100% growth stock mutual fund portfolio (“AIVSX”) and an 8% withdrawal rate, the probability that they will run out of money before the end of their retirement is 42%. I determined this by running a retirement simulation for every 30-year period from 1935-2022. You can see how many years of money you would have (i.e. “years survived”) for every 30-year retirement period starting in 1935 in the chart below:
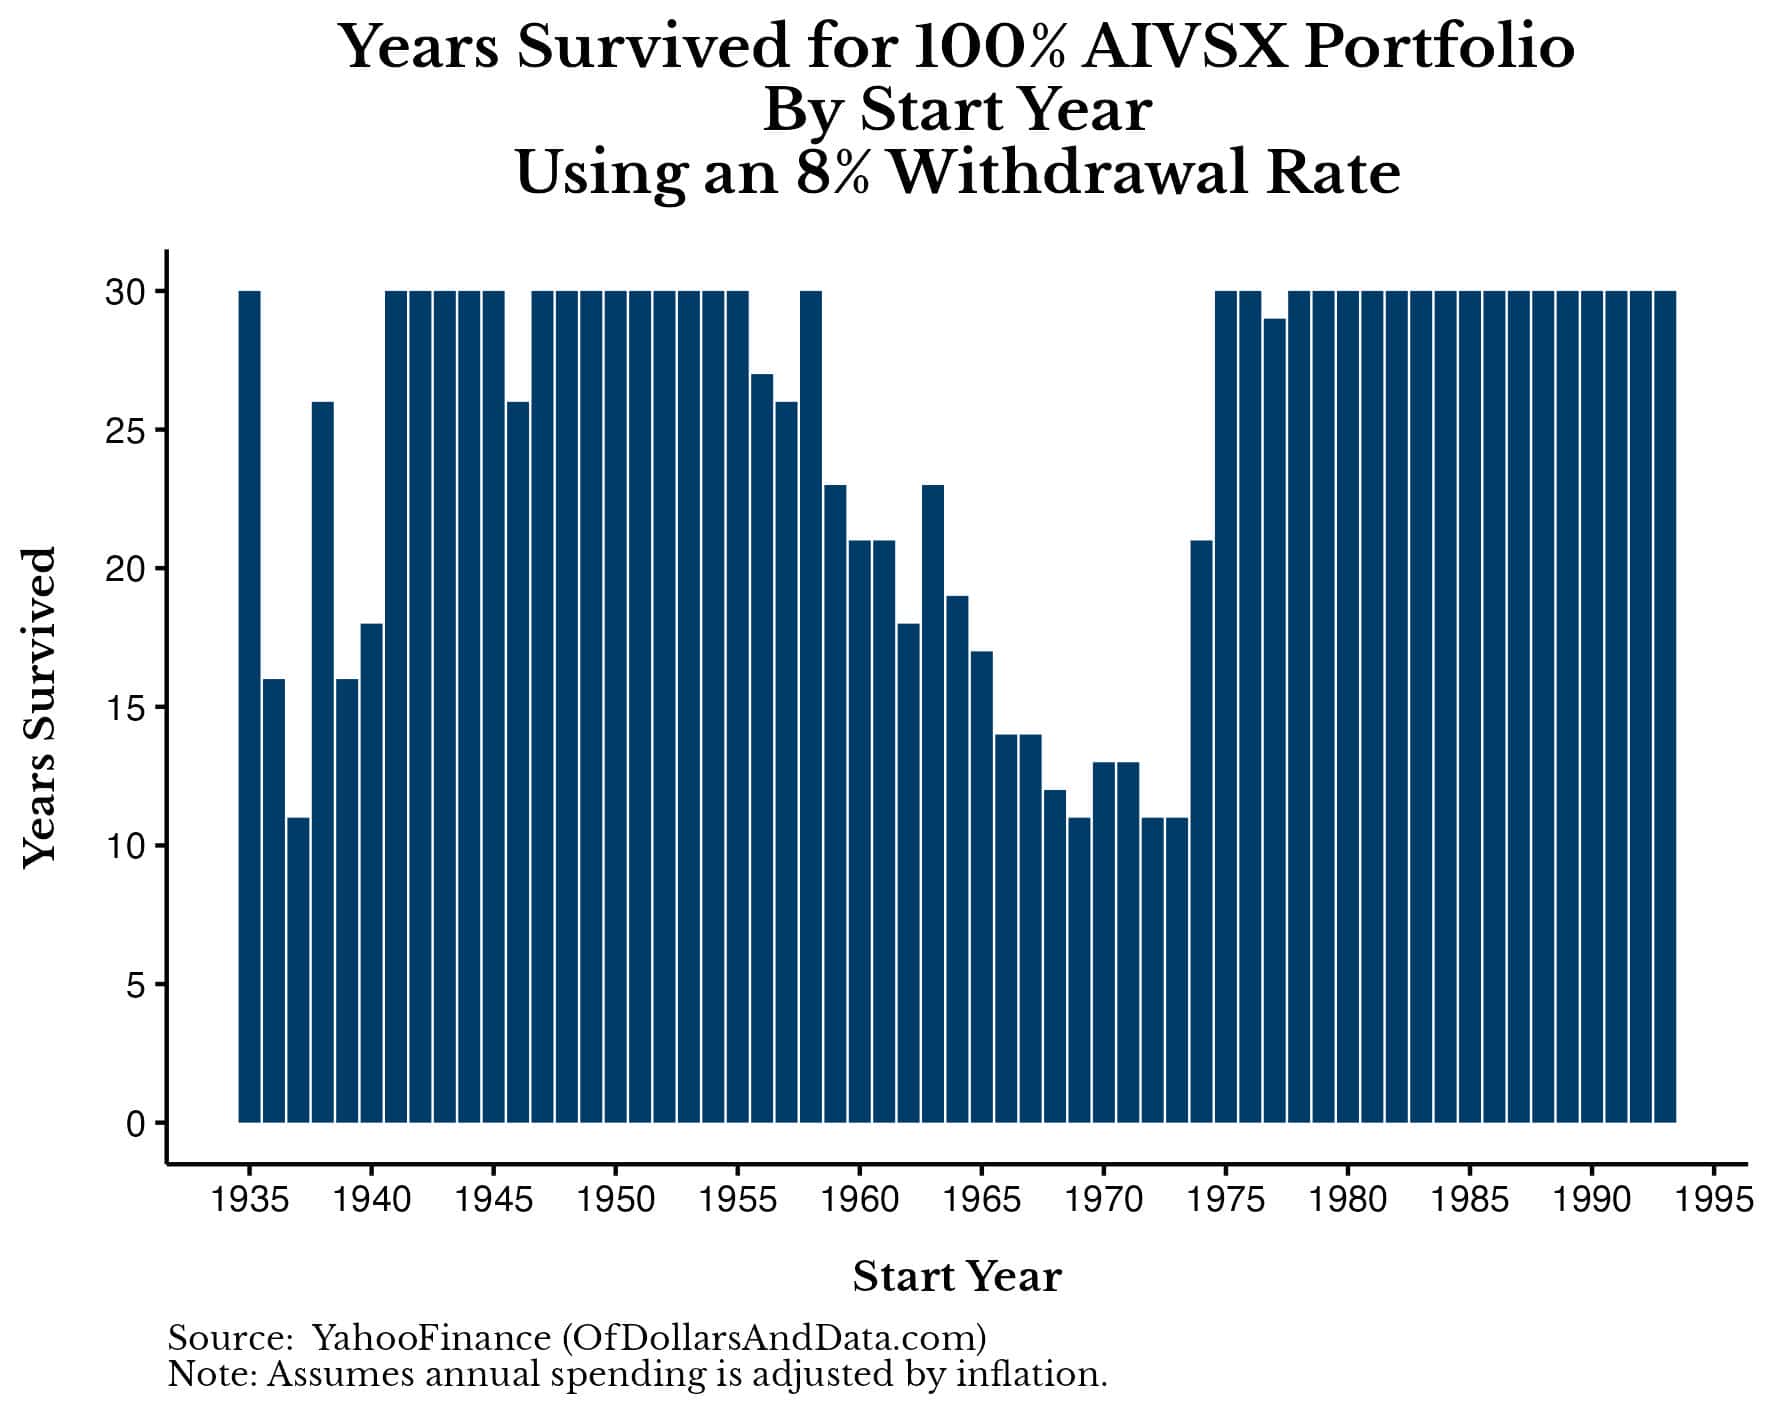
As you can see, in 58% of these historical simulations, your portfolio makes it the full 30 years, but in the other 42% it runs out of money early. In particular, if you get quite unlucky, your money would only last a little more than 10 years using an 8% withdrawal rate.
Why does this happen? Because of the sequence of returns you get in your retirement. And it’s not the full 30-year sequence that matters, but the sequence of the first decade in particular that seems to be most important.
To illustrate this let’s first plot the 30-year forward compound annual growth rate (“CAGR”) of AIVSX going back to 1935. If we were to do so, we would see that this fund has returned somewhere between 6% and 10% per year after inflation through history (note that I added a dashed horizontal line at 8% to denote the 8% withdrawal rate suggested by Ramsey):
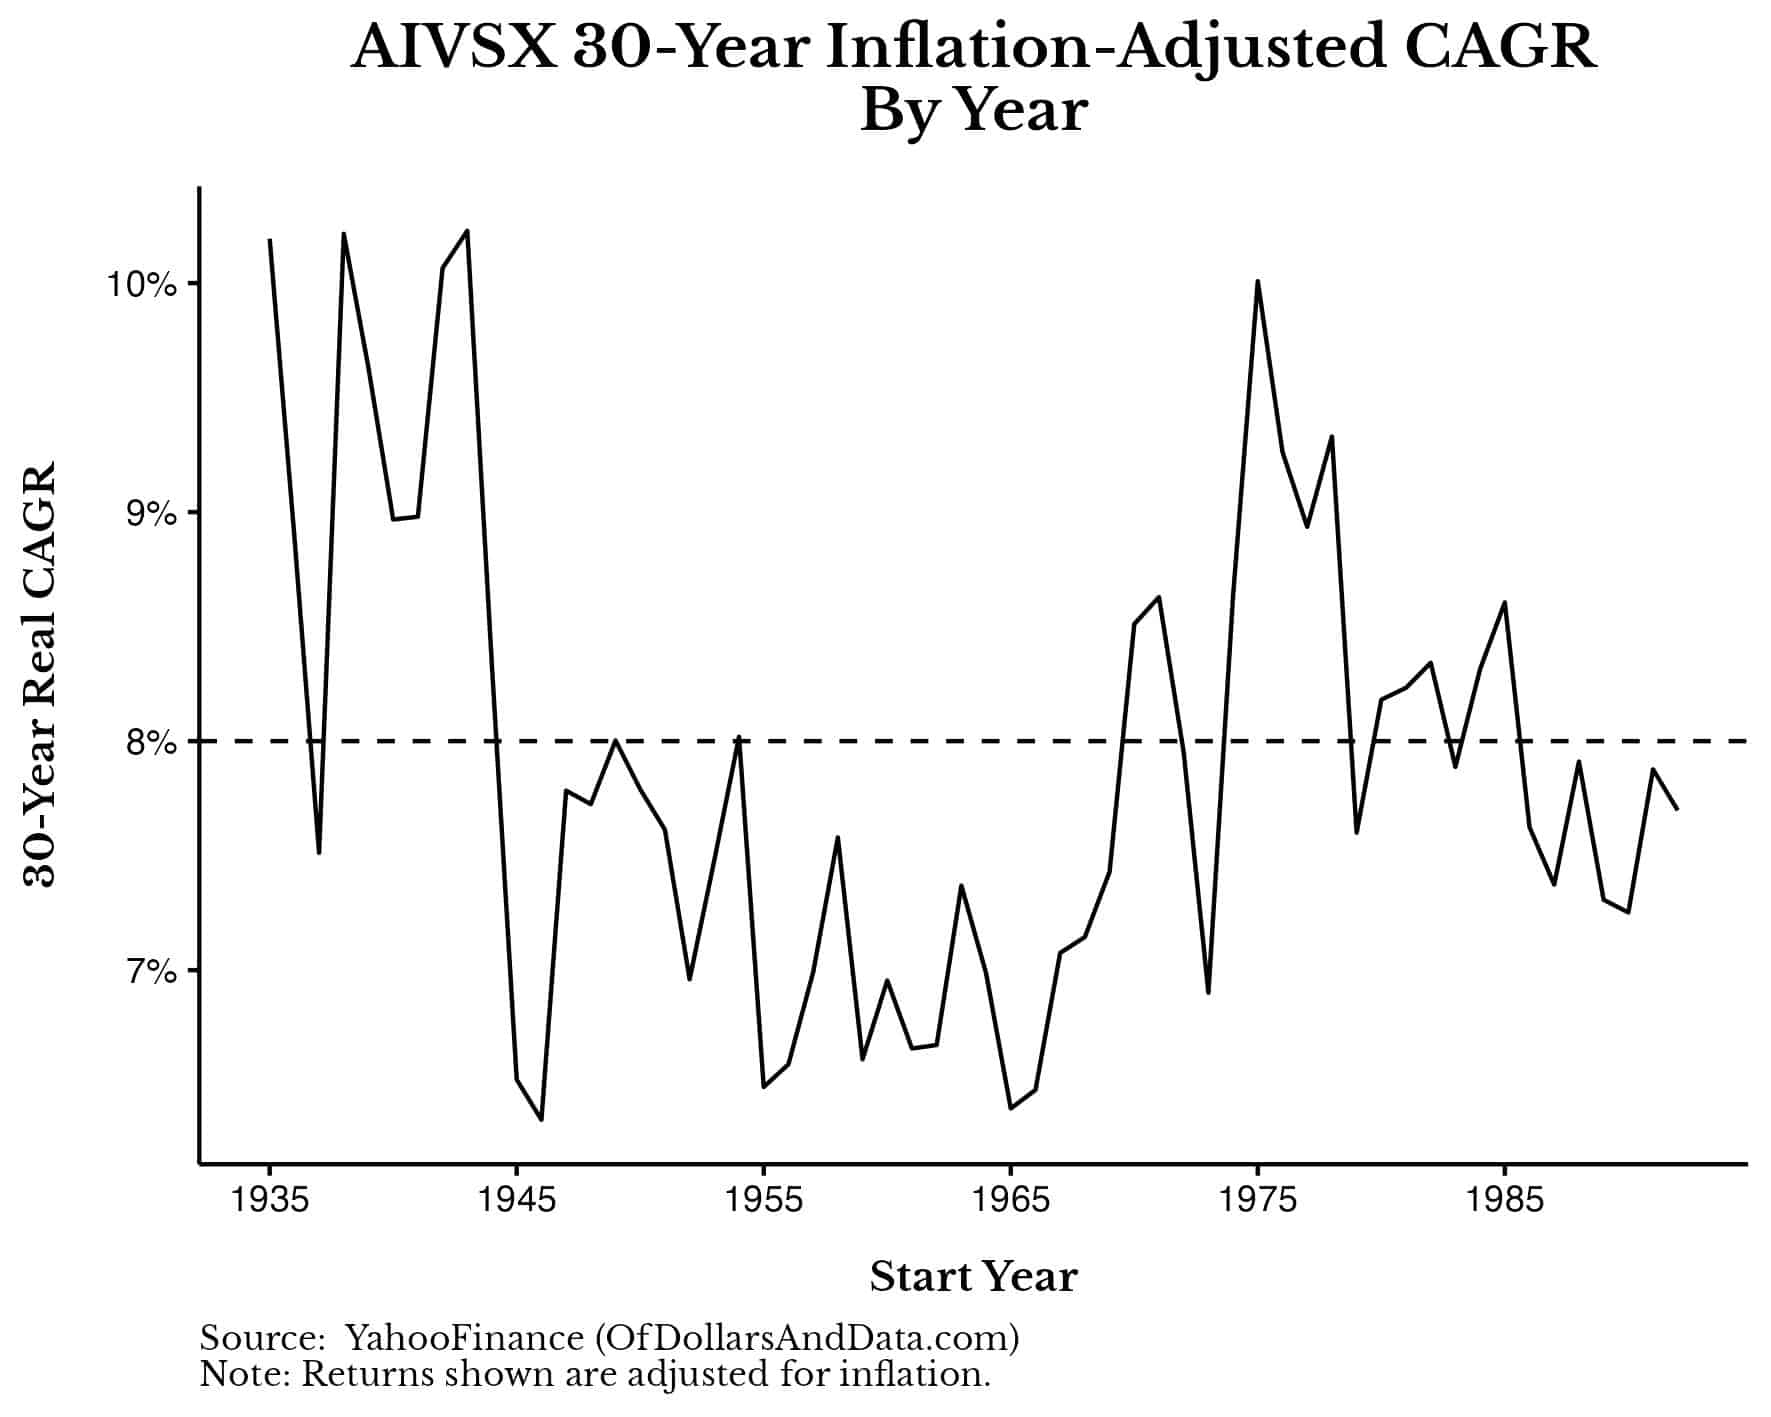
However, this information alone isn’t enough to tell us whether this portfolio would survive for a particular 30 year period.
For example, if we were to plot the same plot above but add a green dot for every historical simulation that survived 30 years with an 8% withdrawal rate (and a red dot for those that didn’t), the 8% long-term “hurdle” would have little to do with it:
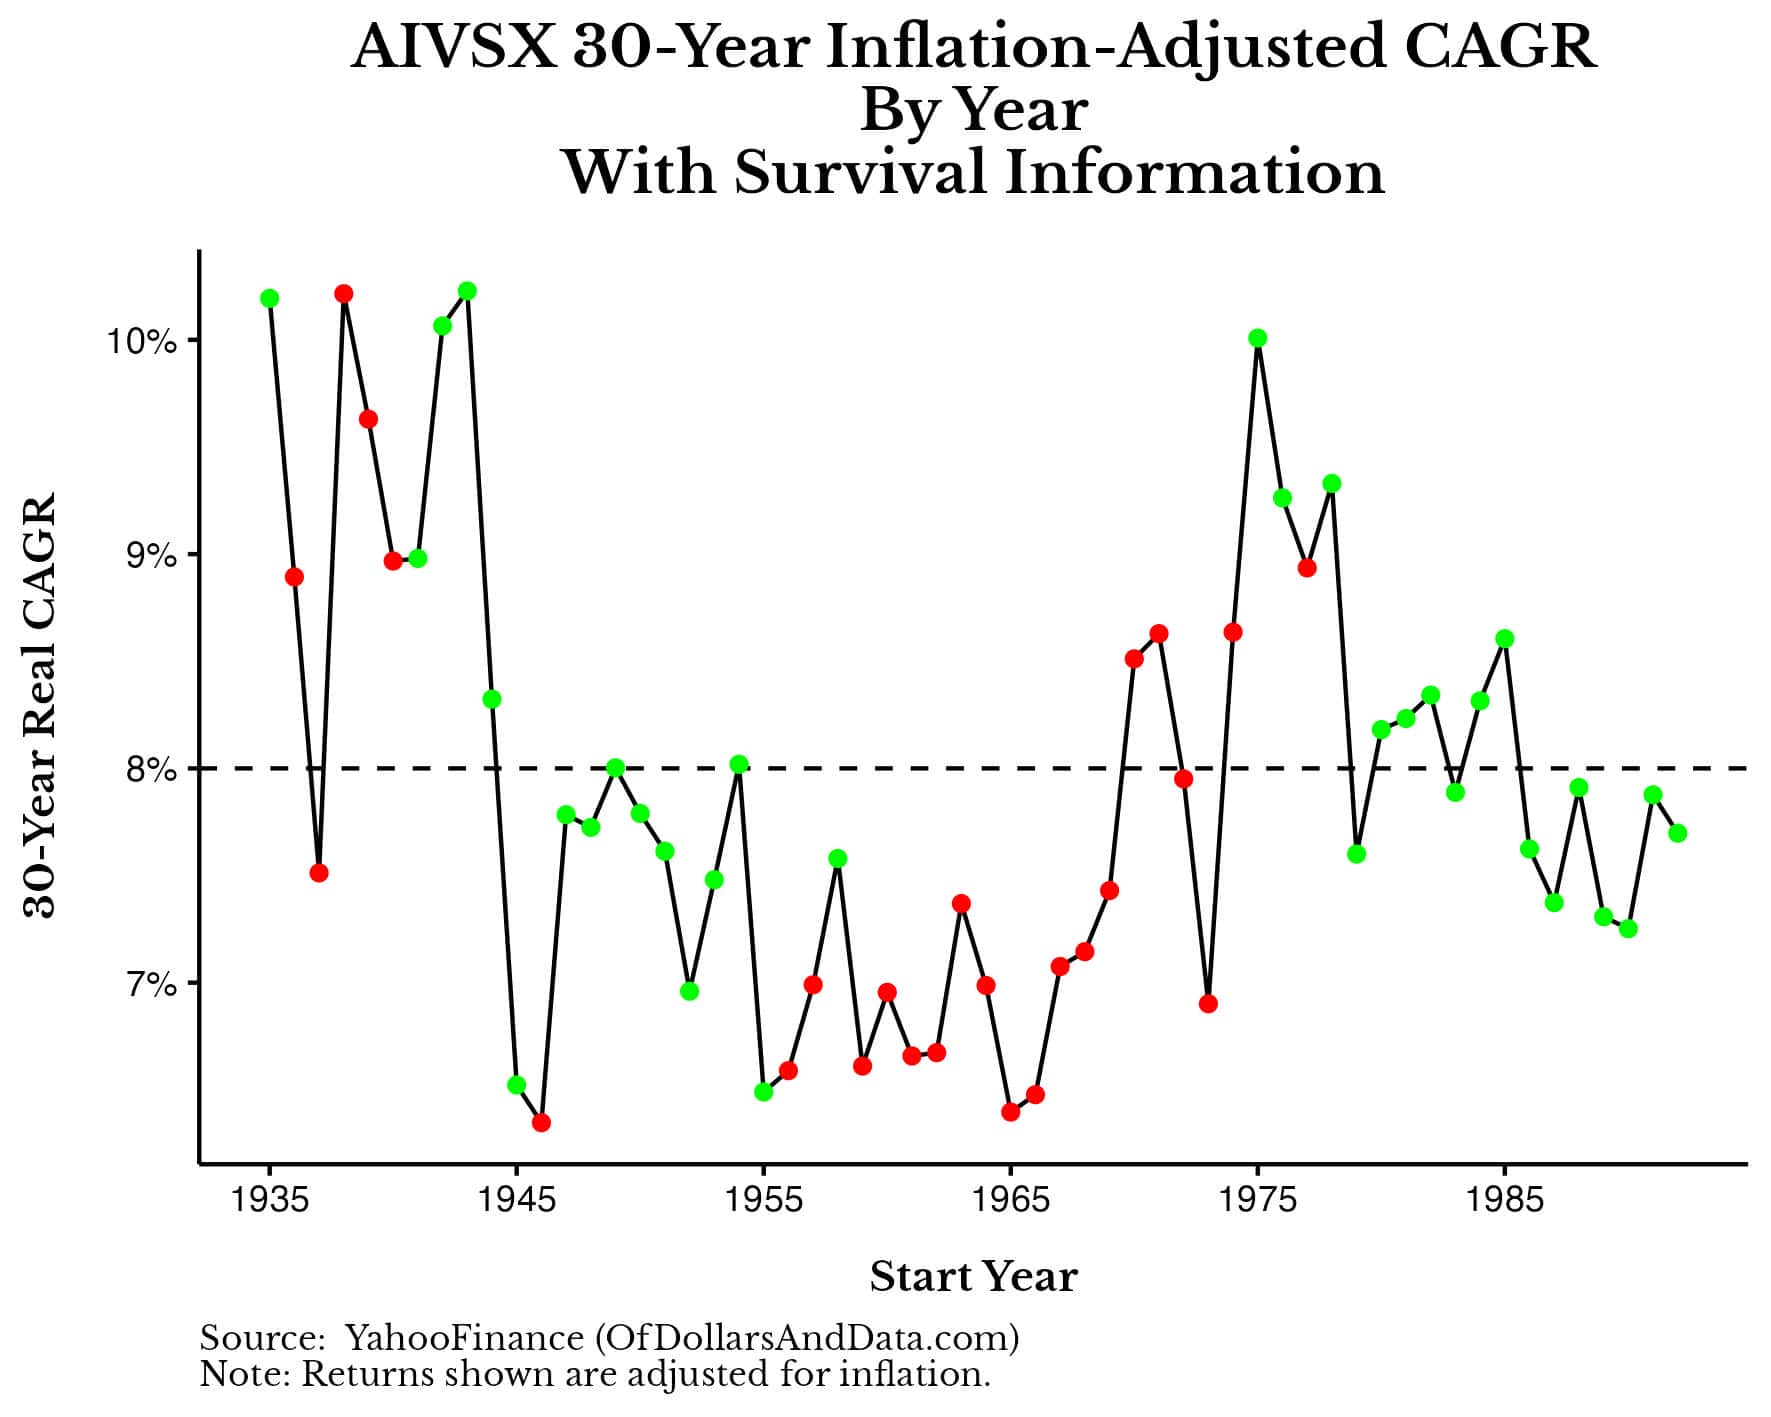
While there are a lot of red dots below the 8% real return rate, there are also lots of green dots below it as well. This implies that the long-term real returns of AIVSX aren’t all that correlated with whether an 8% withdrawal rate will bankrupt the portfolio after 30 years.
But, now let’s look at a shorter time period. If we were to plot the forward return data for AIVSX for only 10 years, we would see that the range of real annualized returns varies from -2% to 15% per year:
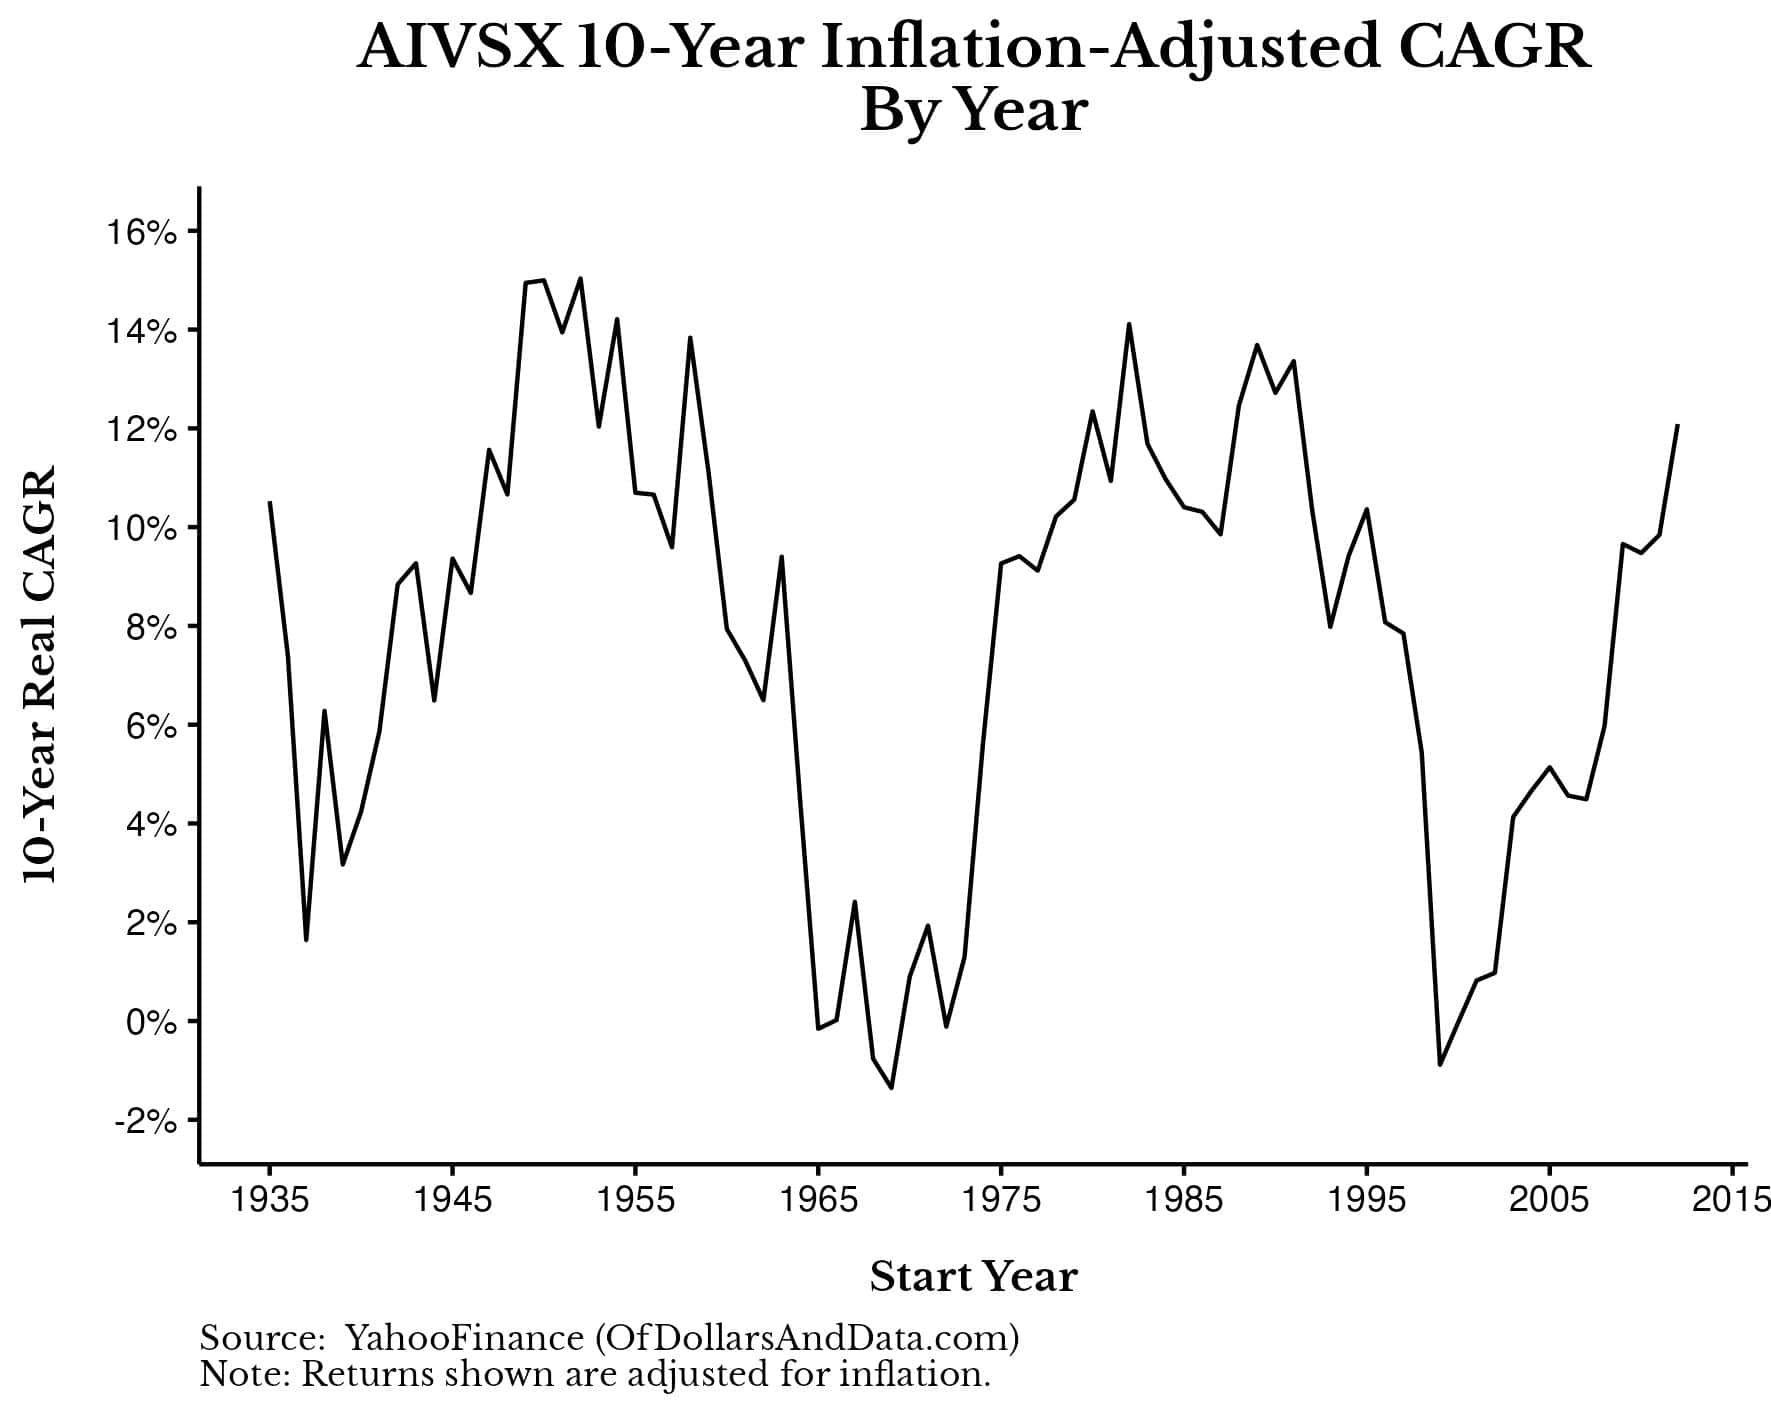
The problem with Ramsey’s 8% withdrawal rate is that you don’t always get good or even “average” returns right out the gate. And when you don’t, the results aren’t pretty.
Below is the same plot as above but with a green dot for every historical simulation that survived 30 years with an 8% withdrawal rate, a red dot for those backtests that ran out of money, and a gray dot where we don’t have enough data (i.e. the 30-year period isn’t over yet):
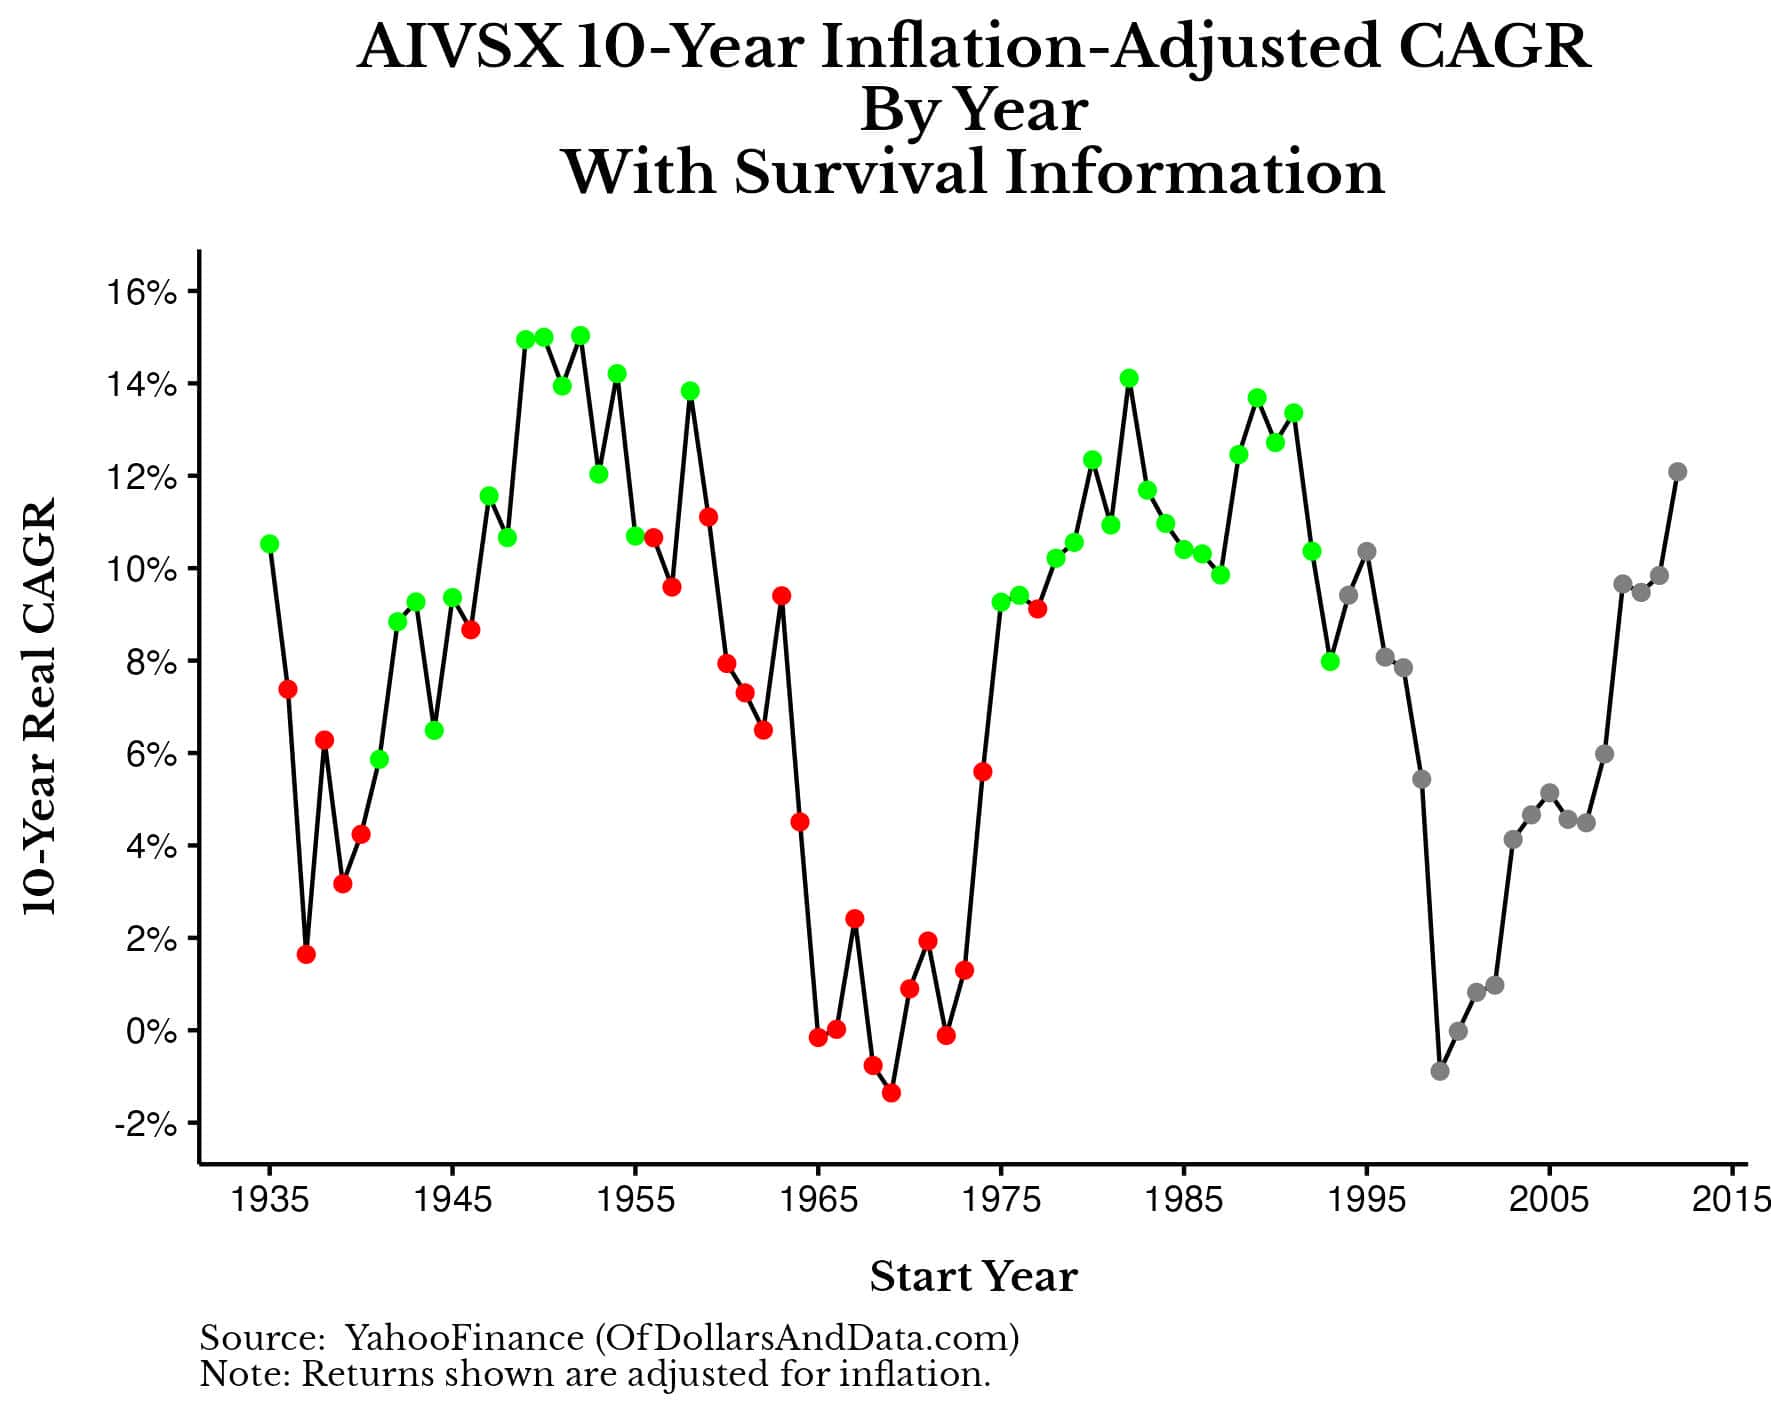
As you can see, most of the red dots (i.e. times when you run out of money) occur when the real returns over the first 10 years of retirement are quite low (<5% per year). This demonstrates why the sequence of returns, particularly in the first decade of retirement, can be so important.
This is where Dave Ramsey went wrong when arguing for an 8% withdrawal rate. This only works as long as you don’t get unlucky during the first 10 years of retirement! Given that the probability that you run out of money over a 30-year timeframe is only a little worse than a coin flip (42%), Ramsey’s advice is far riskier for a retiree than he might have initially imagined.
However, to Dave’s credit, an 8% withdrawal rate would’ve survived every 30-year simulation since 1978. While there is some recency bias in this result, it is still technically correct and an argument in favor of an 8% withdrawal rate.
Now that we’ve examined how safe an 8% withdrawal rate is, let’s wrap things up by discussing the results and what might be a more conservative approach for retirees.
The Bottom Line
After reviewing the actual simulation results using an 8% withdrawal rate, I have to admit that I was a bit surprised. I expected them to be far worse than they actually were. This suggests that Ramsey may be more directionally accurate in his assessment that withdrawal rates can be higher than what we typically hear. However, going on to suggest an 8% withdrawal rate in a 100% stock portfolio seems like a bit much to me.
You have to remember that the 4% safe withdrawal rate (“4% Rule”) popularized by William Bengen in the early 1990s was based on someone using a 50/50 U.S. stock/U.S. bond portfolio, not 100% stocks. And, even when you use 100% stocks, your withdrawal rate can increase above 4%, but not by much.
I tested this by running the same 30-year retirement simulations with withdrawal rates ranging from 3% to 10% using AIVSX and found that a 4%-5% withdrawal rate is still the sweet spot. Withdrawing 4%-5% annually (while adjusting your spending for inflation) is the range where you are unlikely to run out of money even within a 100% equity portfolio:
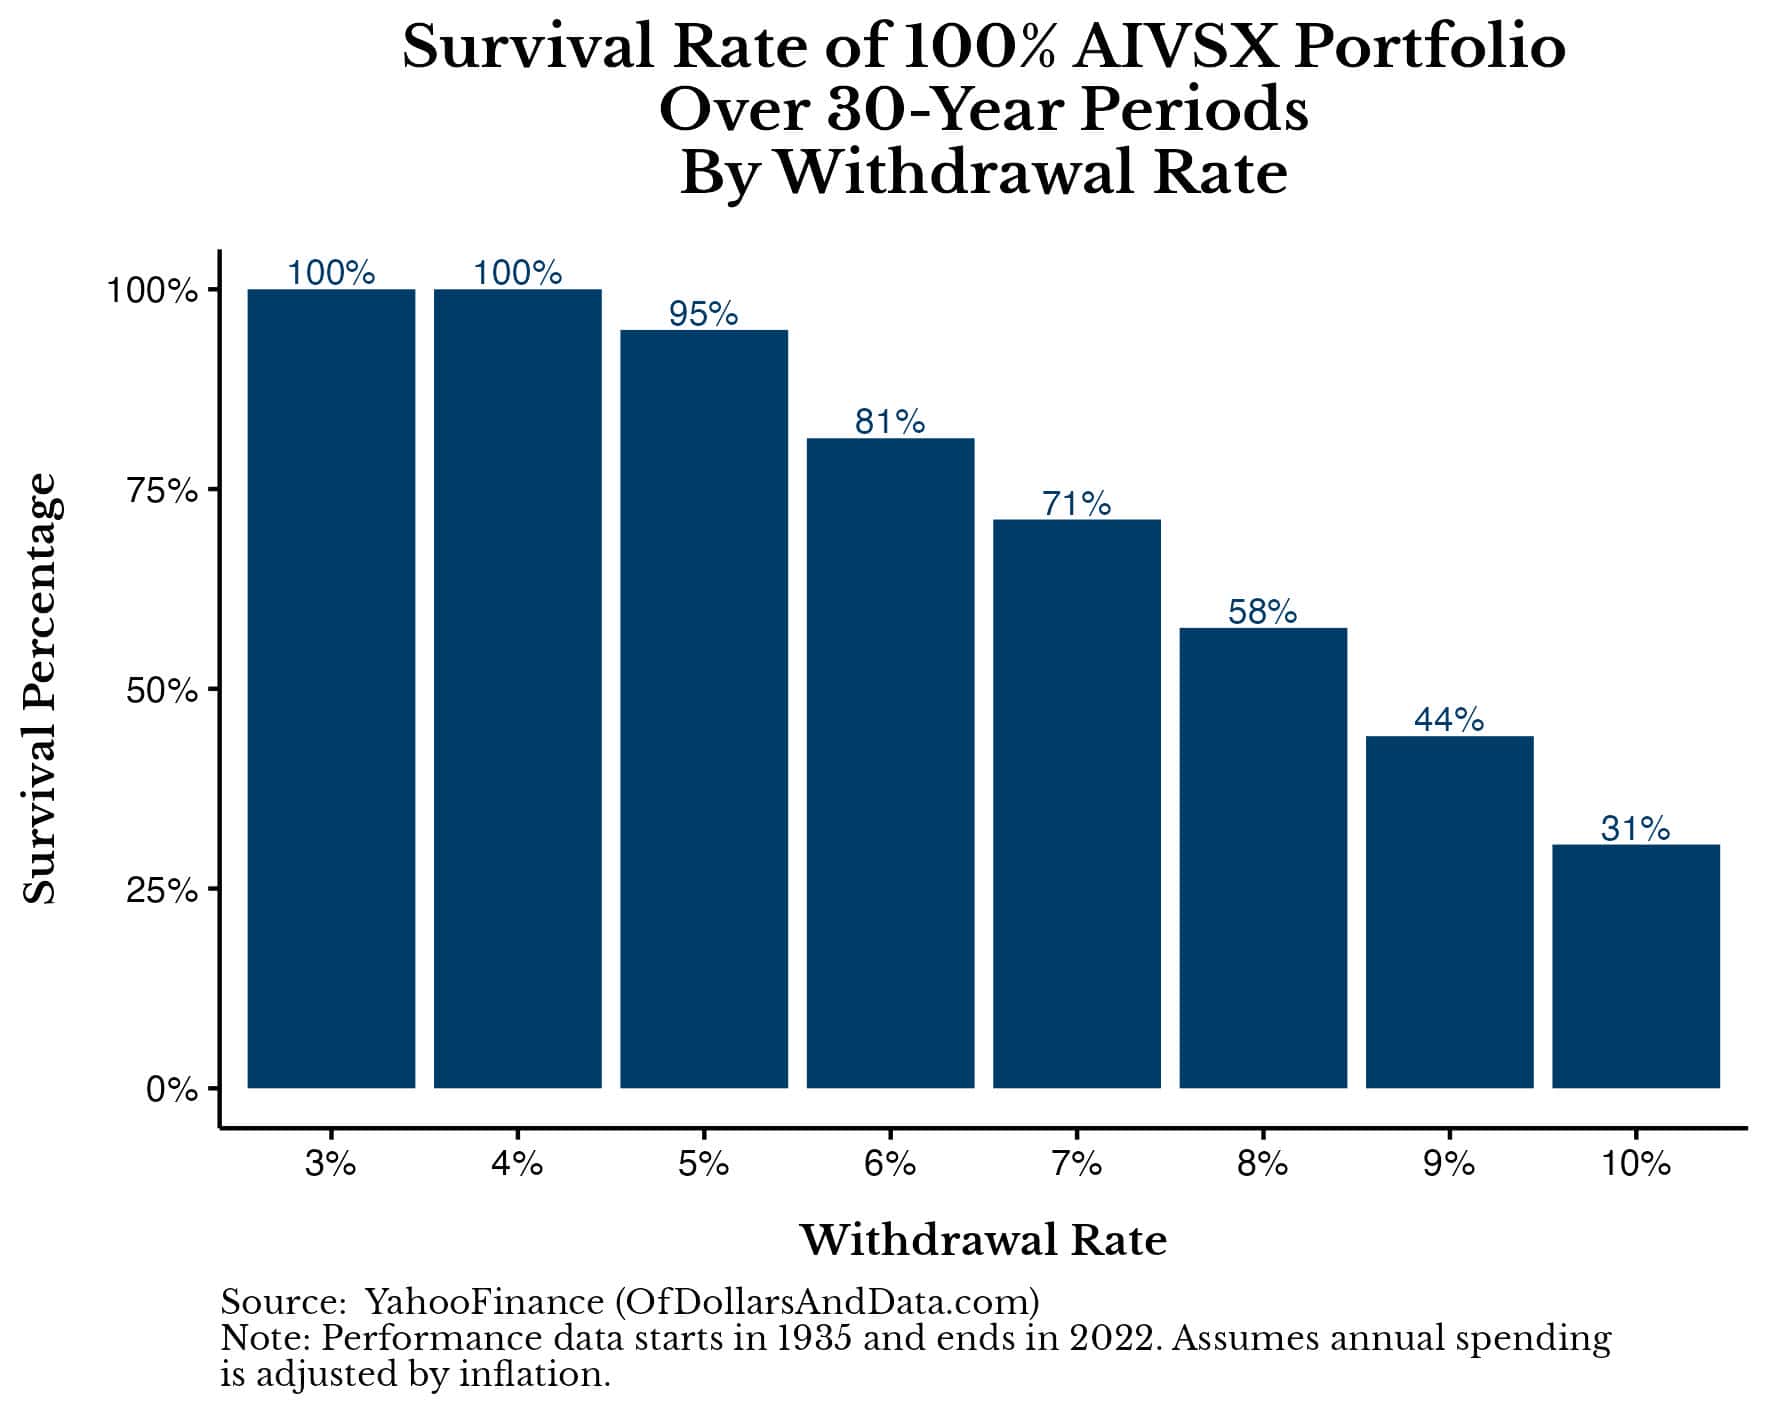
Once you go above 5%, the chance of you running out of funds begins to increase significantly. Of course, there are ways to go above a 5% withdrawal rate without increasing the risk of running out of money, but that requires a big change in how you spend money in retirement.
Regardless of how you decide to spend your money in retirement, this analysis illustrates that there is no “right” withdrawal rate. There are only different risks and the tradeoffs associated with them. Whether you are willing to take these risks and live with these tradeoffs is, ultimately, up to you.
Until next time, happy investing and thank you for reading!
If you liked this post, consider signing up for my newsletter.
This is post 372. Any code I have related to this post can be found here with the same numbering: https://github.com/nmaggiulli/of-dollars-and-data

