It’s been a rough year for the 60/40 portfolio. As Charlie Bilello tweeted a few weeks ago, the 60% U.S. stock/40% U.S. bond portfolio is down over 20% year-to-date, its worst year since 1931:
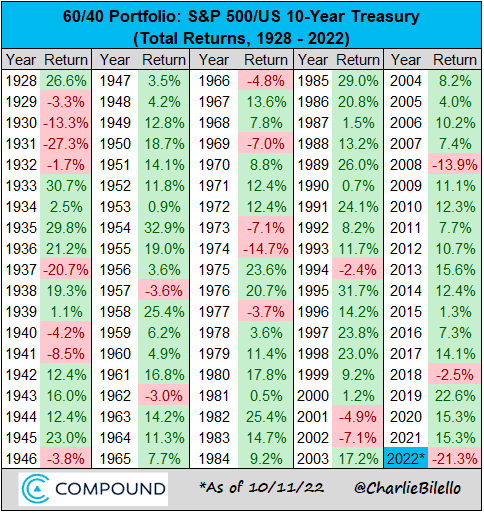
Part of the reasoning for this is because U.S. stocks are down over 20% this year. That usually isn’t a problem for the 60/40 because the 40 (i.e. U.S. bonds) typically offsets any declines in U.S. stocks. During a typical market crash, bonds don’t decline much and sometimes even go up in value as investors exit their equity positions. This flight to safety is what has made the 60/40 a powerful portfolio during financial crises, at least historically. But, this time is different.
Because of the distinctive conditions in our macroeconomic environment, U.S. bonds have gotten hammered in a big way even as U.S. stocks have declined. Let’s look at the factors that have caused this decline and how this short-term pain was necessary for the 60/40 portfolio to make a comeback.
Why U.S. Bonds Are Down Bad
If I had to imagine a scenario where U.S. bonds got demolished, it would be hard to come up with an environment worse than one we experienced this year. In particular, there are three primary factors that are responsible for the current decline in U.S. bonds:
- Low initial bond yields
- High inflation
- Rising interest rates
I will discuss each in turn.
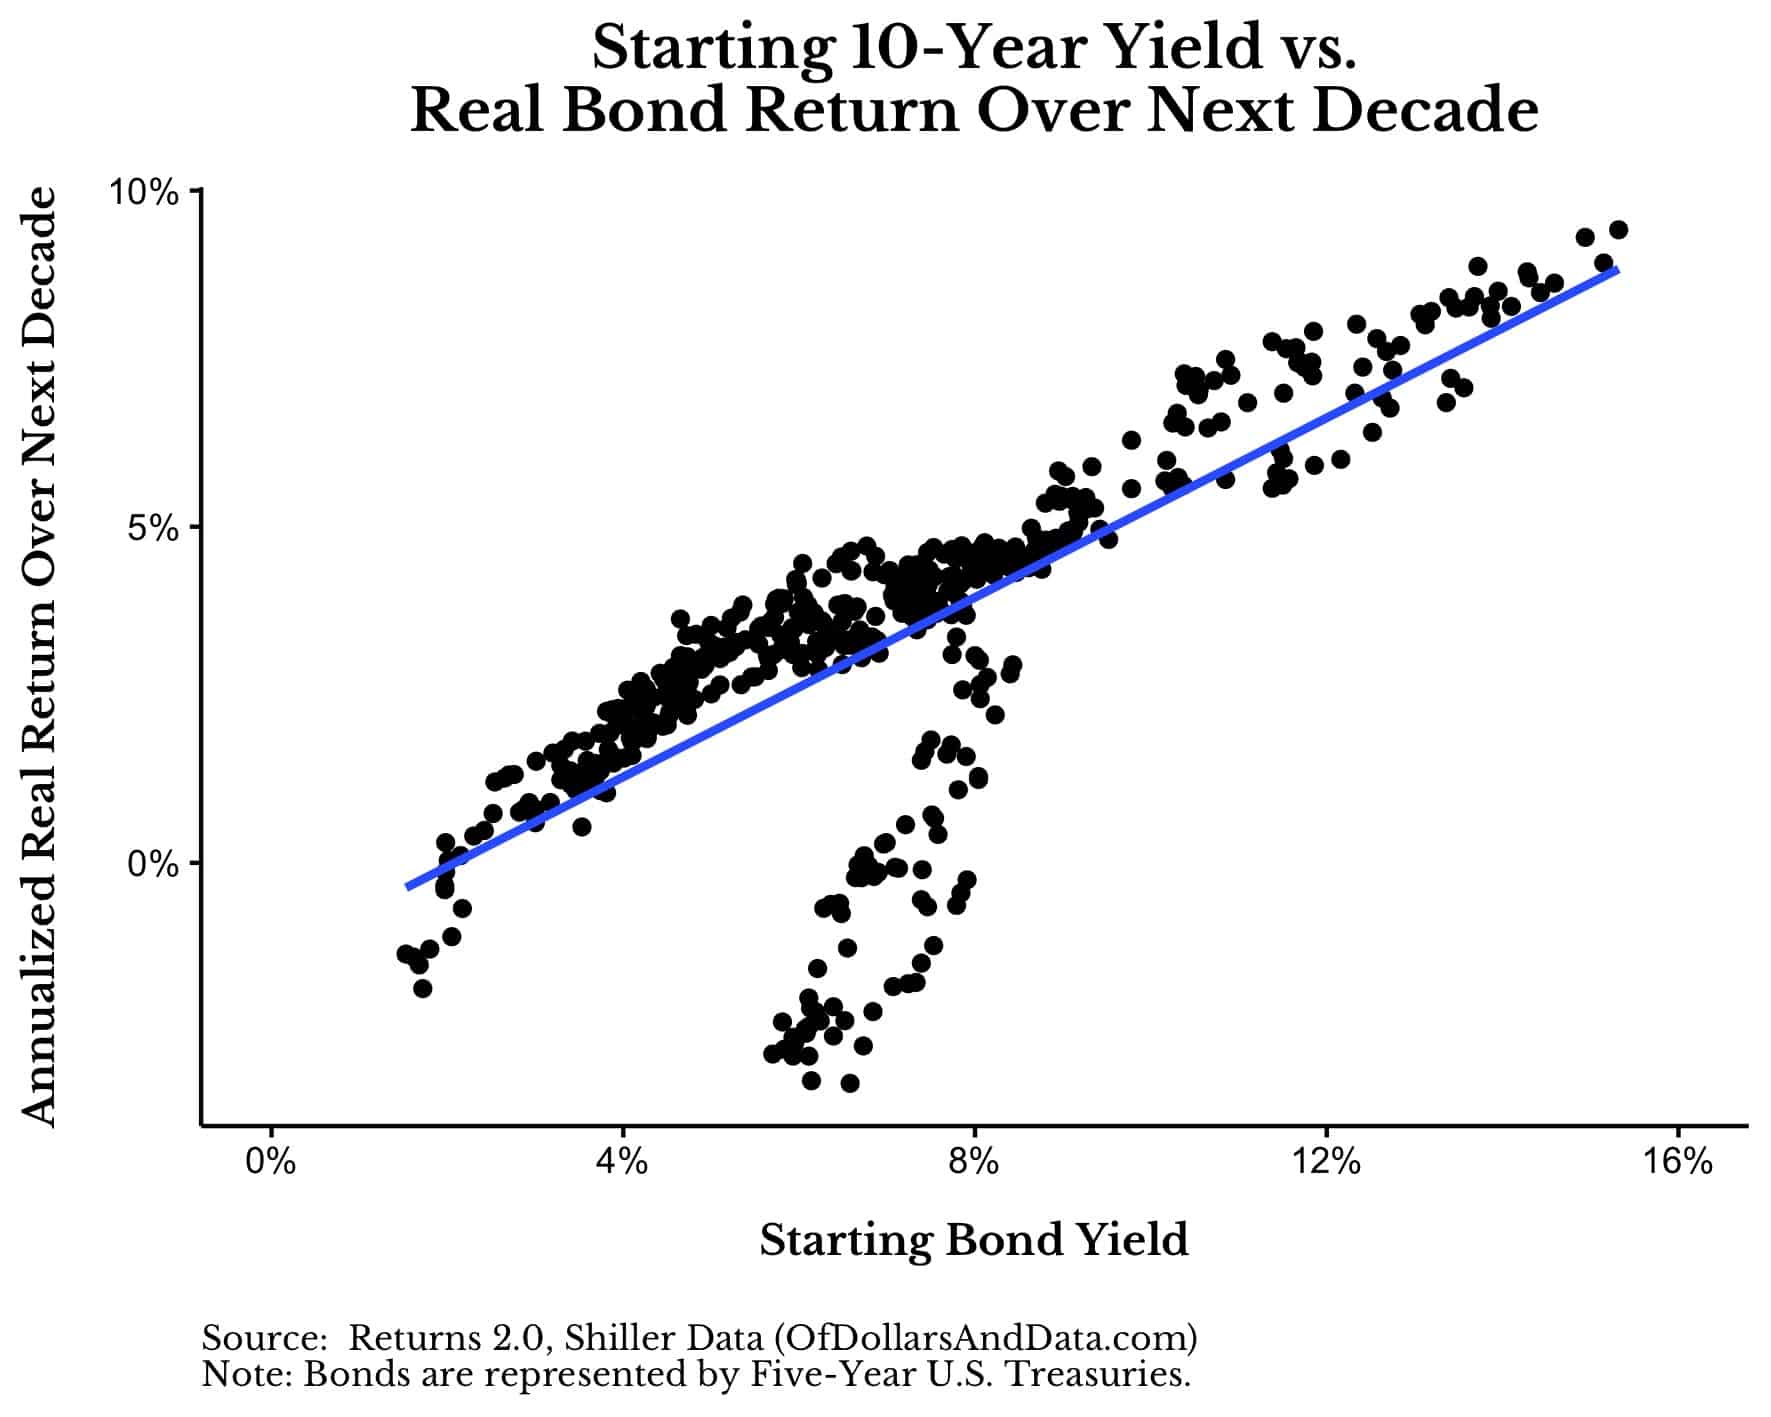
Firstly, there is a strong positive relationship between starting bond yields and future returns on U.S. bonds. As you can see in the chart below, when the yield on 10-Year U.S. Treasuries is lower, future returns on U.S. bonds tend to be lower as well, all else equal:
The only time when this relationship doesn’t seem to hold is when inflation is high (we will get to this in a moment).
The data for the plot above goes back to 1970 and shows how future real (i.e. inflation-adjusted) returns tend to rise when starting bond yields are higher. This explains why the highest future annualized real return for U.S. bonds occurred in September 1981, when the yield on 10-Year U.S. Treasuries was over 15%. If you had purchased U.S. bonds at that time, your return over the next decade would have been 9.4% per year after inflation.
Given how low U.S. bond yields were over the past few years, the expected forward returns weren’t great for bonds to begin with. However, what made this problem even worse was our second factor—high inflation.
As you can see in the plot below, when future inflation is higher, U.S. bond returns over the next year tend to be lower:
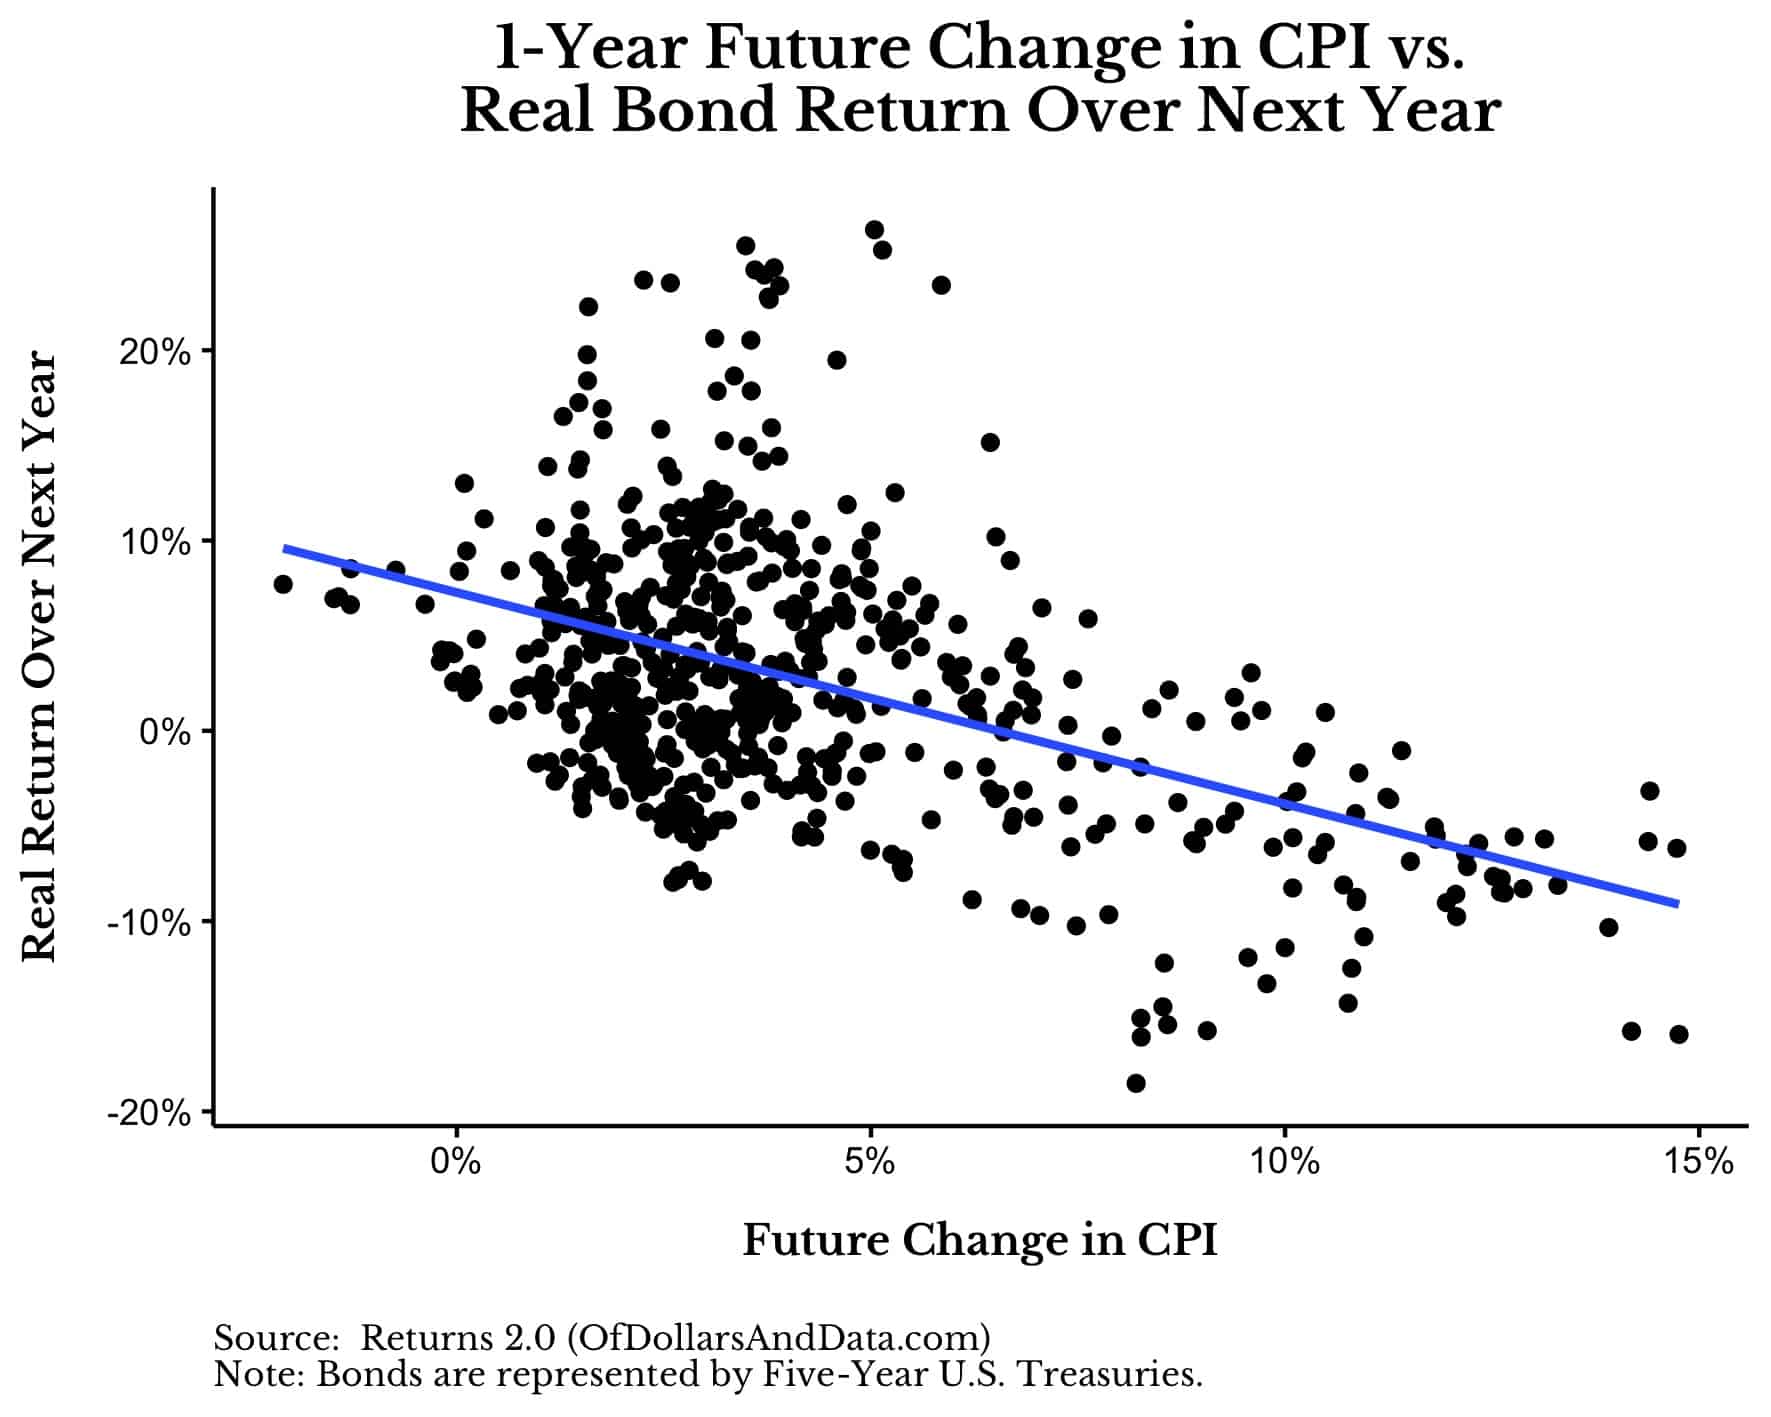
For example, if we went back a year and knew that inflation would be 8.2% over the next 12 months (since that’s what inflation actually was over the last year), then we could make an educated guess about what bond returns might be over the next year. And, if we look around 8.2% on the x-axis above, we can see that most of the future one-year returns in U.S. bonds are low or negative. High inflation isn’t good for U.S. bonds in the short-term.
Of course, we cannot know what future inflation will look like. But, if we did know, then avoiding bonds would probably be a good idea.
This brings us to our last and final nail in the coffin of U.S. bonds this year—rising interest rates. As you may remember, a bond’s price is inversely related to interest rates available in the market place. So, if interest rates go up, bond prices go down, and vice versa.
Why is this? Because as rates rise, those bonds paying lower rates become less valuable relative to those paying higher rates. Oh, your 10-Year Treasury bond is paying 0.8% per year for the next decade? How cute. A new 10-Year Treasury bond is paying over 4% per year. So, why would I buy your bond paying 0.8% when I could get a new one paying 4%? The answer is: I won’t unless you drop the price.
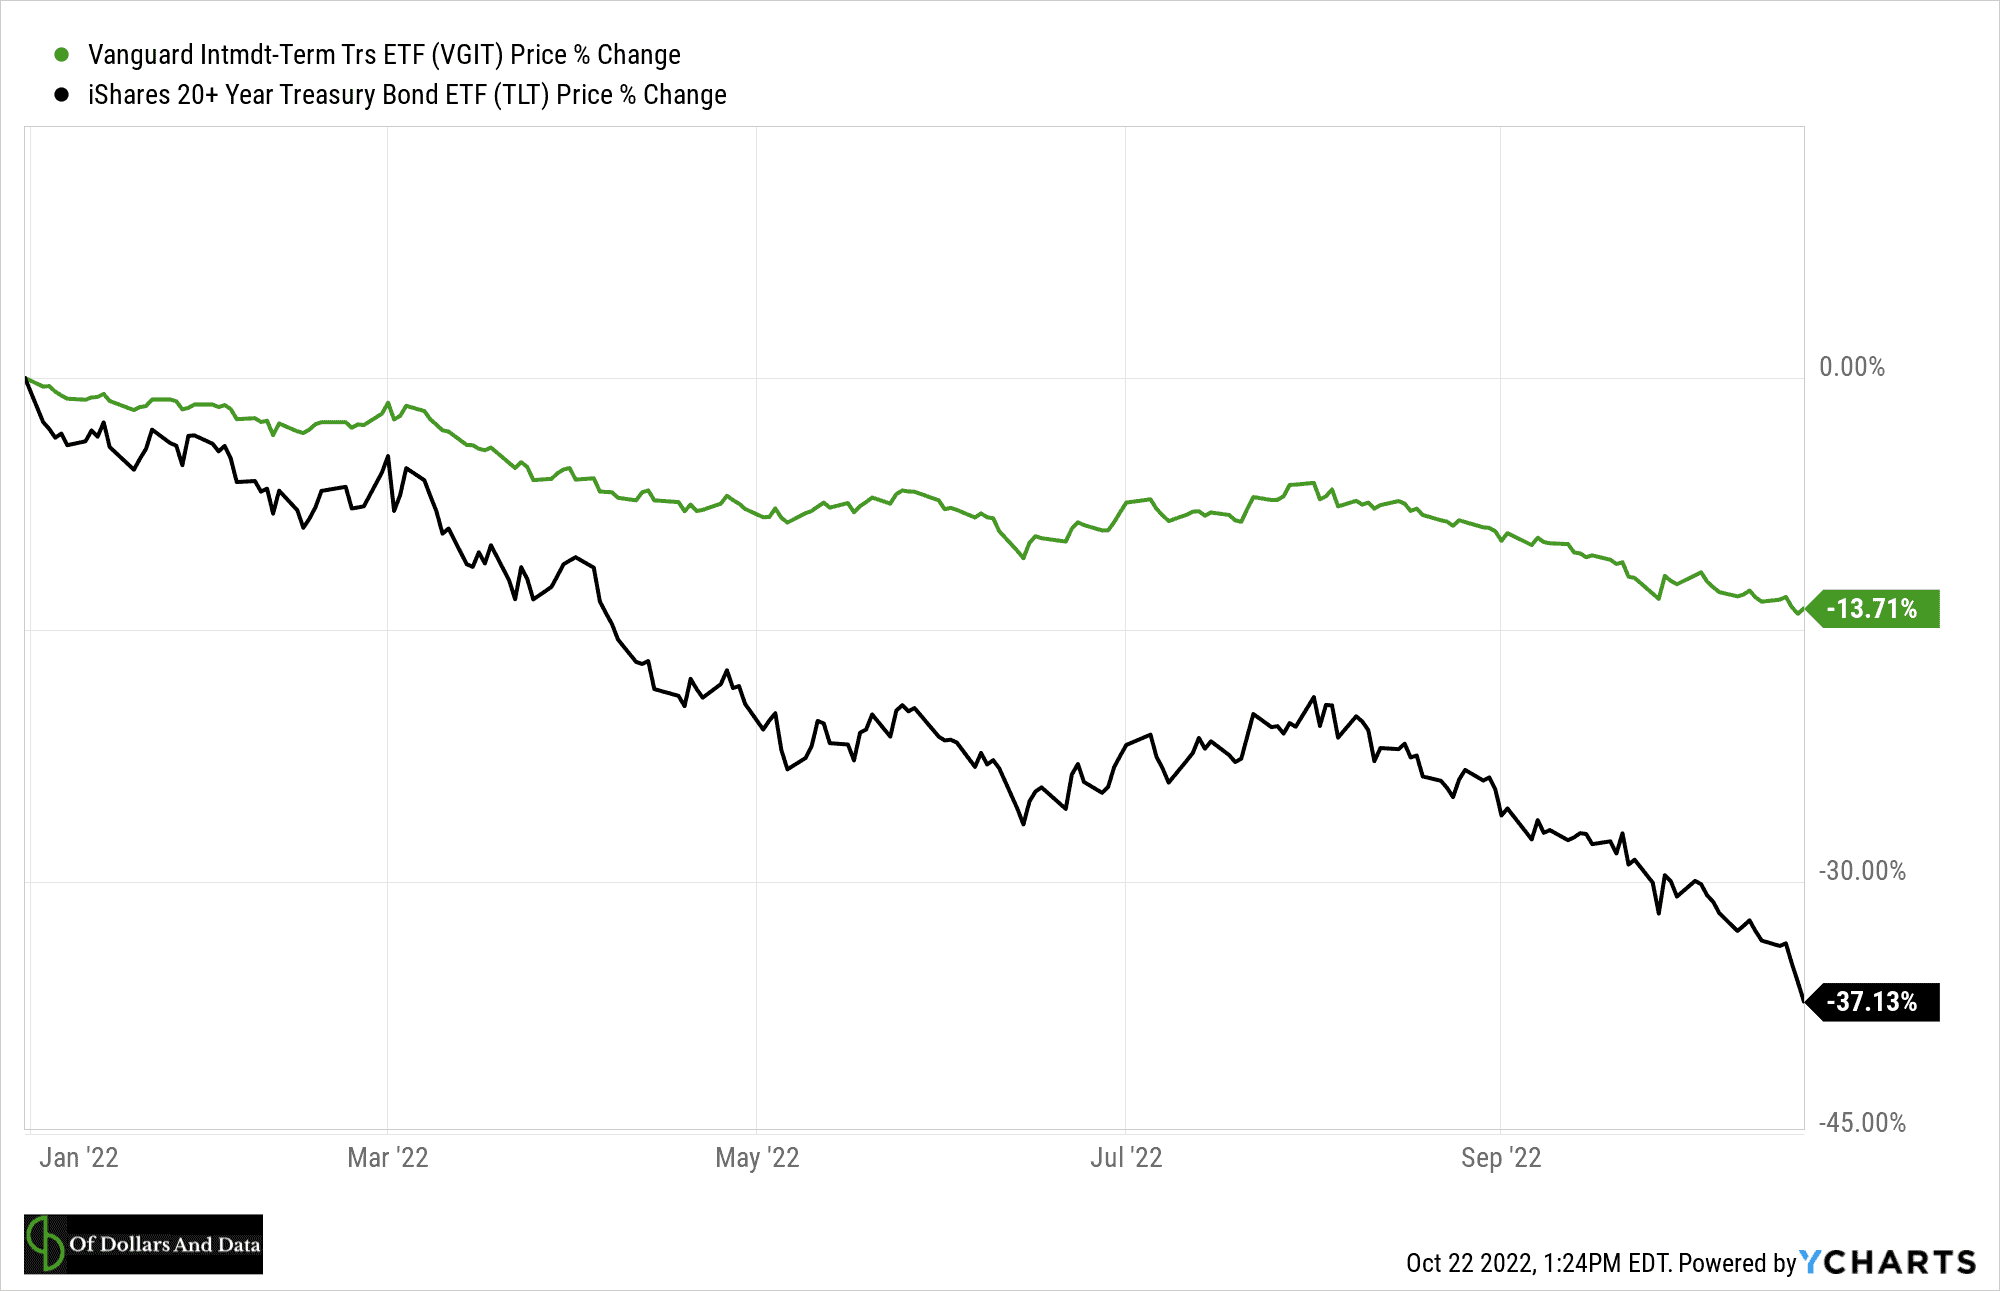
And that’s exactly what has happened this year. As I explained last week, as interest rates shot up from about 1% to 4%, U.S. bonds (most of which were paying closer to 1%) took a beating. In particular, intermediate-term U.S. Treasuries (my bonds of choice) are down about 14% this year while long-term U.S. Treasuries are down about 37%:
It’s these three factors—low initial yields, high inflation, and a rapid increase in interest rates—that led to the steep decline in U.S. bonds investors have been experiencing this year. That’s the bad news.
But, the good news is that the pain bond investors are experiencing now will pave the way for the 60/40 comeback later.
How the 60/40 Makes a Comeback
The 60/40 portfolio will eventually make a comeback for the exact opposite reasons why it struggled this year. If bonds don’t do well when starting yields are low, inflation is high, and rates are rising, then this implies that they do perform well when yields are high, inflation is low, and rates are stabilized or dropping.
And while we aren’t there yet on all of these conditions, some of them have started to materialize. The most obvious one is that yields are no longer abysmally low, with the 10-Year Treasury rate currently around 4.2%. And, at 4.2% (the vertical dashed line in the plot below) the expected future real returns on U.S. bonds over the next decade is positive:

Of course, this is only true if inflation doesn’t get out of control. The only period in the plot above where higher bond yields led to negative real future returns was the inflationary 1970s.
However, there is some evidence that after you’ve experienced high inflation, then future U.S. bond returns become more positive. The plot below shows the future real return of U.S. bonds over the next decade based on the change in CPI over the prior year:
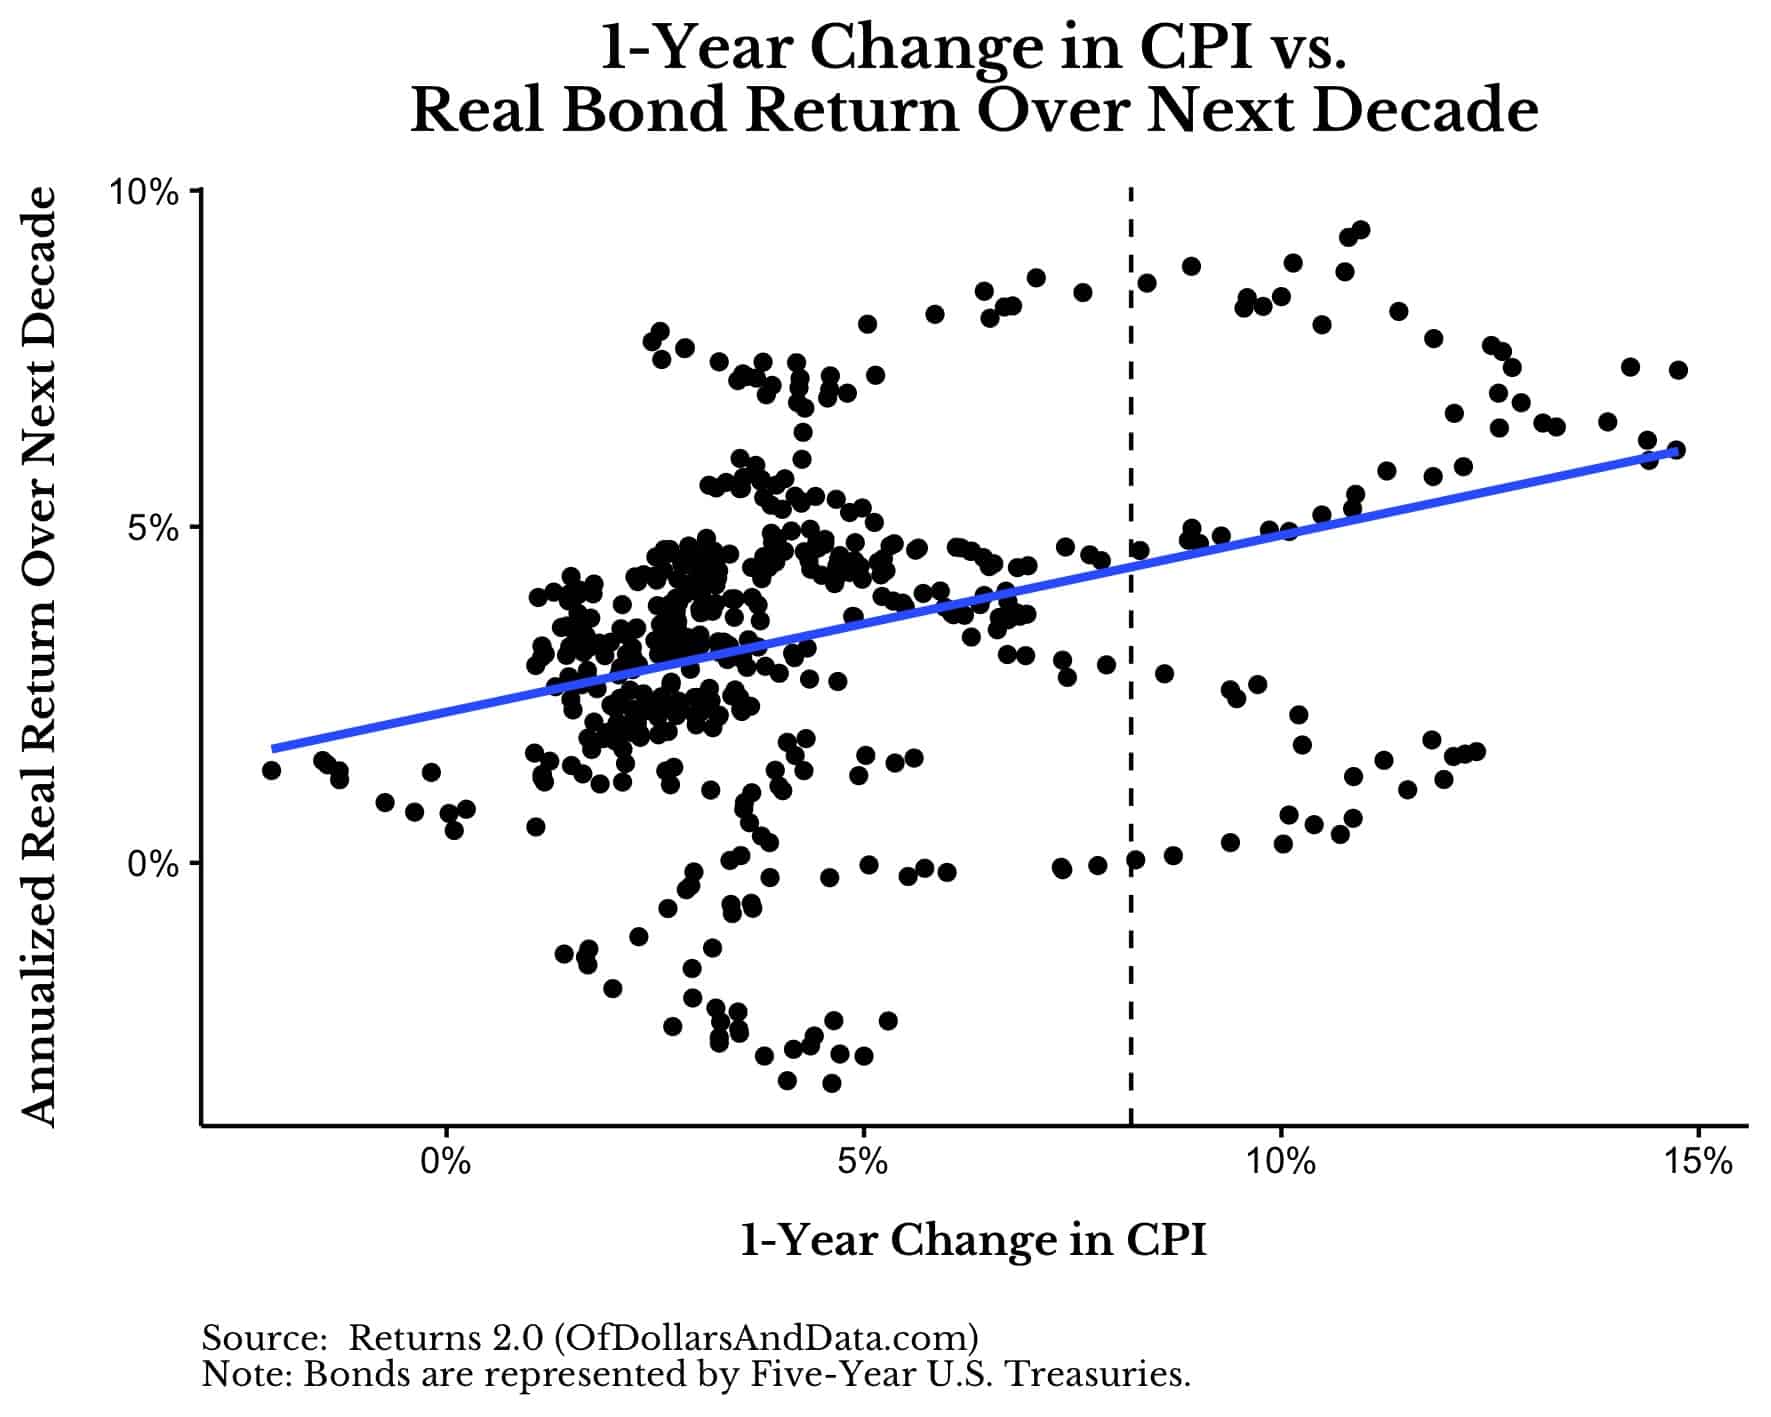
While history may not repeat itself in the same way, this plot suggests that most of the pain for U.S. bond holders is behind us. Of course, it’s possible that there is more pain to come, but, if so, I believe we are closer to the end than the beginning. Since we’ve gone through the most difficult part, investors in U.S. bond can now actually rely on the fixed income portion of their portfolios for yield.
It used to be common to say “there is no alternative” when bond yields were low for as long as they were. But, this is no longer the case. If inflation subsides and yields remain high, then the 60/40 may come back in a big way.
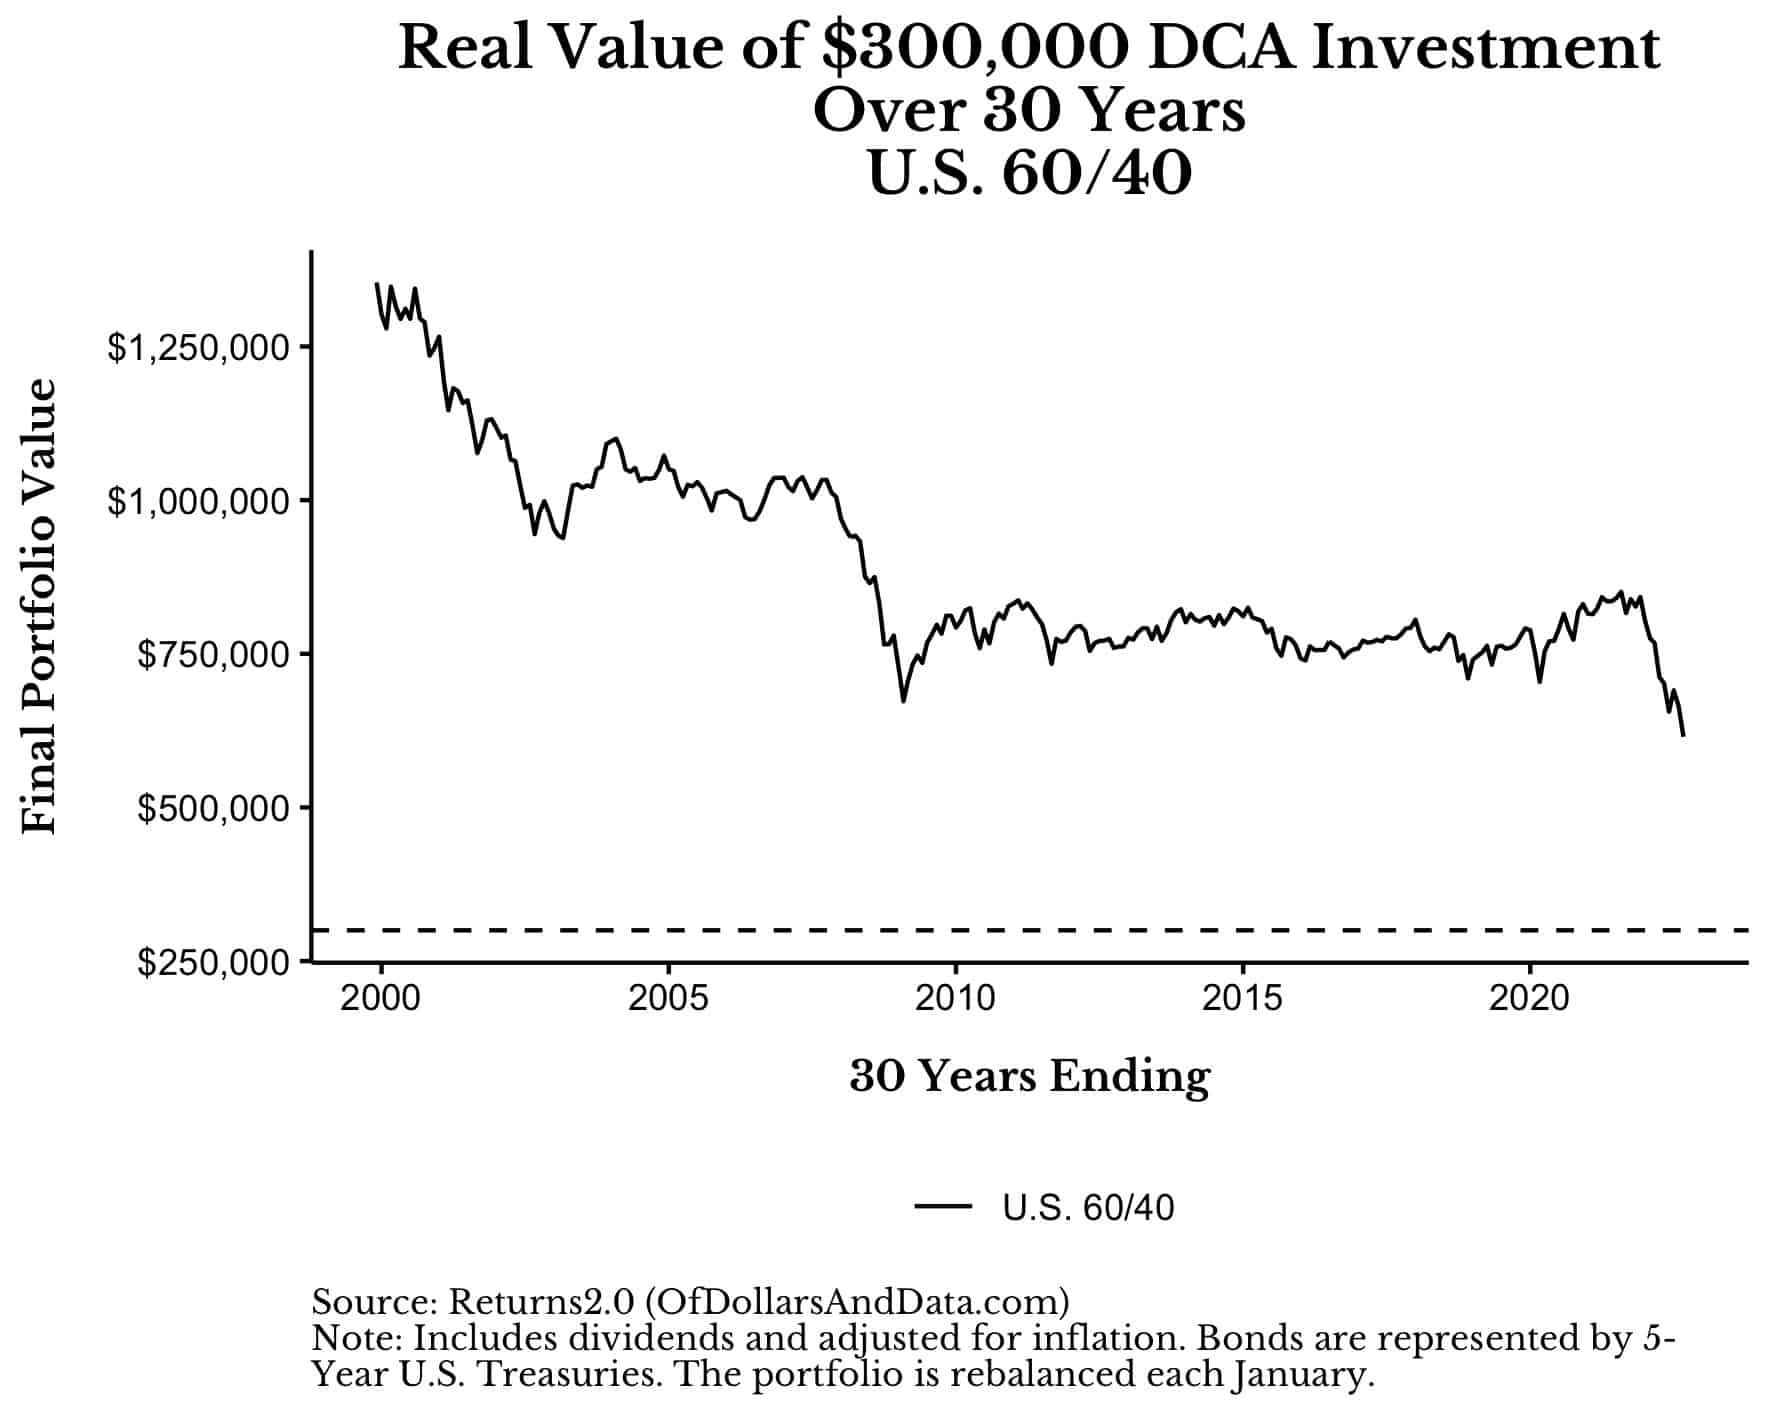
I say that because I don’t see how things could get much worse, at least for U.S. bond investors. Currently, we are experiencing the lowest 30-year DCA performance for the 60/40 portfolio from 1970 until today. In fact, if you had invested $833.33 a month ($10,000 a year) into a 60/40 portfolio for the past 30 years, you would’ve underperformed someone who did the same thing for the 30 years ending March 2009 (i.e. at the market bottom of the Great Financial Crisis):
This decline in performance matches up quite well with the decline in interest rates since the early 1980s:
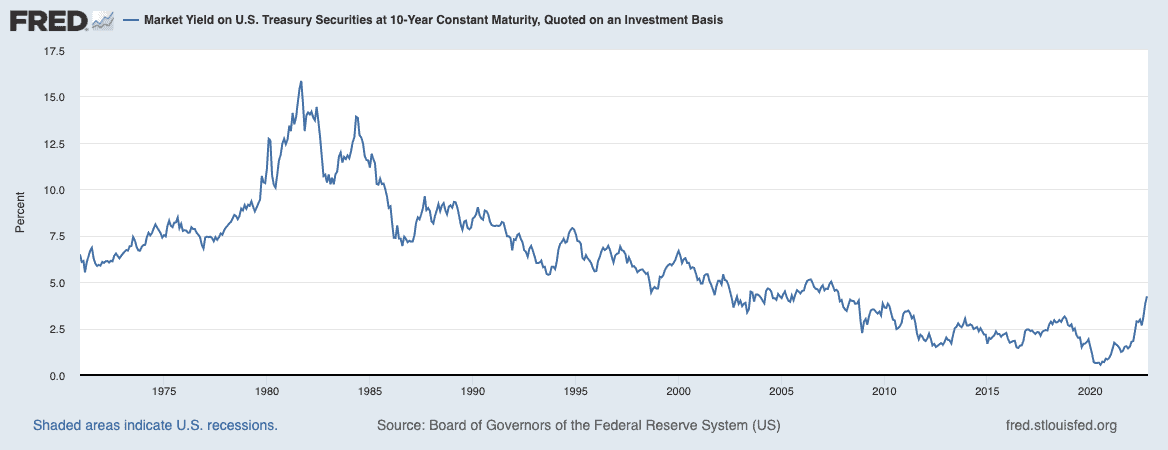
As I demonstrated earlier, lower starting yields are positively correlated with lower future real returns. Therefore, the performance decline we have seen matches our expectations.
But, the trend of ever declining rates seems to be over. If so, then the 60/40 may regain its former glory. Of course, many of you probably don’t (and may never) have a 40% allocation to U.S. bonds. But if the 60/40 comes back, you may want to reconsider the size of your bond allocation. Only time will tell.
Happy investing and thank you for reading!
If you liked this post, consider signing up for my newsletter.
This is post 318. Any code I have related to this post can be found here with the same numbering: https://github.com/nmaggiulli/of-dollars-and-data

