Exactly 12 weeks ago I released my first book, Just Keep Buying. Though the responses to the book have been overwhelming positive, one critique I have seen a few times is that the book’s main philosophy of buying assets consistently over time isn’t all that groundbreaking. After all, you don’t need a 275 page book to tell you to practice dollar cost averaging, do you?
I agree, in theory. Though my book covers much more than dollar cost averaging, if you are able to buy a diverse set of income-producing assets over time, you will probably do well. That’s at least half the battle.
However, I still disagree with this critique in practice. Why? Because we don’t live in the theoretical world. We live in the real one. And, in the real world, we don’t get 7% returns each and every year. In the real world, markets don’t always go up and to the right. In the real world, Just Keep Buying isn’t as simple as it seems.
This is why I wrote the book. I didn’t write it for the good times. I didn’t write it for the bull market. I wrote it for the bear market. I wrote it for times like today.
Because it’s easy to say Just Keep Buying when stocks are going up. But what about when they are going down? What about when consumer prices are going through the roof? What about when there is increased economic and geopolitical uncertainty? Not so easy now, is it?
Don’t fear though, because I am here to defend dollar cost averaging as the greatest investment approach ever invented for the individual investor. How so? Because I’m going to show you how it held up during one of the worsts period in U.S. stock market history—the mid 1960s to the early 1980s. And if it worked there, it can work anywhere. Let’s dig in.
[Quick aside to prevent confusion: There are two commonly used definitions for the term dollar cost averaging: (1) Investing money over time as soon as you have it (i.e., buying in your 401k every 2 weeks), and (2) slowly investing a large amount of cash. This post refers to definition (1). I generally disagree with definition (2) and have thoroughly debunked this style of investing here and in my book. Okay, now let’s actually dig in.]
The Worst Period in U.S. Stock Market History?
As Ben Carlson illustrated, the mid 1960s to the early 1980s were a difficult time to be a U.S. stock investor:
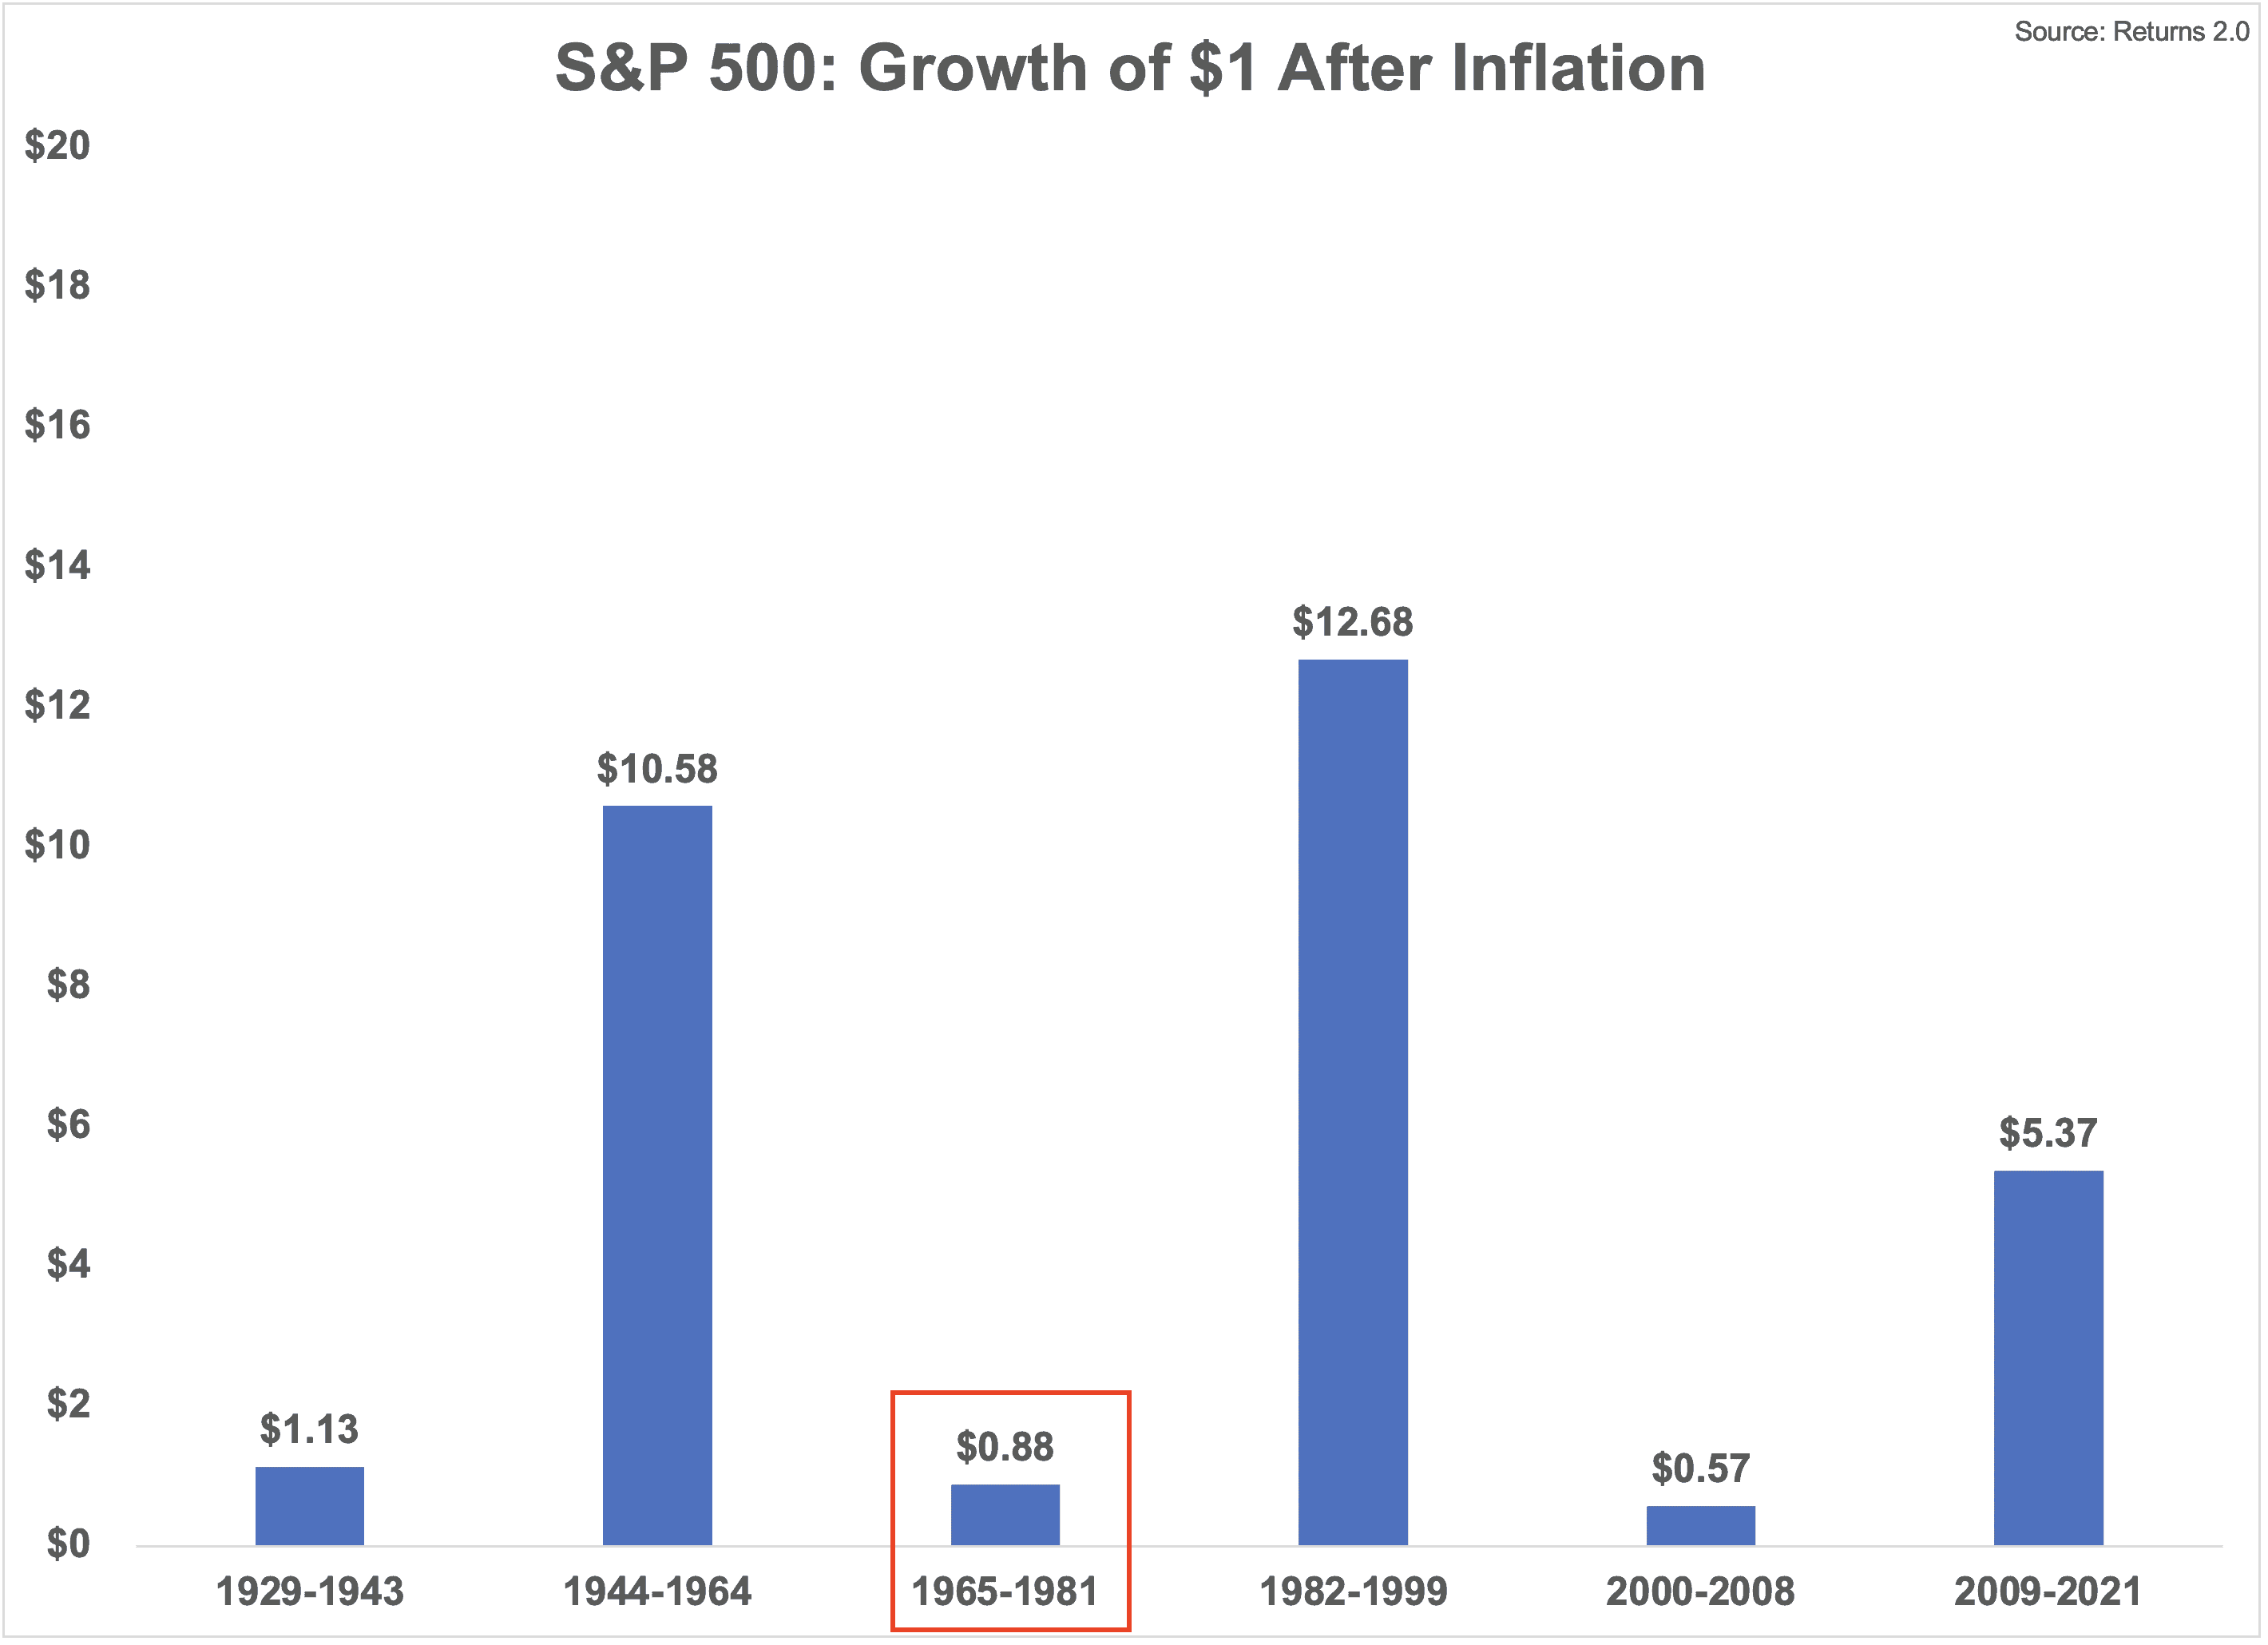
Even after reinvesting dividends and adjusting for inflation, U.S. stocks lost money over 16 years, the longest inflation-adjusted loss on record.
If we were to plot the growth of $1 in U.S. stocks (i.e. the S&P 500) over this time period, we would see just how big of an impact inflation had on stock returns:
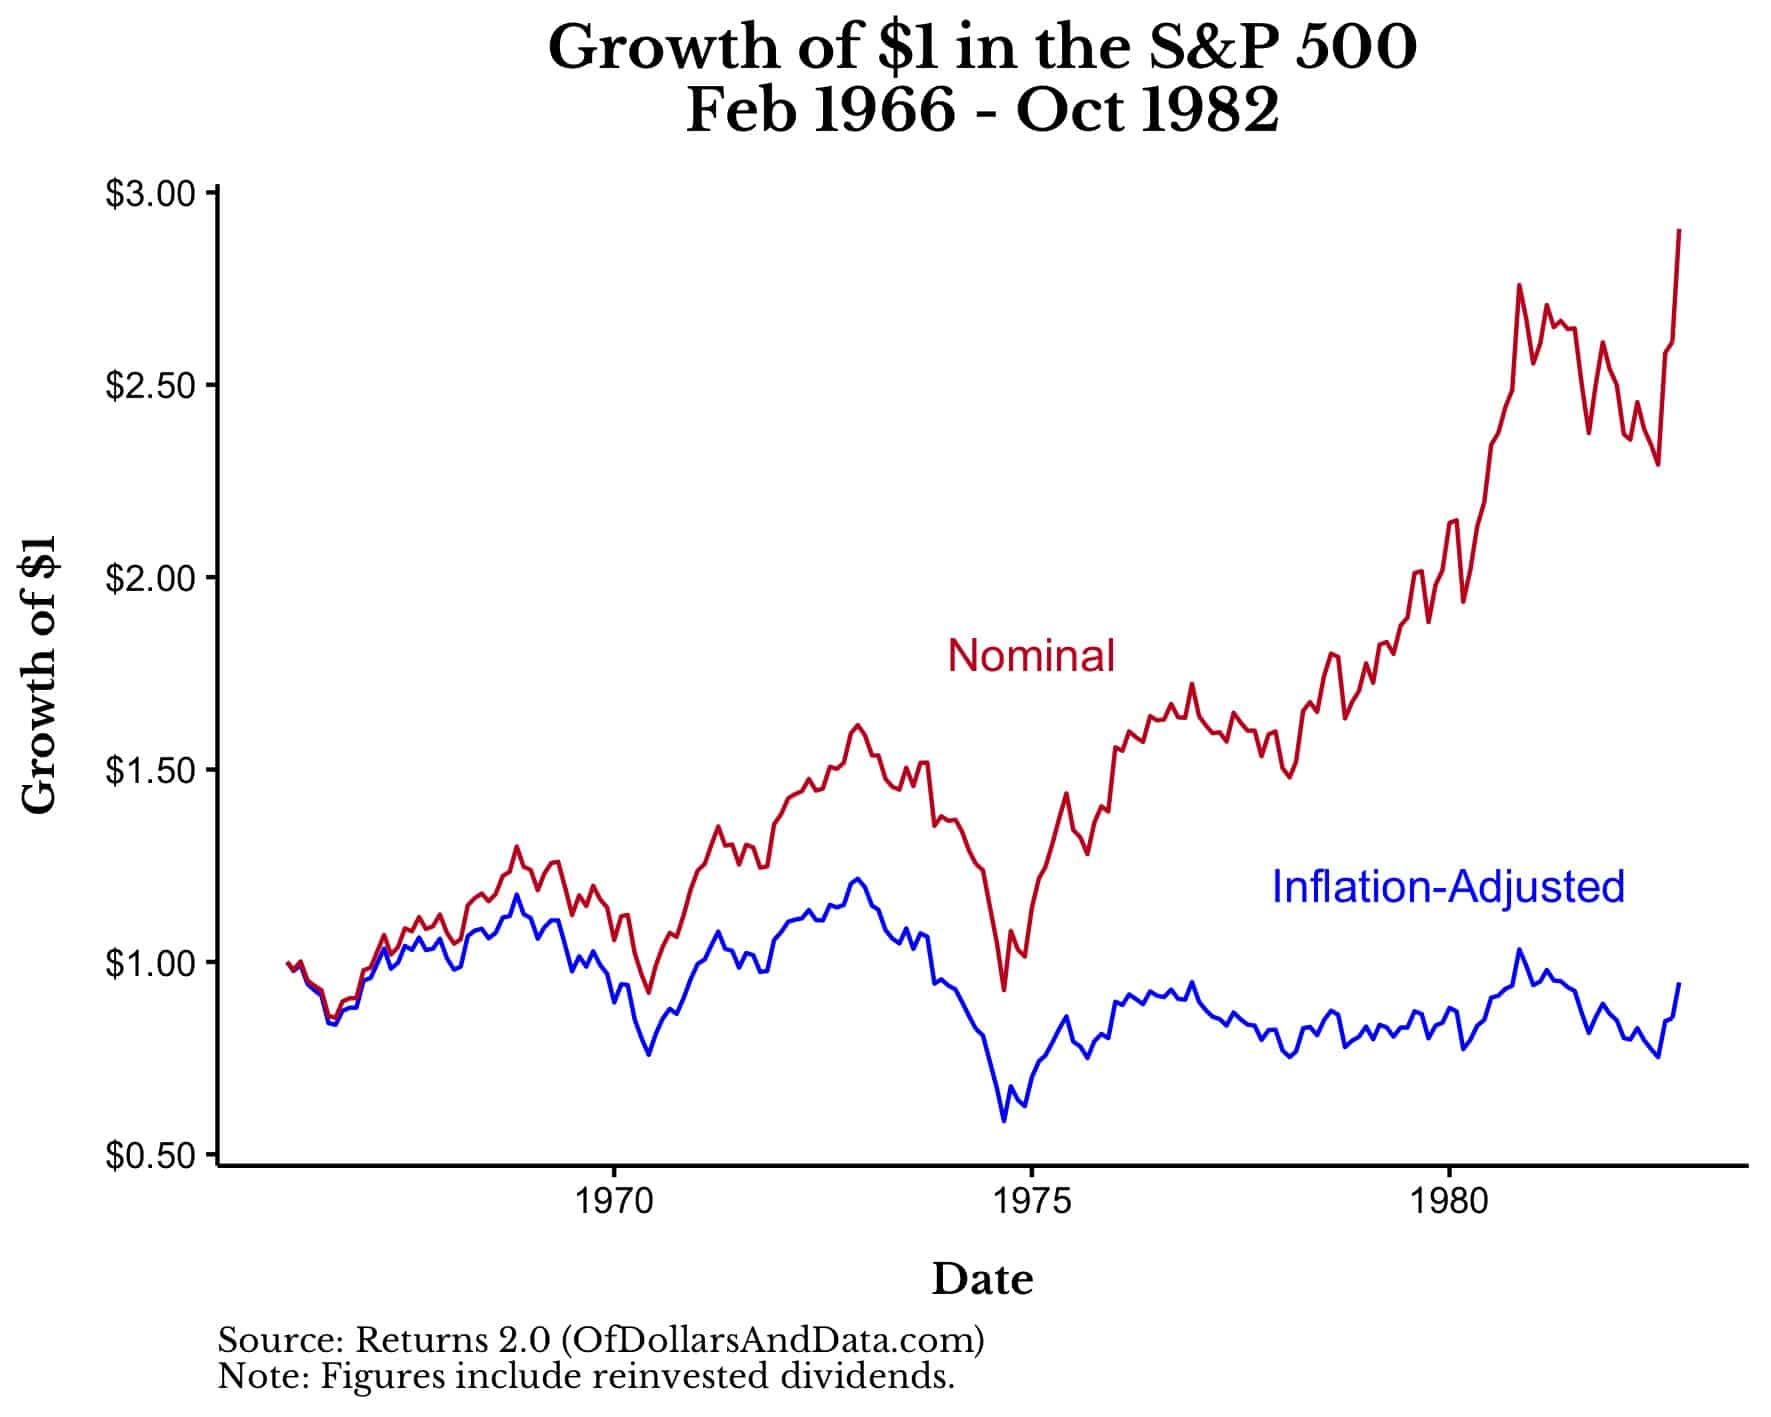
As you can see, $1 invested in the S&P 500 in February 1966 would have become $2.90 by October 1982 in nominal terms, but only $0.95 in real terms.
However, this assumes a one-time investment (i.e. one purchase and then 16 years of waiting). But, no one actually invests like this. Not even most retirees! I pointed out this surprising fact in Ch. 2 of Just Keep Buying:
As the Investments & Wealth Institute reported, “Across all wealth levels, 58 percent of retirees withdraw less than their investments earn, 26 percent withdraw up to the amount the portfolio earns, and 14 percent are drawing down principal.”
This means that 58% of retirees in the U.S. were making additional investments into their portfolios through their reinvested earnings. Even most retirees are dollar cost averaging. Given this, we shouldn’t be analyzing stock market performance by looking at one-time investments, but by looking at investments over time.
How Does DCA Perform During the Worst of Times?
Now that we have identified one of the toughest periods for U.S. stocks, let’s examine how they would have performed if we invested $100 per month over this time period:
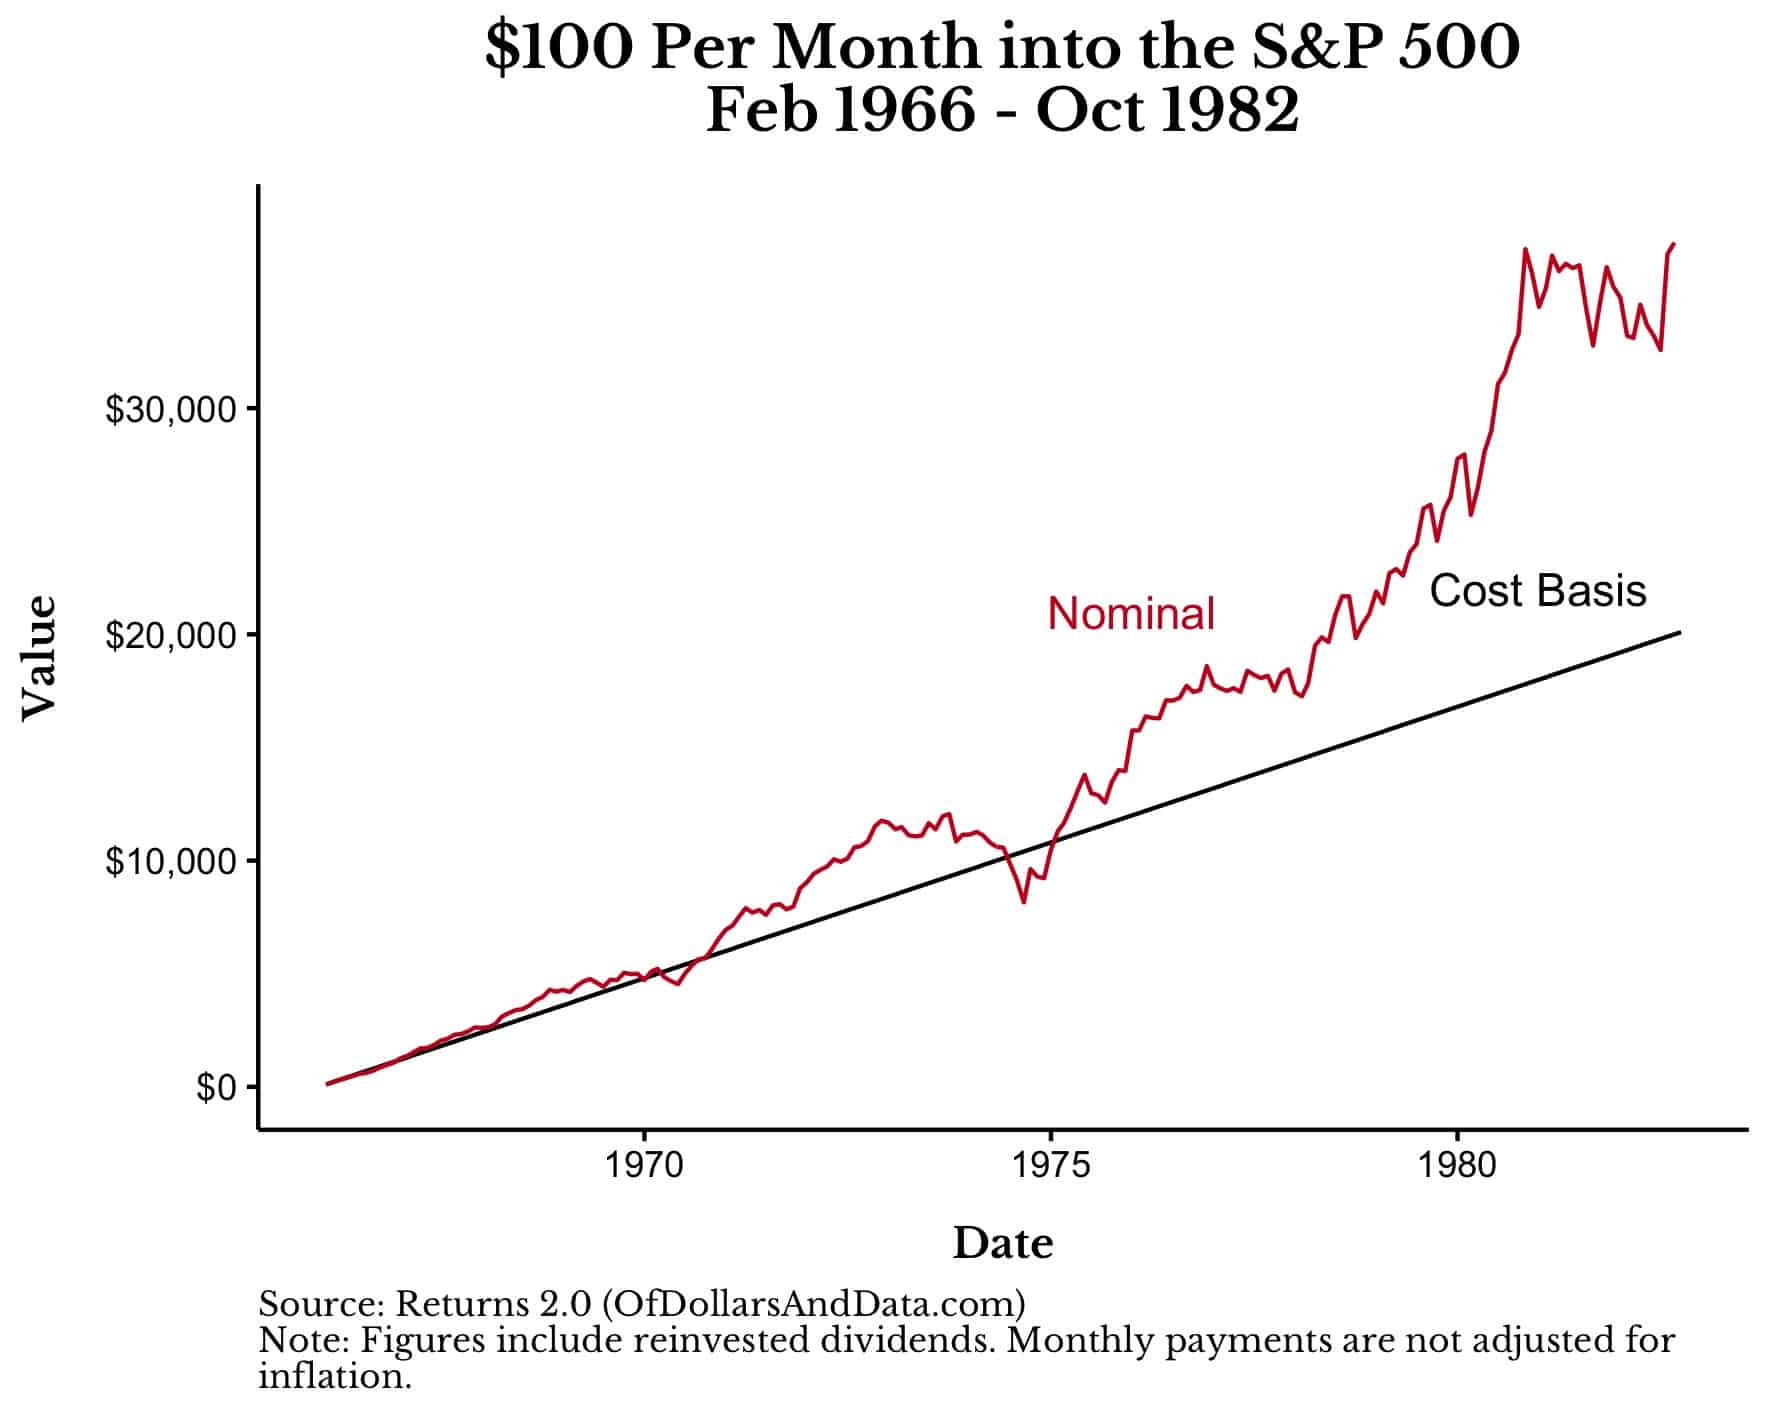
As you can see, an investor buying over time would have turned their $20,100 in investments (201 months * $100) into $41,629 by October 1982. However, this doesn’t adjust for inflation.
After doing so, our $20,100 in investments would have been worth $20,931 (in real terms) by October 1982:
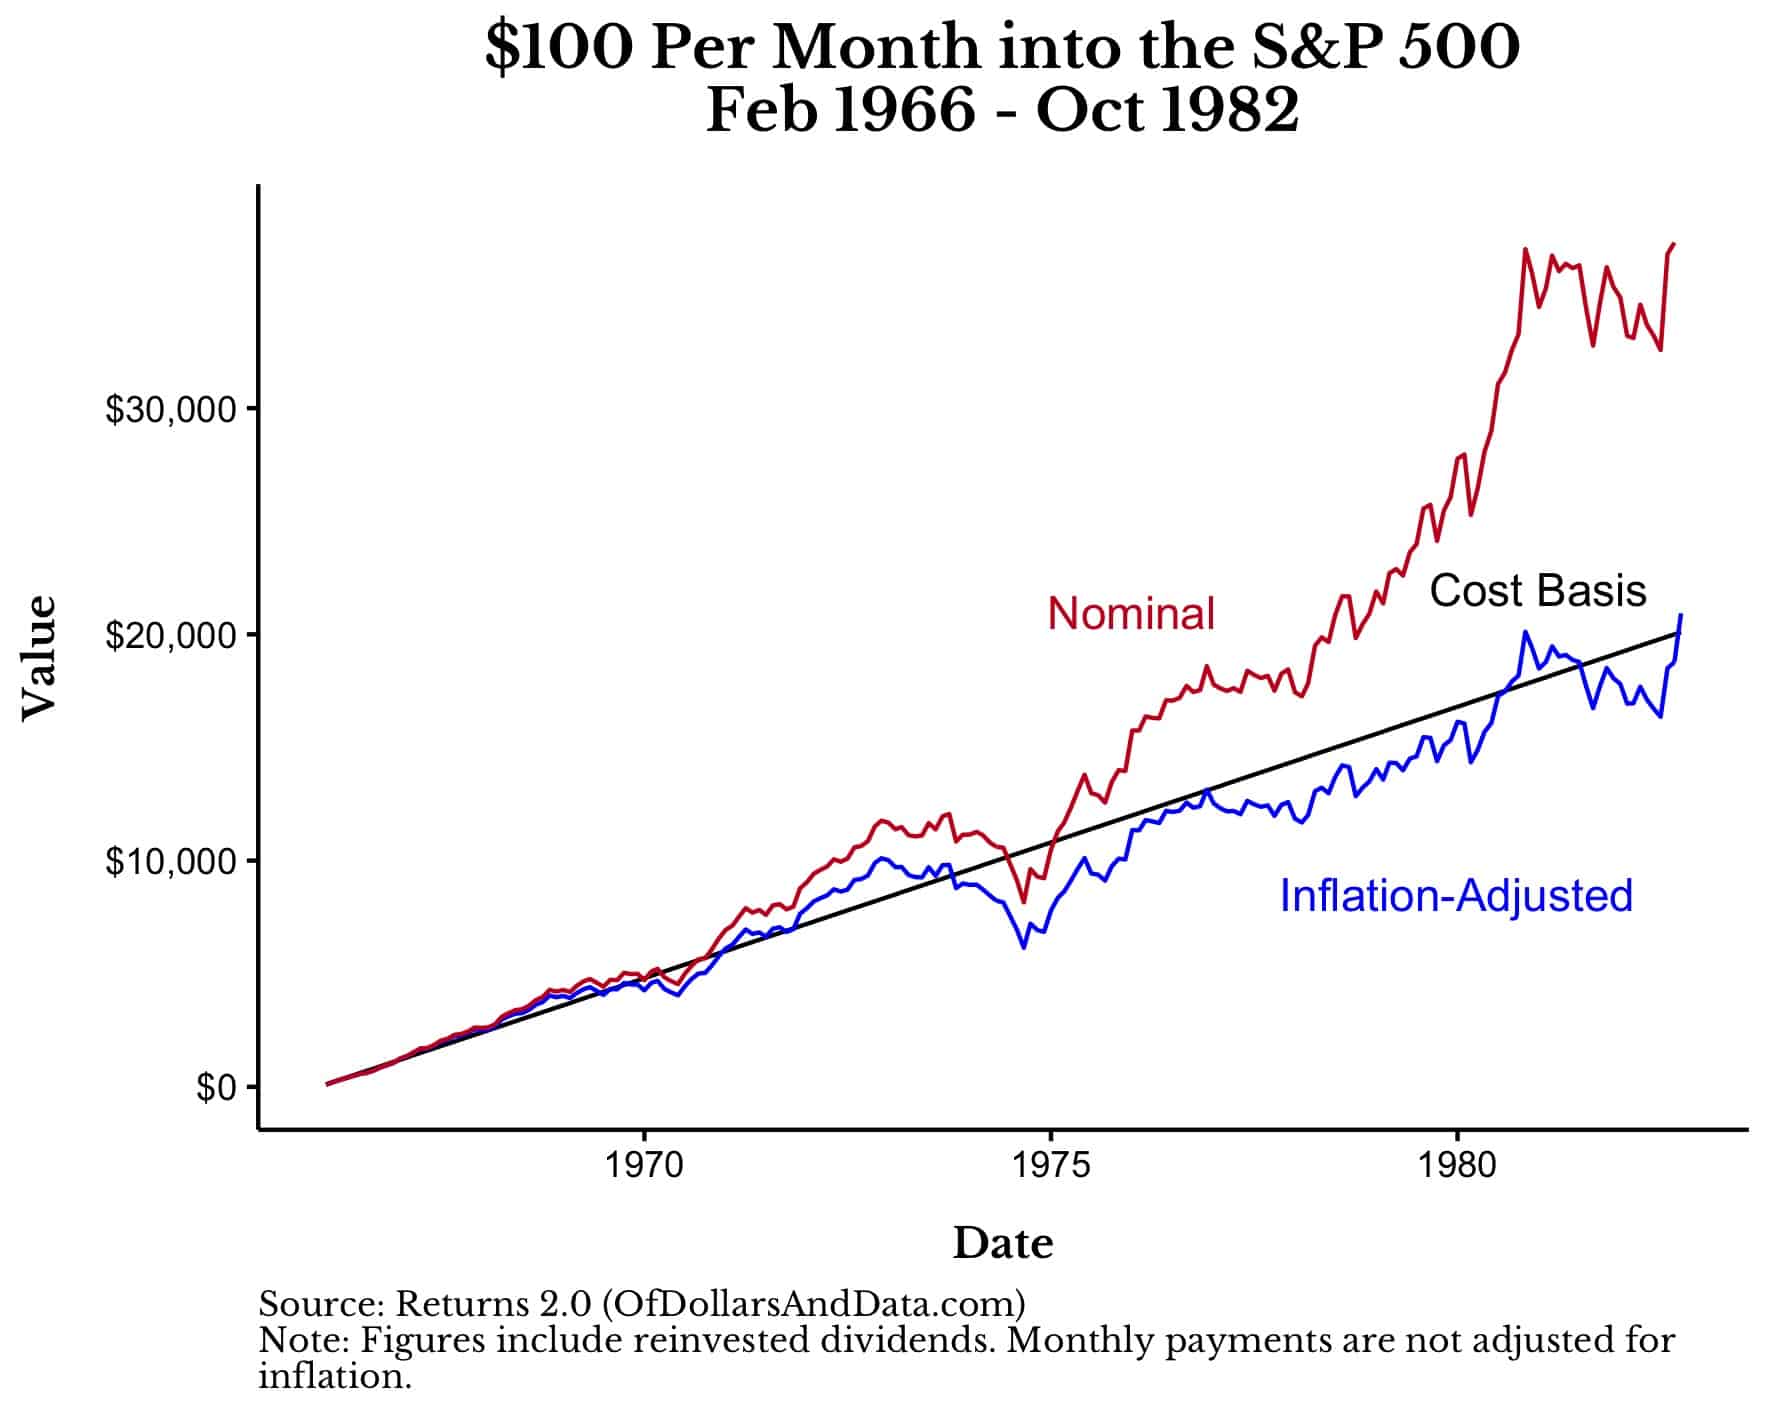
As you can see, buying U.S. stocks over this time period would have kept pace with inflation. Think about that. During one of the darkest periods in U.S. stock market history, an investor who bought every single month at least preserved their purchasing power!
Of course, we don’t only want to preserve our purchasing power. We want to see our wealth grow. But consider the tradeoff here. When things go well for U.S. stocks, you build enormous amounts of wealth. And when they go poorly, you at least preserve your purchasing power. What’s not to like?
Well, the volatility. This raises the question: Would you have been better off had you been invested in a less volatile asset class instead of U.S. stocks over this time period? Let’s see.
What About Cash and U.S. Bonds?
As you probably already know, sitting in cash (and not earning interest) isn’t a great move when inflation is high (as it was throughout most of the 1970s). In fact, if you had saved $100 a month and left it under your mattress from February 1966 to October 1982, your $20,100 in total savings would have only been worth $11,146 (in 1966 dollars) by the end of the time period. That’s a 45% decline in purchasing power due to sitting in cash.
Visually, you can see this (below) by imagining what a $100 payment would have grown to by October 1982 if it had been invested in the S&P 500 or cash. Note that in the chart below, the bars for cash are in front of the bars for the S&P 500 to make it easier to compare their growth over time.
For example, $100 invested in the S&P 500 in February 1966 would have been worth $94.67 by October 1982 (see first blue bar on the far left). However, if that $100 had sat in cash instead, it would have only been worth $32.59 by October 1982 (see first black bar on the far left). Plot this for every month in the data and you get the following image:
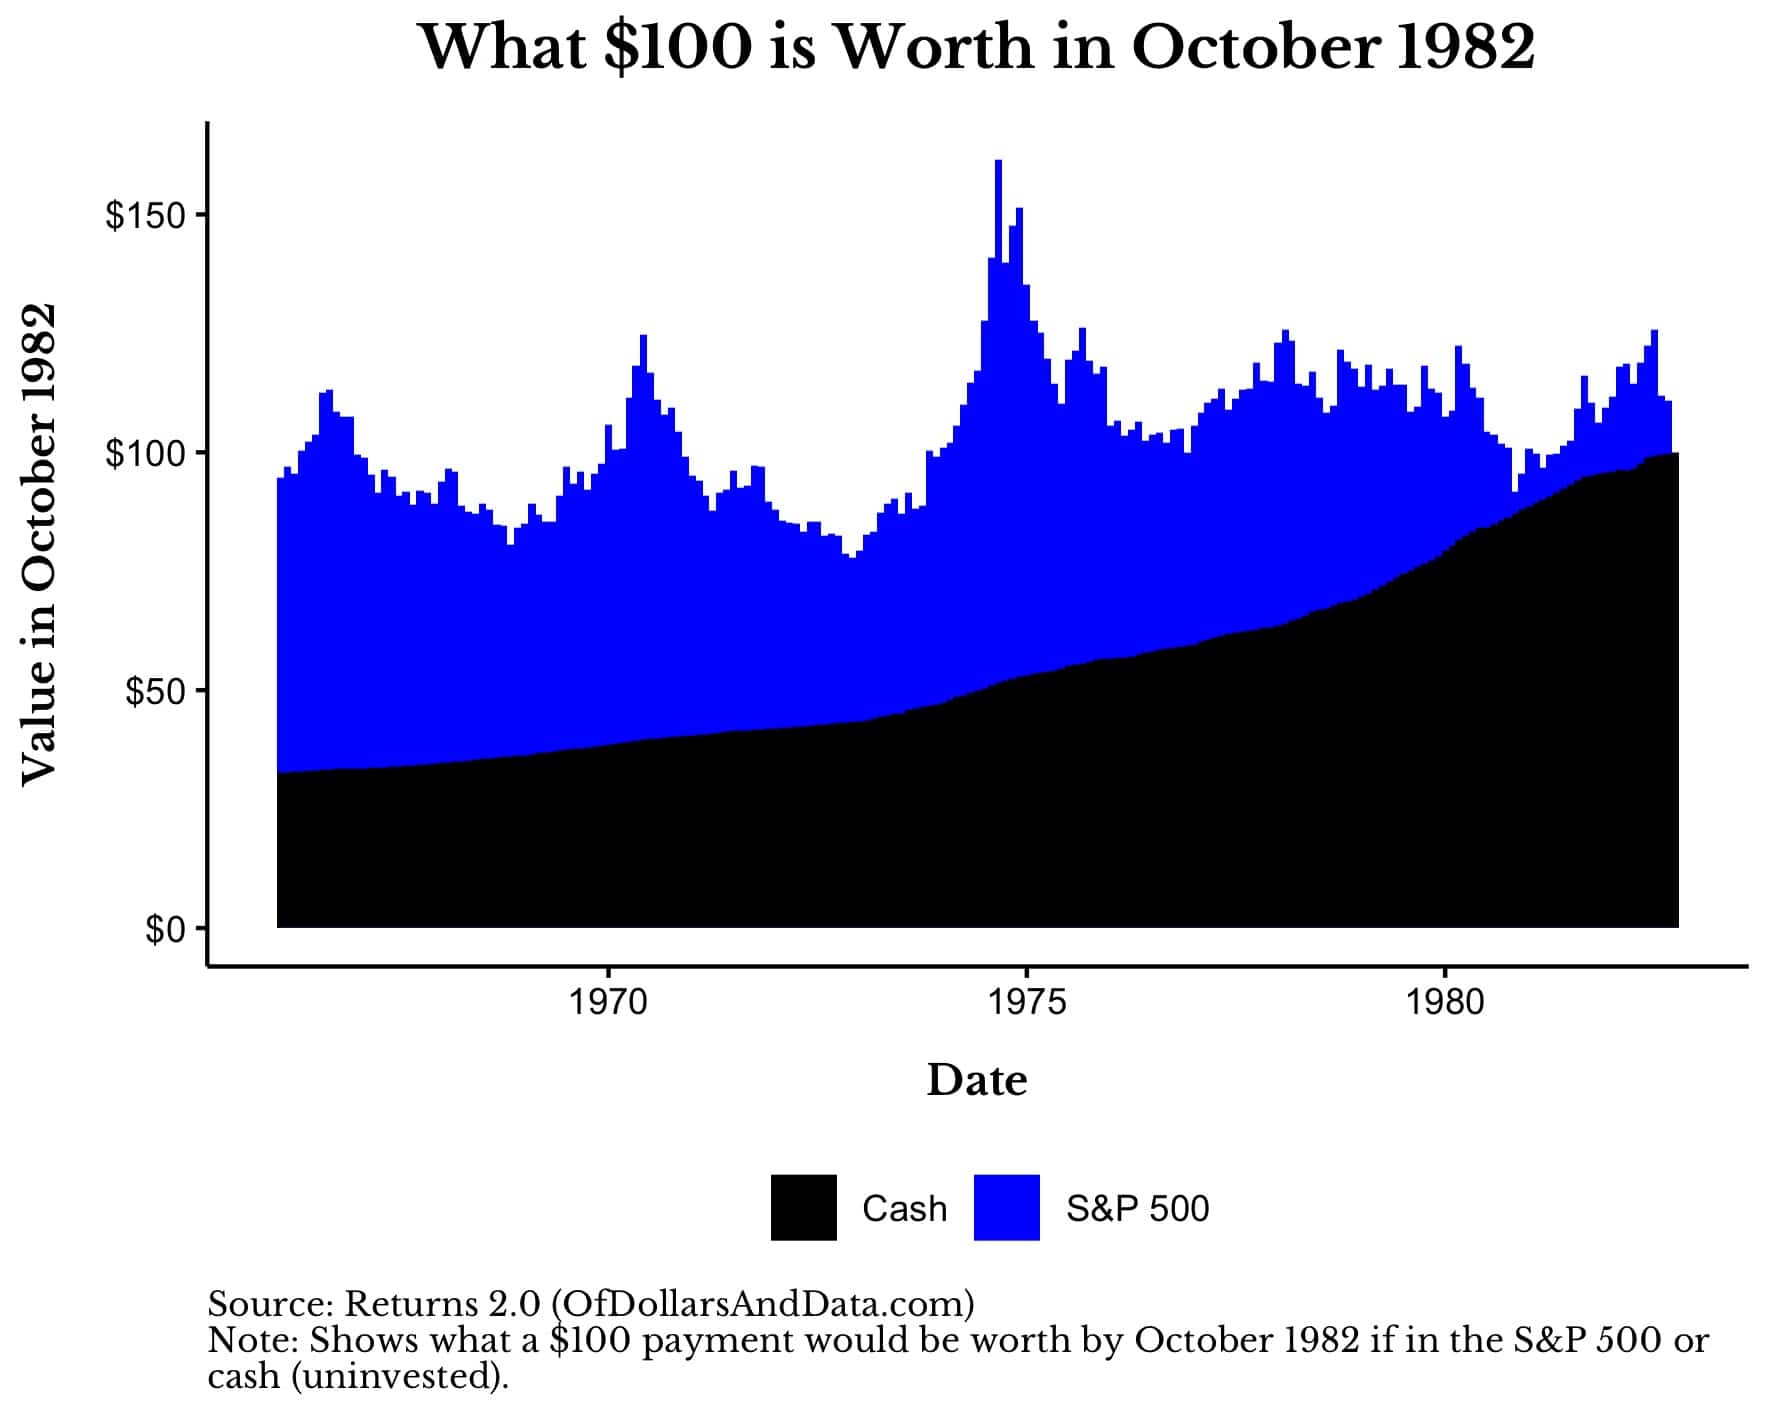
As you can see, in every month pictured, a $100 in cash would have underperformed $100 invested into the S&P 500.
What about U.S. bonds? They basically keep up with U.S. stocks over this time period, however, they experience far less volatility while doing so. You can see this in the chart below which plots a $100 monthly investment into U.S. bonds (i.e. 5-Year U.S. Treasuries) and U.S. stocks (i.e. the S&P 500) over this time period (Note: I kept the same y-axis as prior charts for easier comparability):
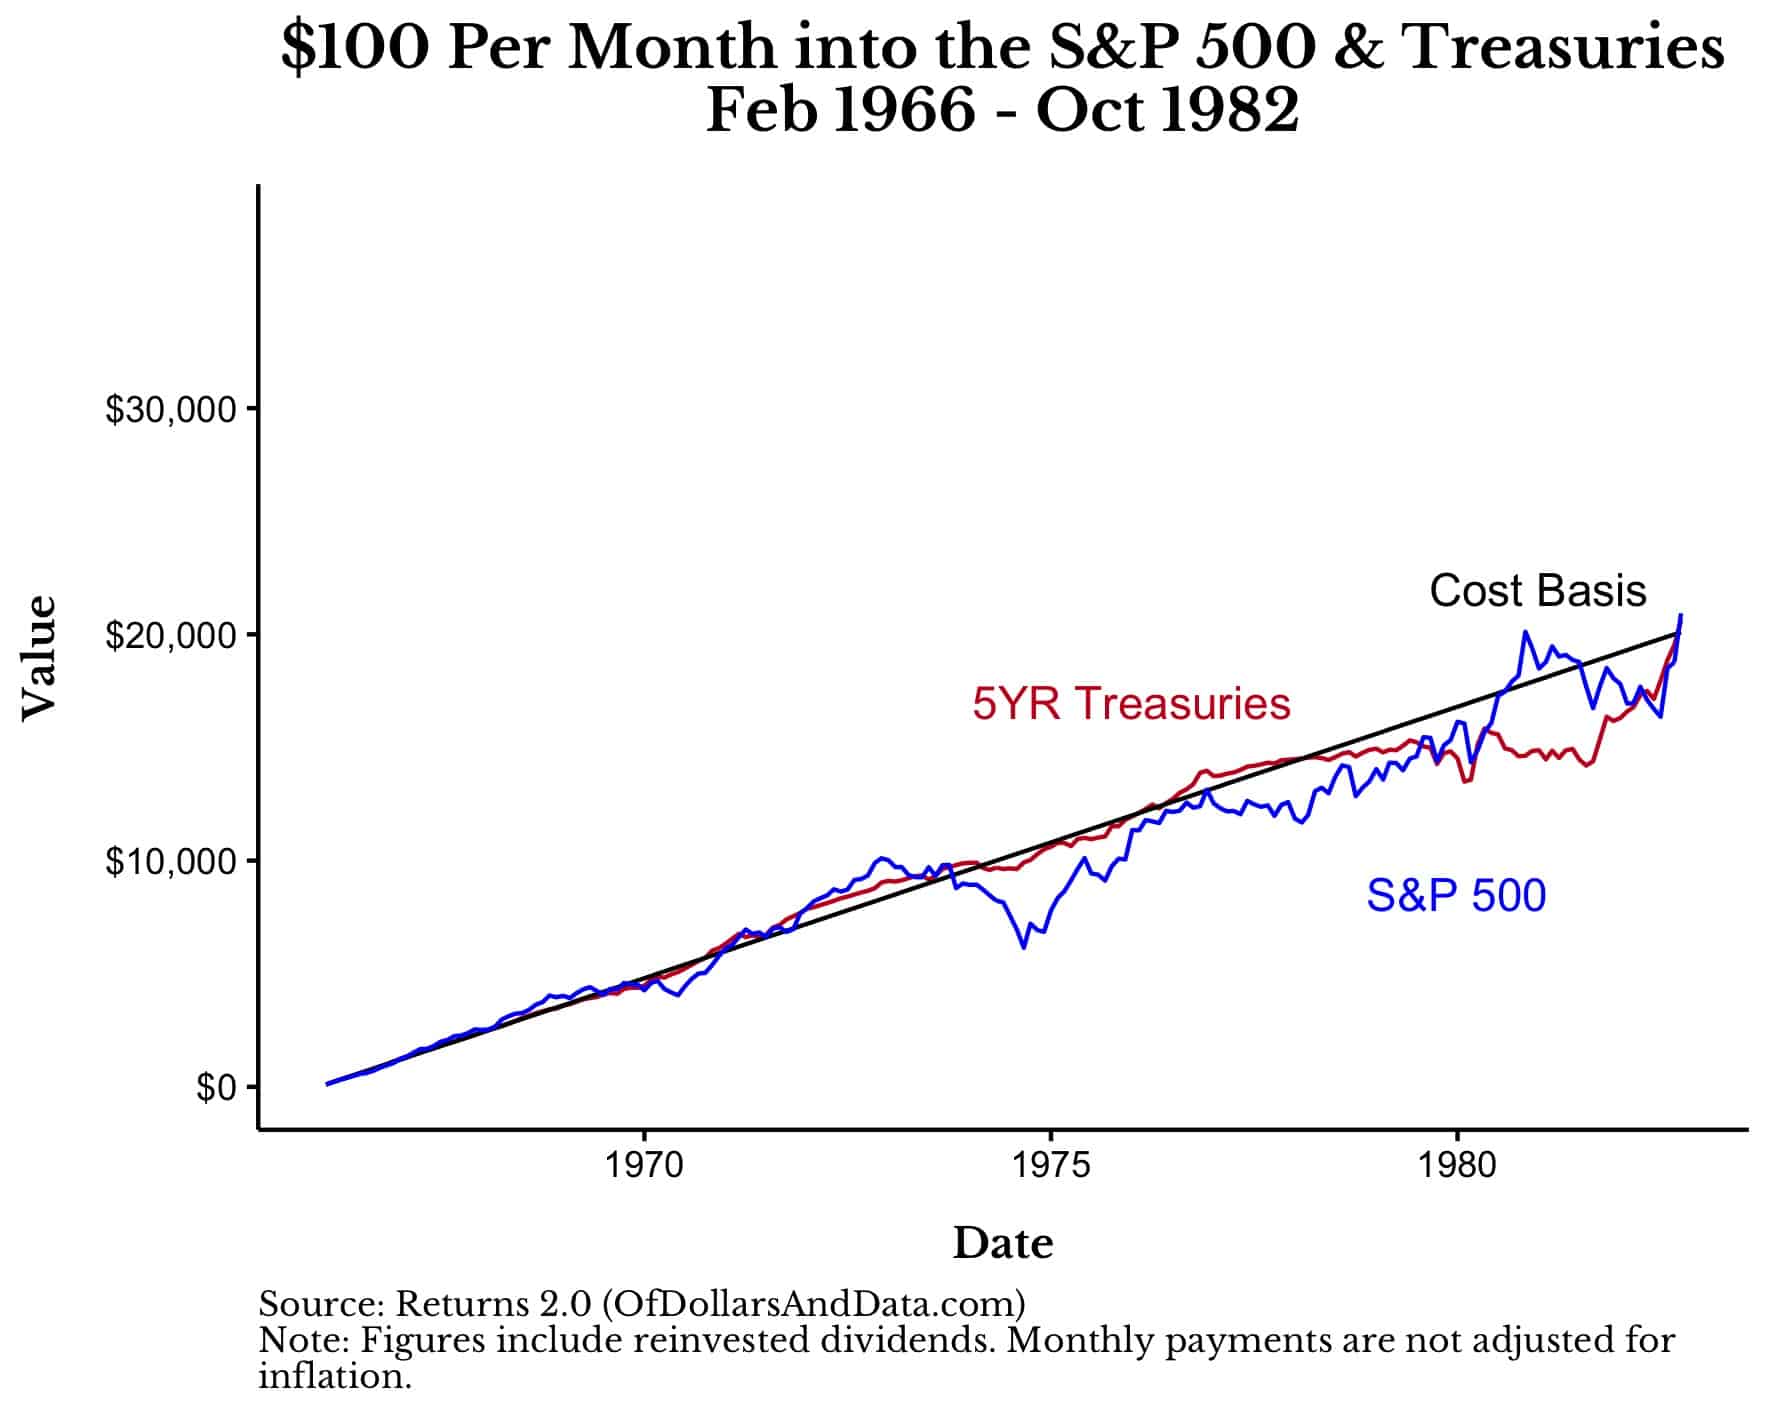
As you can see, owning U.S. bonds (5YR Treasuries) over this time period would have been a much smoother ride than owning U.S. stocks. While this might seem like I am making a case for investing in U.S. bonds, it’s actually the opposite.
Because, despite having similar performance with lower volatility, this is one of the few periods in history where U.S. bonds kept pace with U.S. stocks over such a long time. Most of the time the opposite is true. As I stated here:
If you had picked a random month to start buying U.S. stocks and kept buying for the rest of the decade, there is a 83% chance that you would have beaten 5-Year Treasuries.
Since U.S. bonds tend to underperform U.S. stocks (and by a lot), the fact that they kept pace with U.S. stocks from February 1966 to October 1982 isn’t much of a selling point for them.
However, it is a selling point for buying U.S. stocks over time. Because if U.S. stocks can keep up with (and sometimes exceed) the performance of less volatile assets during their worst times, think about how well they do during their best times.
The Bottom Line
Even throughout the most difficult periods in market history, dollar cost averaging into U.S. stocks has preserved purchasing power over time. Though this point might seem trivial to some, it is anything but. Because the record of history is one of the most powerful tools we have to combat our emotions when markets are in free fall. What other choice do you have?
When there is blood in the streets, how do you keep yourself calm? When you see your portfolio decline by 20, 30, 40% and beyond, where do you run to? God? A friend? A family member?
I run to historical evidence. I rely on history. Of course, the future won’t be exactly like the past, but it will almost certainly rhyme. And in those rhymes, I find peace. In those rhymes, I sleep easy.
So you can claim that Just Keep Buying is simply dollar-cost averaging. But it is far more. It’s the philosophy through which dollar cost averaging operates. It’s the data-driven foundation under which every one of my financial beliefs is built upon. Without this foundation, I would be lost. Without this evidence-based bedrock, I would panic at the first sign of trouble.
But I don’t. Because I’ve been saying the same thing for over five years now. I’ve been trying to get the message to you. The question is: will you listen?
Thank you for reading and I hope you all had a great 4th of July weekend!
Lastly, special thanks to Jason Zweig who I collaborated with for the WSJ on a similar analysis he published a few weeks ago.
If you liked this post, consider signing up for my newsletter.
This is post 302. Any code I have related to this post can be found here with the same numbering: https://github.com/nmaggiulli/of-dollars-and-data

