The stock market is a crucial indicator of economic activity and is closely watched by investors, economists, and policymakers around the globe. Unfortunately, when we typically discuss the stock market, we tend to focus on the United States, which comprises 58% of world market capitalization. I am as guilty of this as anyone.
However, after getting so many requests to analyze international stocks, I’ve decided to right my wrongs and examine the world beyond our borders. In this comprehensive guide, I’ll review the stock market returns for nine countries from 1993 to 2022: Canada, the UK, India, Singapore, Germany, Australia, Italy, Poland, and the U.S. (as a benchmark).
I’ll explore the risks, rewards, and strategies involved in investing in these markets, empowering you to make better decisions about your portfolio. So let’s get going and discover if international stocks are right for you.
How Much Growth Has There Been in International Stocks?
To start, let’s provide a high level overview of how much growth international stocks have experienced from 1993 to 2022. If you had invested $1 into each of these nine equity markets (and reinvested the dividends), here is how you would’ve performed:
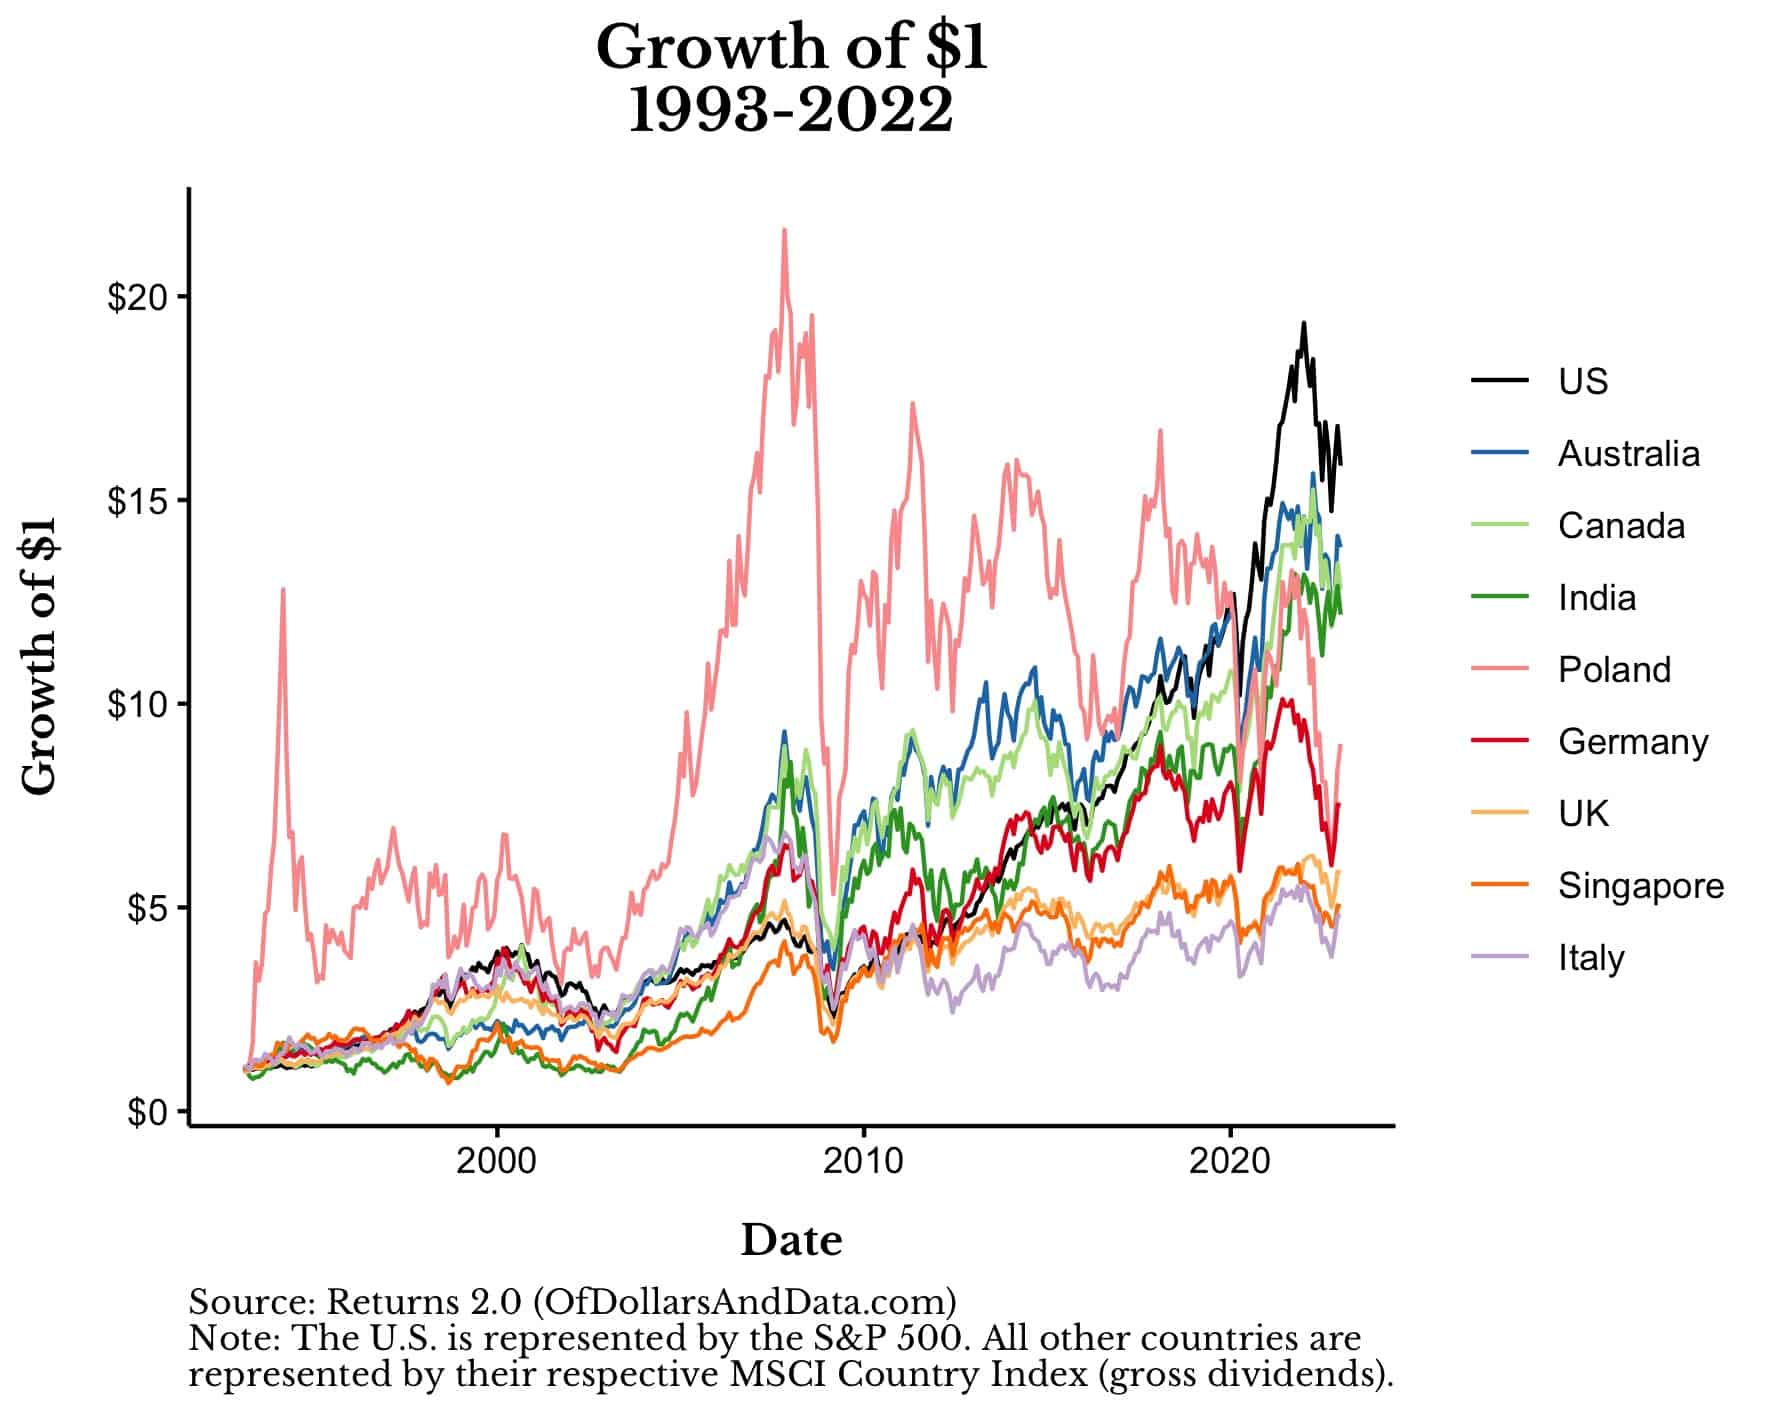
The first thing you will notice is that there is a wide range of outcomes across these nine markets. Some showed extreme volatility (Poland), some produced weaker growth (Italy, Singapore), and some produced fantastic growth (US, Australia).
To put this growth in perspective, below is a table containing the nominal and real (inflation-adjusted) annualized returns for each of these equity markets from 1993 to 2022:
| Country | Annualized Return | Real Annualized Return |
|---|---|---|
| US | 9.6% | 7% |
| Australia | 9.2% | 6.5% |
| Canada | 8.9% | 6.2% |
| India | 8.7% | 6.1% |
| Poland | 7.6% | 5% |
| Germany | 7% | 4.4% |
| UK | 6.1% | 3.5% |
| Singapore | 5.5% | 3% |
| Italy | 5.4% | 2.8% |
As you can see, the variation in returns between the best performing and worst performing equity markets is around 4% per year. This is sizable, especially when compounded over 30 years.
However, it is also important to note that even the countries with the least growth over this period (Italy, Singapore, etc.) still provided inflation adjusted returns of around 3% per year. That’s not a lot when you consider the risks involved, but I’d rather have 3% growth in my purchasing power than not have it.
Unfortunately, even having 3% growth per year isn’t a realistic assumption because equity returns are rarely consistent year to year. For example, if we subset the data to start from the bottom of the Great Financial Crisis (March 2009), you can see that some markets performed well while others struggled:
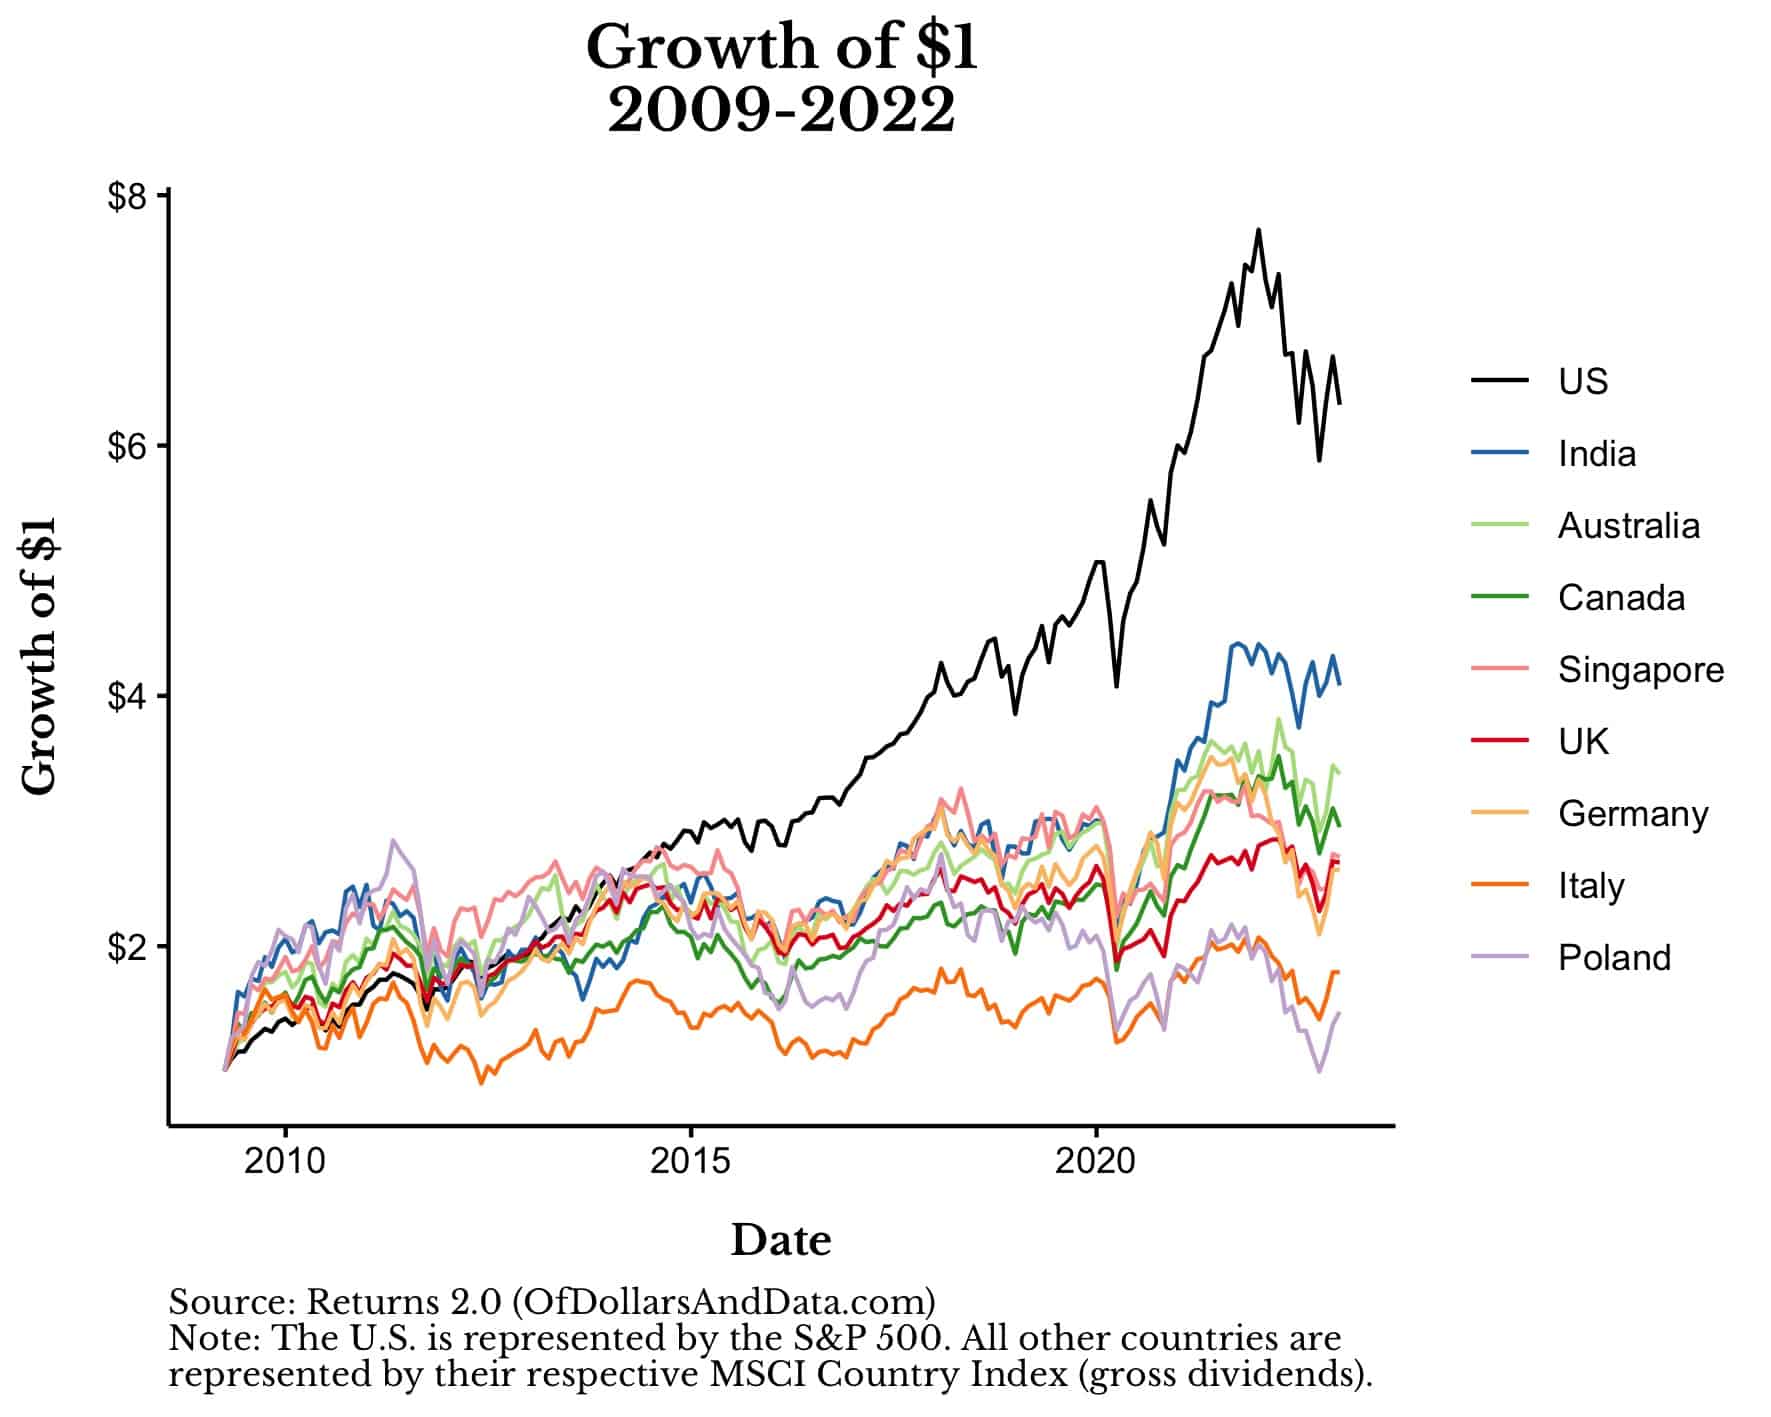
In particular, most of the outperformance of the U.S. equity market (over other equity markets) started in 2015. But this hasn’t always been the case.
If we turn the clocks back to the decade prior to the Great Financial Crisis (i.e. January 2000 to March 2009), the conclusion is the exact opposite. The U.S. underperformed every other equity market by a significant margin:
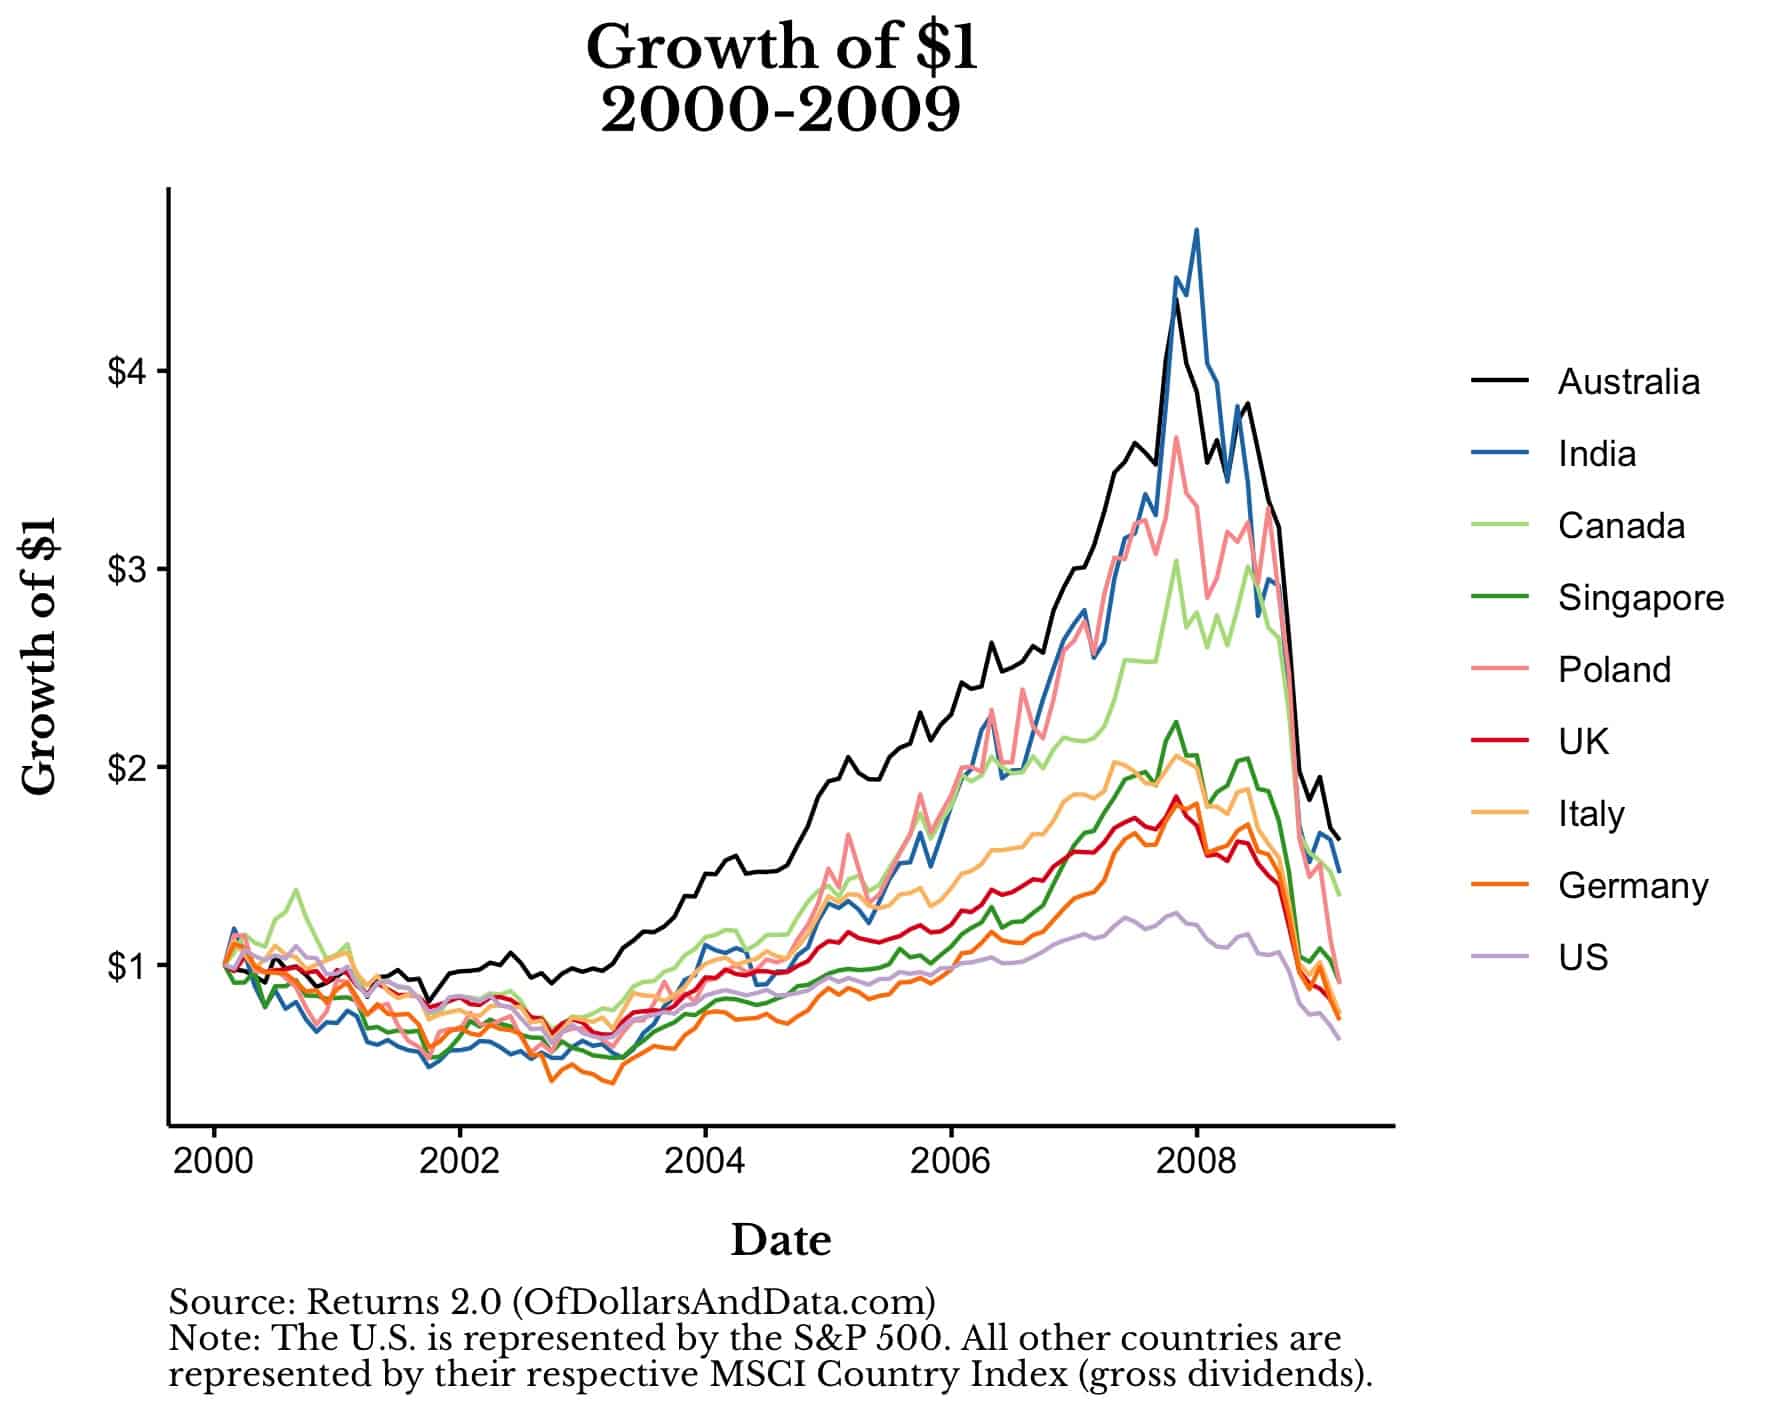
This illustrates the ebb and flow of equity performance over time and how international stocks can benefit a portfolio.
Because of this ebb and flow, we can’t just focus on growth. We have to care about risk as well. For this, we turn to our next section.
Which Markets Have Been the Riskiest?
Though there are many ways to measure risk, one of my favorites is the total decline from all-time highs (i.e. drawdowns). In other words, if you had invested at the most recent peak, how much would you have lost (in percentage terms) through today?
Below is a plot showing the drawdowns in each of these markets from 1993 to 2022:
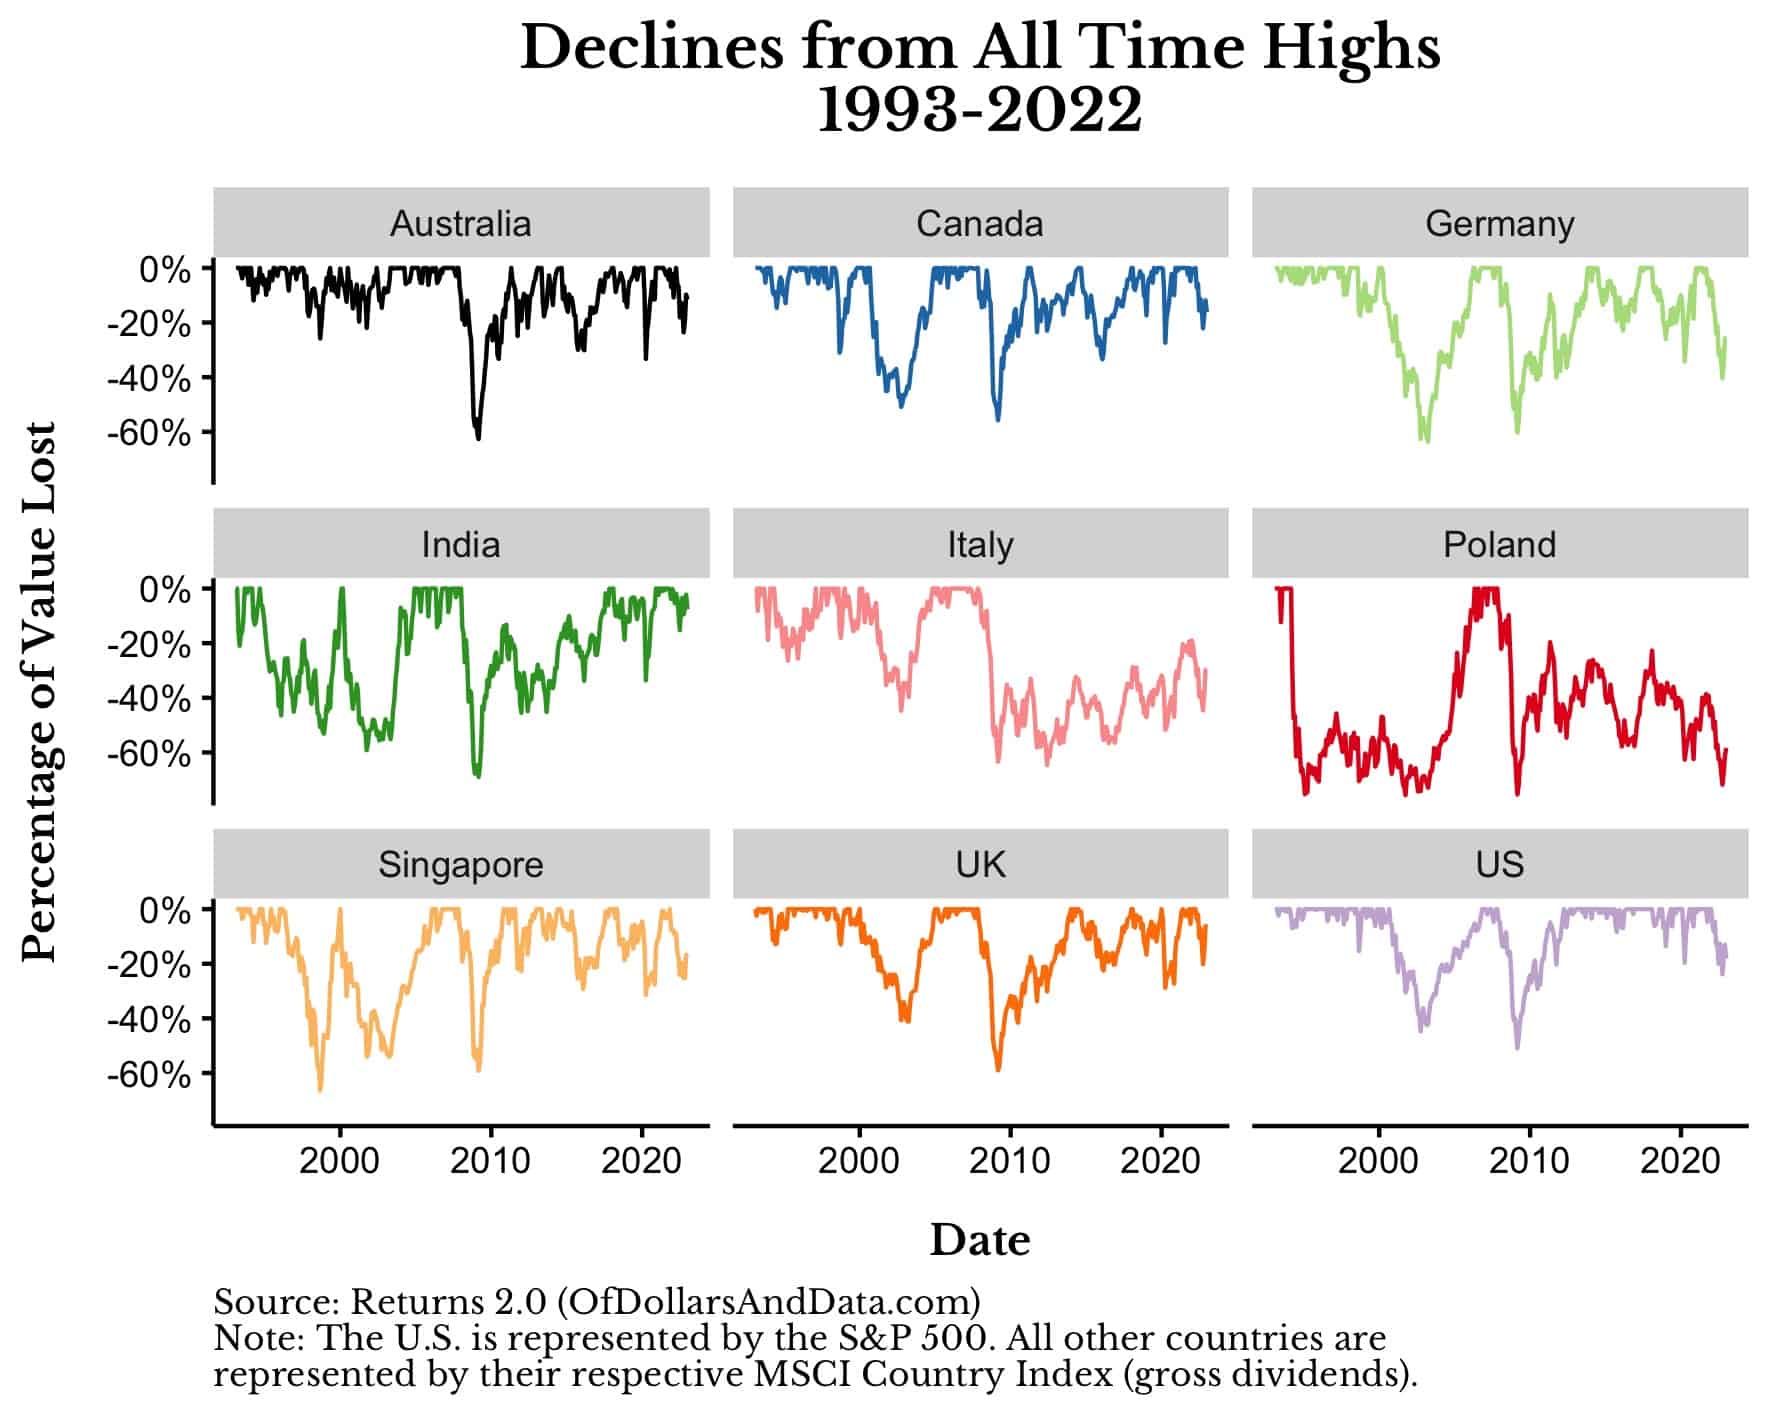
What you will notice is the difference in magnitude and length of various drawdowns across these equity markets. Some countries are still in a significant drawdown from 2008 (Italy, Poland), others are near new all-time highs (India), and the rest are somewhere in between.
What’s also interesting to note is that not all markets react to the same macroeconomic news in the same way. For example, Australia didn’t have any sort of decline following the implosion of the DotCom Bubble in the early 2000s, though most other equity markets did.
In fact, if we overlay all of these drawdowns on top of each other, we can see that 2008 had the most uniform impact across all the equity markets in our sample:
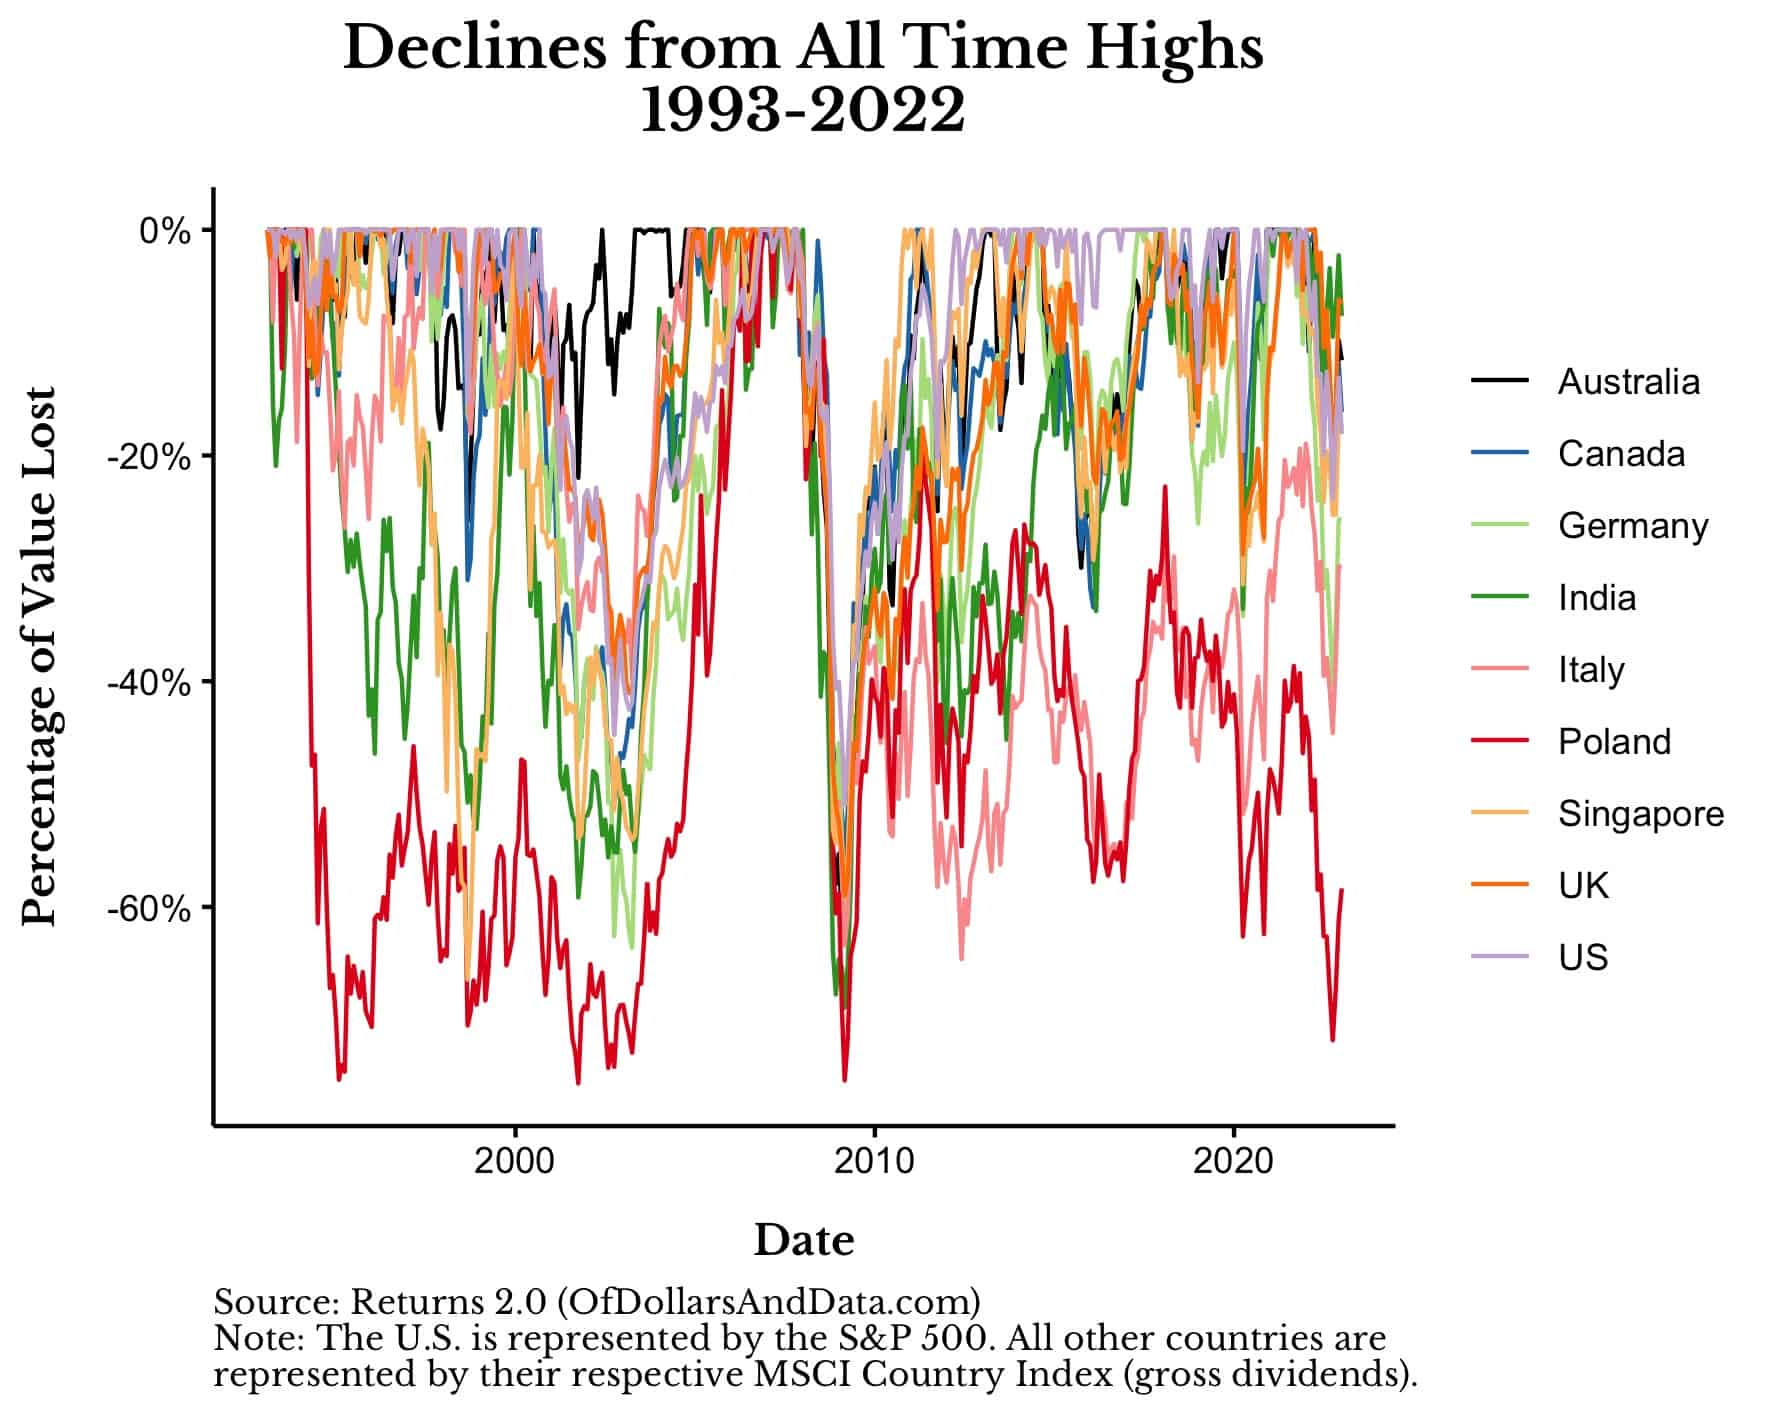
This was the perfect example of “correlations going to 1.”
But we can only learn so much from lines on a chart. Sometimes we have to quantify risk in order to understand it. I’ve done this in the table below which shows the average calendar year return, the standard deviation of those returns, and the Sharpe ratio for these equity markets.
As a reminder, the Sharpe ratio shows the risk-adjusted returns of an asset class. So, the higher the Sharpe ratio, the more return that asset provides relative to its level of risk.
Risk Characteristics of Select Global Equity Markets
| Country | Average Return | Standard Deviation | Sharpe Ratio |
|---|---|---|---|
| US | 11.3% | 18.1% | 0.50 |
| Australia | 11.6% | 22.8% | 0.41 |
| Canada | 11.5% | 23.9% | 0.39 |
| India | 15% | 37.6% | 0.34 |
| Germany | 9.9% | 24.6% | 0.31 |
| UK | 8% | 19.1% | 0.30 |
| Italy | 8% | 22.9% | 0.25 |
| Singapore | 9.9% | 32.6% | 0.23 |
| Poland | 30.2% | 140.3% | 0.20 |
As you can see, on top of having the highest returns over this time period (from the table in the prior section), the U.S. also had the highest Sharpe ratio as well. Some countries have all the luck. Others, not as much.
[Author’s note: The average return shown in the table above is an arithmetic average. As a result, it won’t accurately measure long-term growth as well as the annualized returns (geometric average) shown in the table from the “How Much Growth Has There Been in International Stocks?” section.
To illustrate why this is true, imagine you received a +10% return followed by a -10% return. On average, your arithmetic return is 0%. But, if you do the math yourself, you will soon realize that gaining 10% then losing 10% means that you actually lost money overall.]
If you look at the standard deviation column in the table above, you will see that most countries’ annual returns have a standard deviation in the 20%-30% range. However, there is one notable exception—Poland.
What happened with Poland? As James K. Glassman notes in this article from 2003:
Polish stocks themselves trade on the Warsaw exchange, which was founded in 1817, disappeared with wars and communism and was resurrected in 1991.
Following the resurrection of its stock market in the early 1990s, Poland went through a series of asset bubbles, culminating in its largest boom and bust ever in 2008.
However, despite having a decline in asset prices, Poland was the only European country that avoided the 2007-2009 recession. This illustrates how the stock market isn’t the economy and how risk in one area doesn’t always translate into risk in another.
Now that we’ve done a high level overview of how risky these various equity markets can be, let’s examine why there might be more to the story than what we’ve covered so far.
Does Buying Over Time Change the Story?
So far all the performance I have shown here is based on a single investment into one of the equity markets we’ve examined. However, as I have mentioned many times before, very few investors invest like this. Most people are accumulating assets over time.
Therefore, if we want to understand how a typical investor would have fared in these equity markets, we should analyze how they would have performed by investing over time as well.
I’ve done this in the plot below which shows how $833 invested per month ($10,000 per year) would have done over the 30-year period from 1993-2022 (for each of our nine equity markets). Note that the plot shows the cumulative contributions (i.e. cost basis) over time (in black) and the market value of your portfolio (in green) for each country:
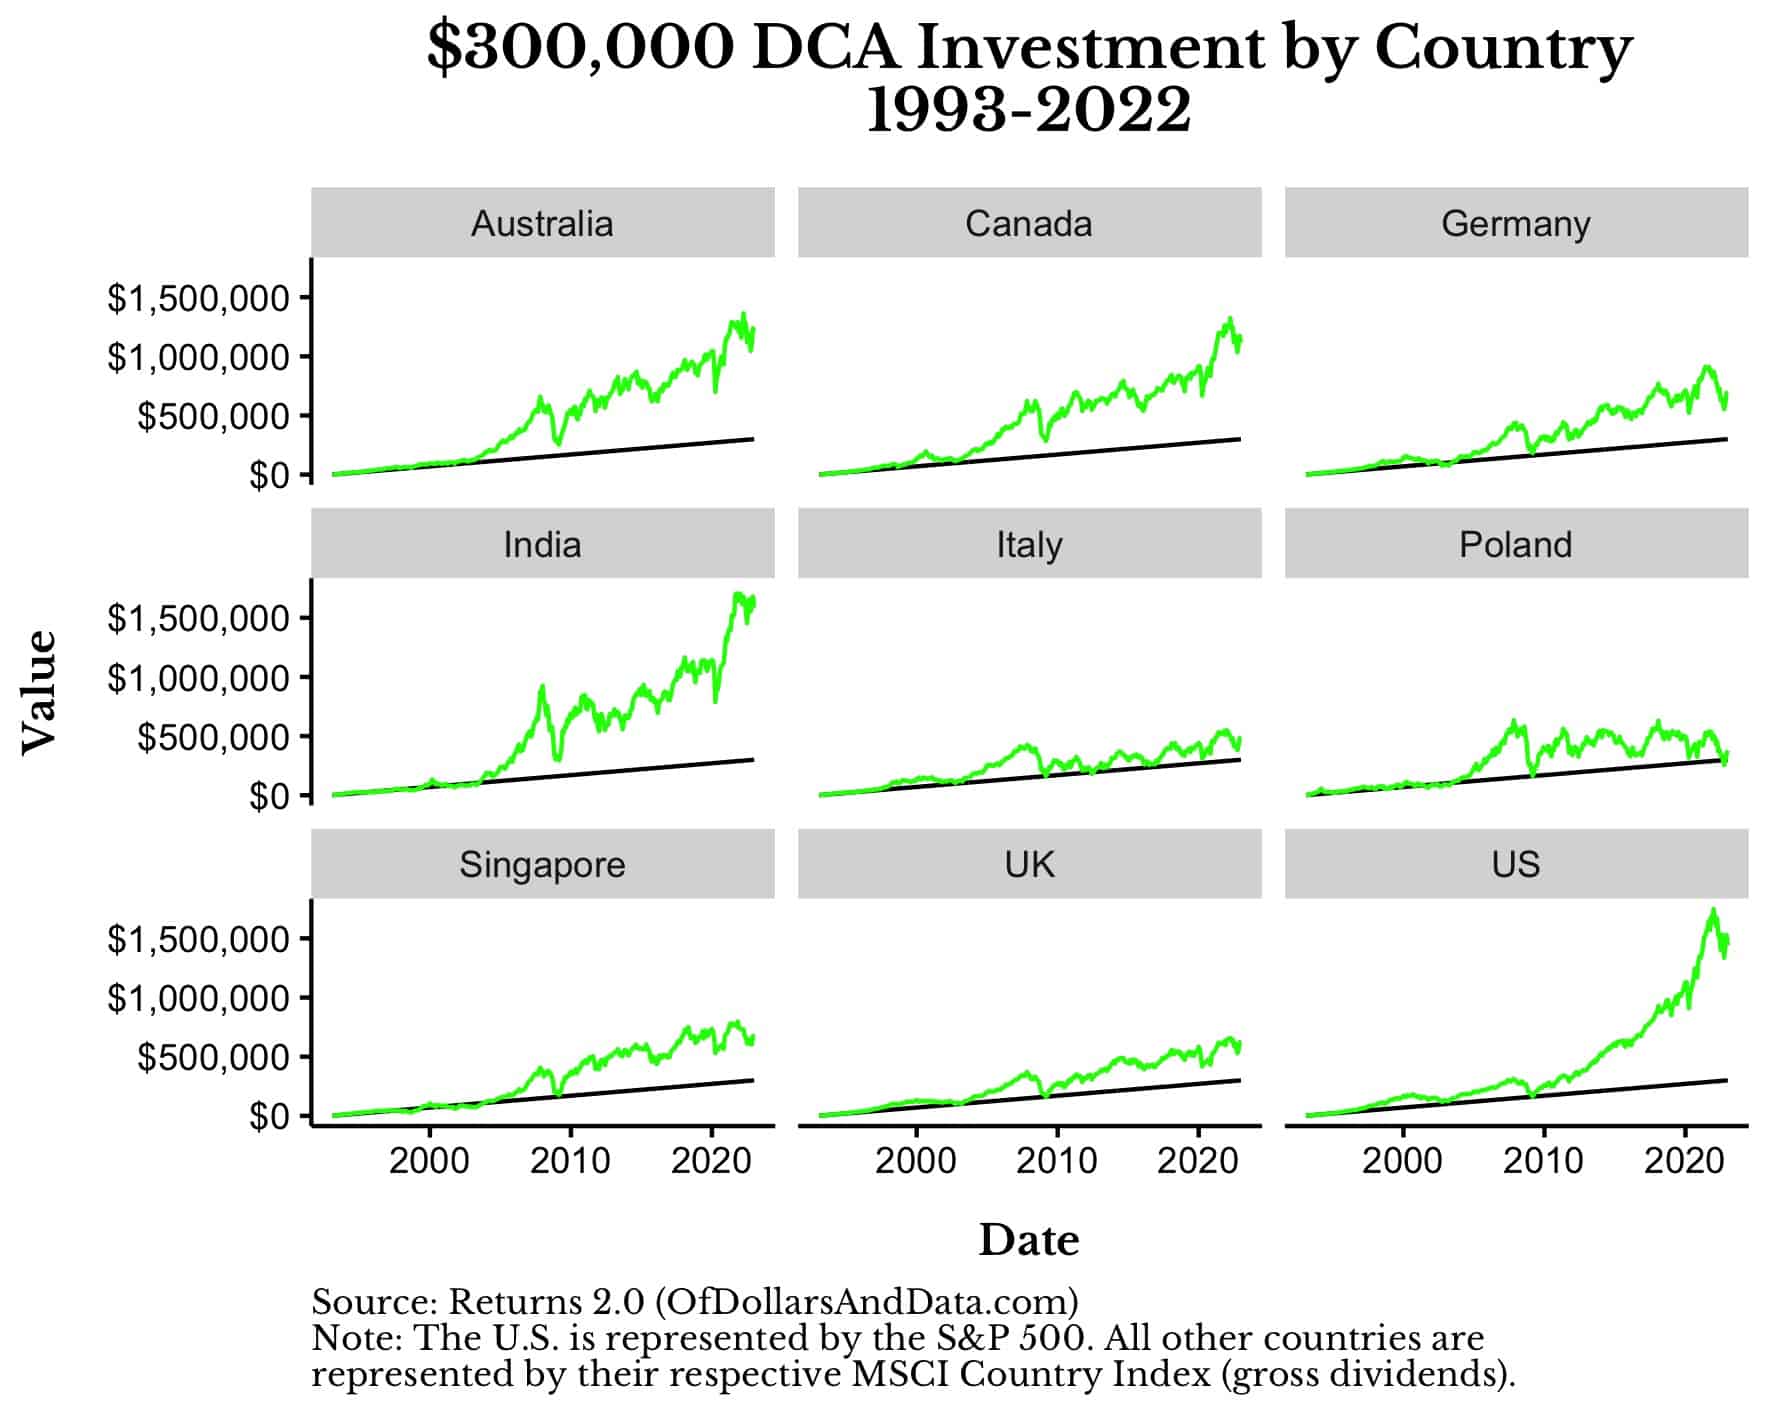
When I look at this there are two things I notice.
First, someone buying over time into the Indian stock market would have outperformed someone buying over time into the U.S. stock market. To be exact, the $300,000 total investment into the Indian stock market would have been worth $1.59M by December 2022 compared to only $1.44M for the U.S. stock market.
Second, every equity market (even Poland) outperformed sitting in cash. You can see this since the green line (portfolio value) is above the black line (cost basis) in every plot above. Even if we adjust our contributions for inflation, every country except Poland would have grown our purchasing power by December 2022.
To be precise, if every monthly purchase we made from 1993-2022 kept pace with inflation, then our $300,000 in total contributions would be worth $445,000 by December 2022. Thankfully, every country except Poland had a nominal portfolio value above $445,000 by the end of our time period.
This illustrates the power of equity markets to retain and, typically, grow your purchasing power over time. As investors, this is ultimately what matters.
Now that we have examined the performance of international stocks when buying over time, let’s look at some of the ways in which you can invest in international equity markets.
How Can You Invest in International Stocks?
When it comes to investing in international stocks, there are basically four ways to do so:
- Exchange-Traded Funds (ETFs) and Mutual Funds: ETFs and Mutual Funds provides a diversified and an easily accessible approach for investors. Both investment vehicles pool the funds of many investors to purchase a broad portfolio of international stocks.
- Pros:
- Broad diversification across various countries and sectors
- Professional management (in the case of mutual funds)
- Generally lower fees compared to direct stock purchases
- Cons:
- Limited control over individual stock selection
- Management fees for mutual funds can be higher than other options
- Pros:
- American Depository Receipts (ADRs): ADRs offer a convenient way to invest in foreign companies without directly trading on foreign exchanges. ADRs are negotiable certificates issued by a U.S. depositary bank that represent a specific number of shares in a foreign company’s stock.
- Pros:
- Easy access to foreign companies without currency conversions or foreign trading regulations
- Traded on U.S. exchanges, quoted in U.S. dollars, and pay dividends in U.S. dollars.
- Cons:
- May not fully represent the performance of the underlying foreign stock
- Limited to foreign companies with ADRs listed on U.S. exchanges. Consider using Global Depository Receipts (GDRs) offered through international exchanges (such as the London Stock Exchange) if you want access to foreign companies not available through ADRs.
- Pros:
- Foreign Ordinaries:Foreign ordinaries are shares of non-U.S. companies that trade on foreign stock exchanges and can also be traded in the U.S. over-the-counter (OTC) market. They are called “ordinaries” because they are the most common type of shares issued by foreign companies. To trade foreign ordinaries, investors need access to a broker that offers OTC trading.
- Pros:
- Access to a wider range of international stocks not listed as ADRs
- Potential for higher returns with superior stock selection
- Exposure to foreign markets and industries that might be underrepresented in ADRs and ETFs
- Cons:
- Trades are conducted over-the-counter, which may have less liquidity and wider bid-ask spreads
- More complex due to different regulations, trading hours, and settlement processes
- Currency fluctuations can impact investment returns
- Limited information and research available for some foreign ordinaries
- Pros:
- Direct Stock Purchases: Investors can buy shares of international companies directly on foreign stock exchanges, which requires opening an account with a broker that offers international trading capabilities.
- Pros:
- Access to a wider range of international stocks
- Potential for higher returns with superior stock selection
- Cons:
- More complex due to different regulations, trading hours, and settlement processes
- Currency fluctuations can impact investment returns. If you are concerned about currency risk, consider utilizing currency-hedged ETFs/mutual funds to offset this.
- Pros:
Given how cheap and easy it is to diversify your exposure to international stocks with ETFs/Mutual funds, I’ve only invested using this strategy. However, that doesn’t mean that ADRs, foreign ordinaries, or direct stock purchases aren’t right for you. If you are interested in these strategies, I recommend consulting with a financial professional who can help you find the solution that best fits your needs.
Now that we have a better understanding of the various strategies for investing in international stocks, let’s conclude by summarizing some key takeaways that can help you to navigate the global investment landscape.
The Bottom Line for International Stocks
After reviewing the market data for nine different equity markets over the last 30 years, I can confidently say a few things:
- Real equity returns typically range from 3%-7% per year.
- The best equity markets in one period may not be the best in another period. This is why we must diversify our holdings (if possible) to hedge any single-country exposure.
- When markets crash, they tend to crash everywhere at once. The DotCom bubble, the Great Financial Crisis, and the COVID-19 crash all impacted different equity markets in remarkably similar ways.
- By continually purchasing a broad basket of global equities, you are very likely to maintain and grow your purchasing power over time.
After digging through the data on international stocks, I’ve come to realize that these markets have more similarities than they have differences.
Though the companies, languages, and currencies may differ, the driving force underlying each of them is the same. It’s about people coming together to provide products and services that benefit others while also making a living for themselves. And, you, as an investor, are participating in this process by providing capital that allows them to continue their mission in the way they see fit.
Of course, access is still an issue and will remain an issue for investors worldwide. Not everyone can invest in every market around the globe, but, thankfully, this is changing.
If you live in a country where you can’t easily invest in equity markets outside of your own, don’t worry. Instead, invest where you can and then focus on more important things in life.
For most people this means prioritizing your health, your relationships, and your career. These will have a far bigger impact on your life than any investment. With that being said, happy investing and thank you for reading.
If you liked this post, consider signing up for my newsletter.
This is post 342. Any code I have related to this post can be found here with the same numbering: https://github.com/nmaggiulli/of-dollars-and-data

