In the past few weeks the U.S. stock market has erased all of its gains over the past few months. The summer of 2023 came and went and we have nothing to show for it. Inflation and volatility are starting to creep back up and CNN’s Fear & Greed index is seeing red once again.
With all this uncertainty, many investors are wondering: is the U.S. stock market as bad as it seems?
In some ways, it is. With a highly concentrated market rally and lingering inflation, there are legitimate things for retail investors to be worried about. However, history suggests that most of the market pain is already behind us. Let’s dig in.
The Bad
As I discussed earlier this year, at the end of May only seven stocks were responsible for the entire gain in the U.S. stock market in 2023. This lack of breadth was a major concern for me as only a handful of large companies were leading the rally in equities.
Unfortunately, this hasn’t changed much since. Though the market rally did broaden during the summer, recent losses have caused things to reverse course. As of late September, only 25 companies are responsible for the 12% year-to-date gain in U.S. stocks.
You can see this more clearly by looking at the number of stocks responsible for the gain in the Russell 3000 (a broad based U.S. stock index) this year:
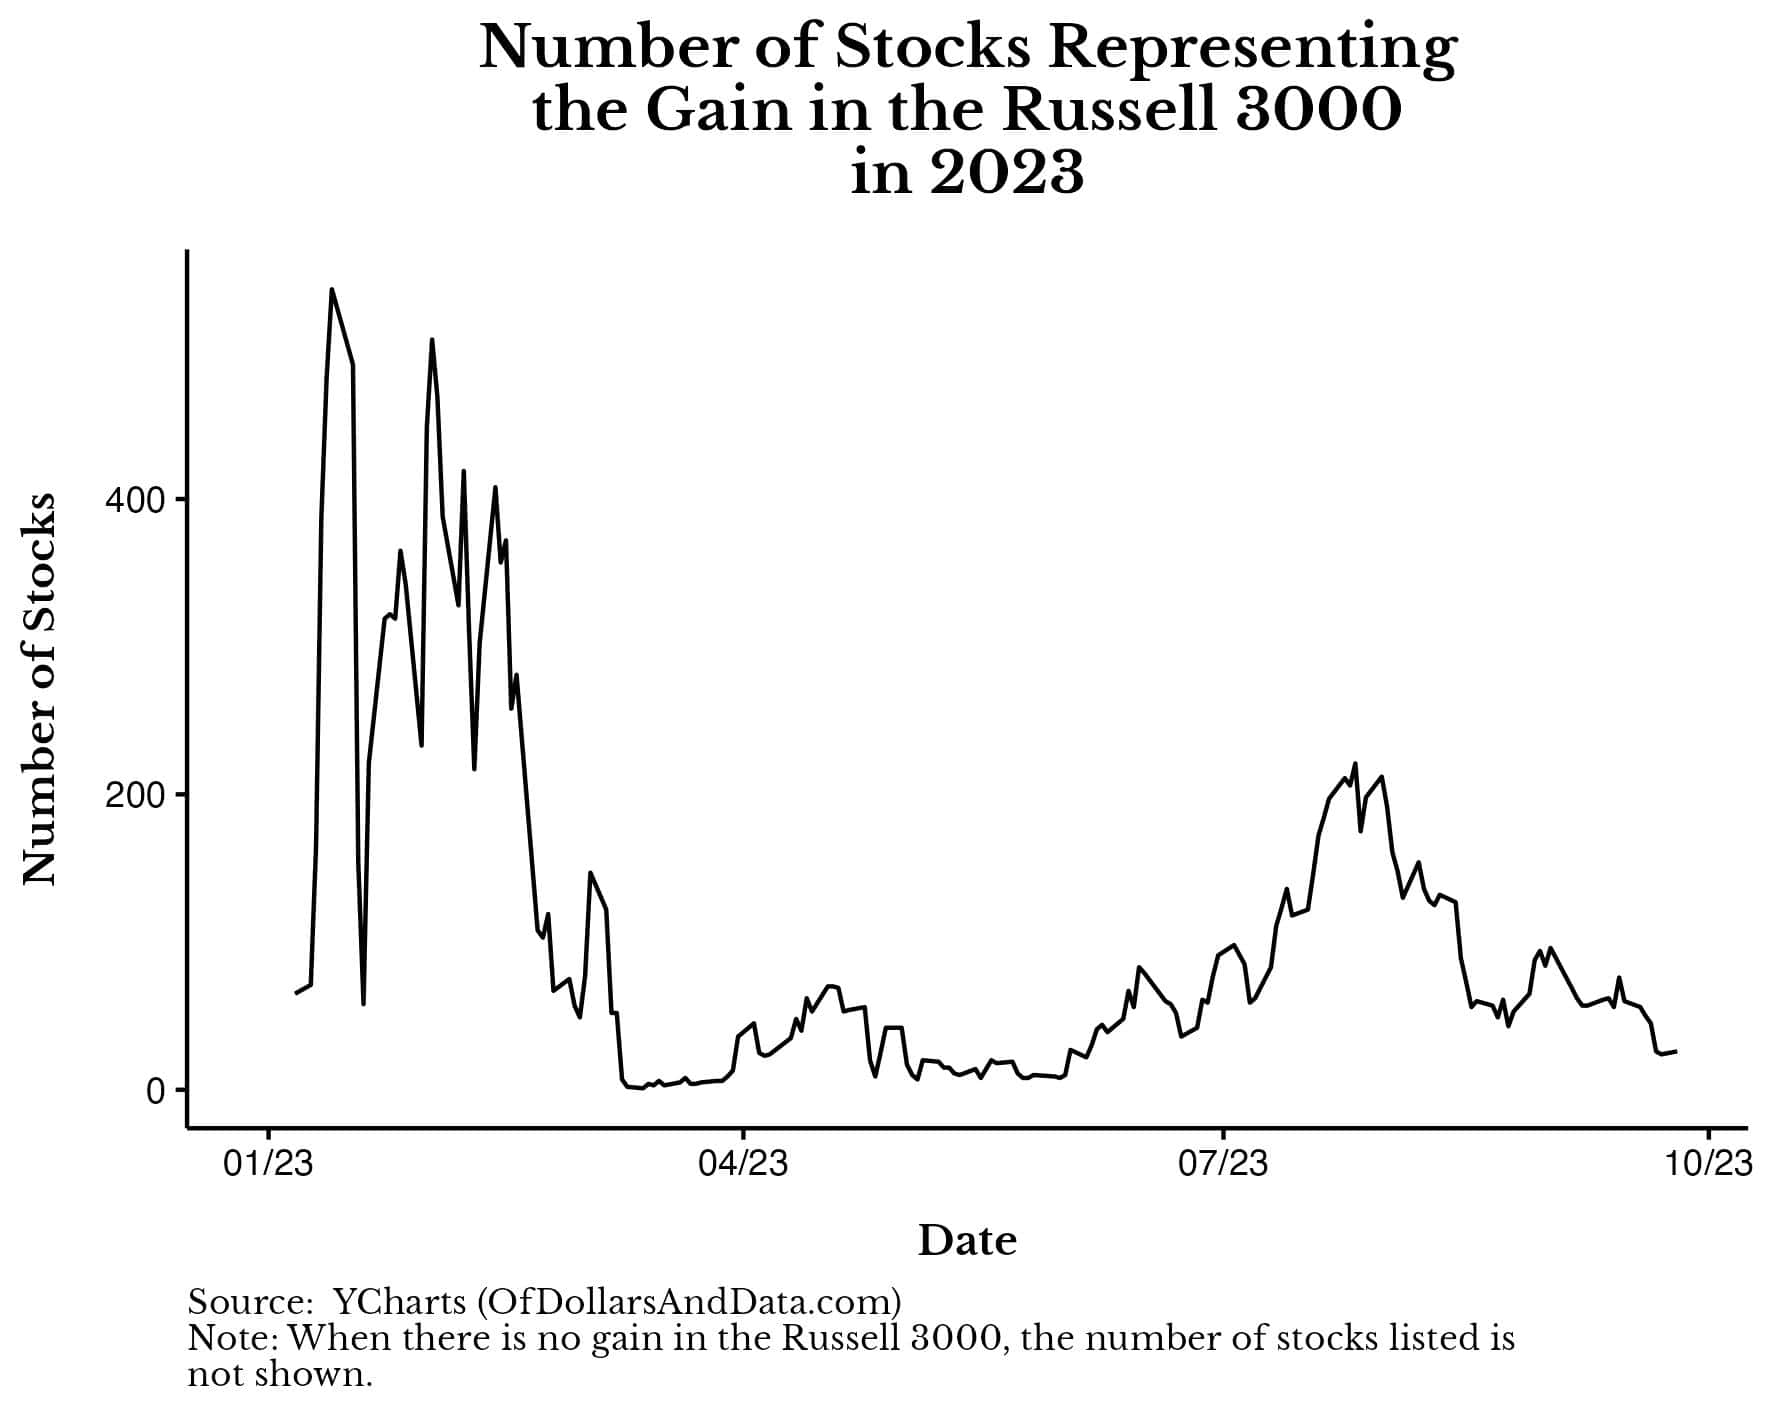
Though this year’s rally started quite broadly, it has since become concentrated into relatively few companies. You know the names—Apple, Meta, Nvidia, etc. This level of concentration suggests that there might be more weakness in the market than what the overall gain would suggest.
But, the lack of market breadth isn’t our only problem. We are also dealing with persistent inflation. Though CPI has come down from a high of 9% in June 2022, it’s since increased from 3% to 3.7% over the past two months. This isn’t a good sign.
As Jeremy Grantham explained in a recent episode of The Compound and Friends:
It turns out the market is coincident indicator of comfort. What makes the typical portfolio manager feel comfortable? Number one–it loves low inflation. It hates high inflation. It likes 2% stable inflation.
It does not like to see it bouncing around. It does not like to see it spike, in the worst way. And it does not like to see it hanging around for multiple years. That’s the most important.
I’ve previously discussed why people hate uncertainty in the context of a career, but this idea is equally valid in markets. Most of us just want to know if we’ll be okay and persistent inflation makes it difficult for us to answer that question. It makes it difficult for businesses and consumers alike to plan for the future. So, while prices remain in flux, we should expect more bumps along the road in the future.
Despite the storm clouds on the market’s horizon, the worst month for the stock market is over and history suggests that there are some reasons to be hopeful.
The Good
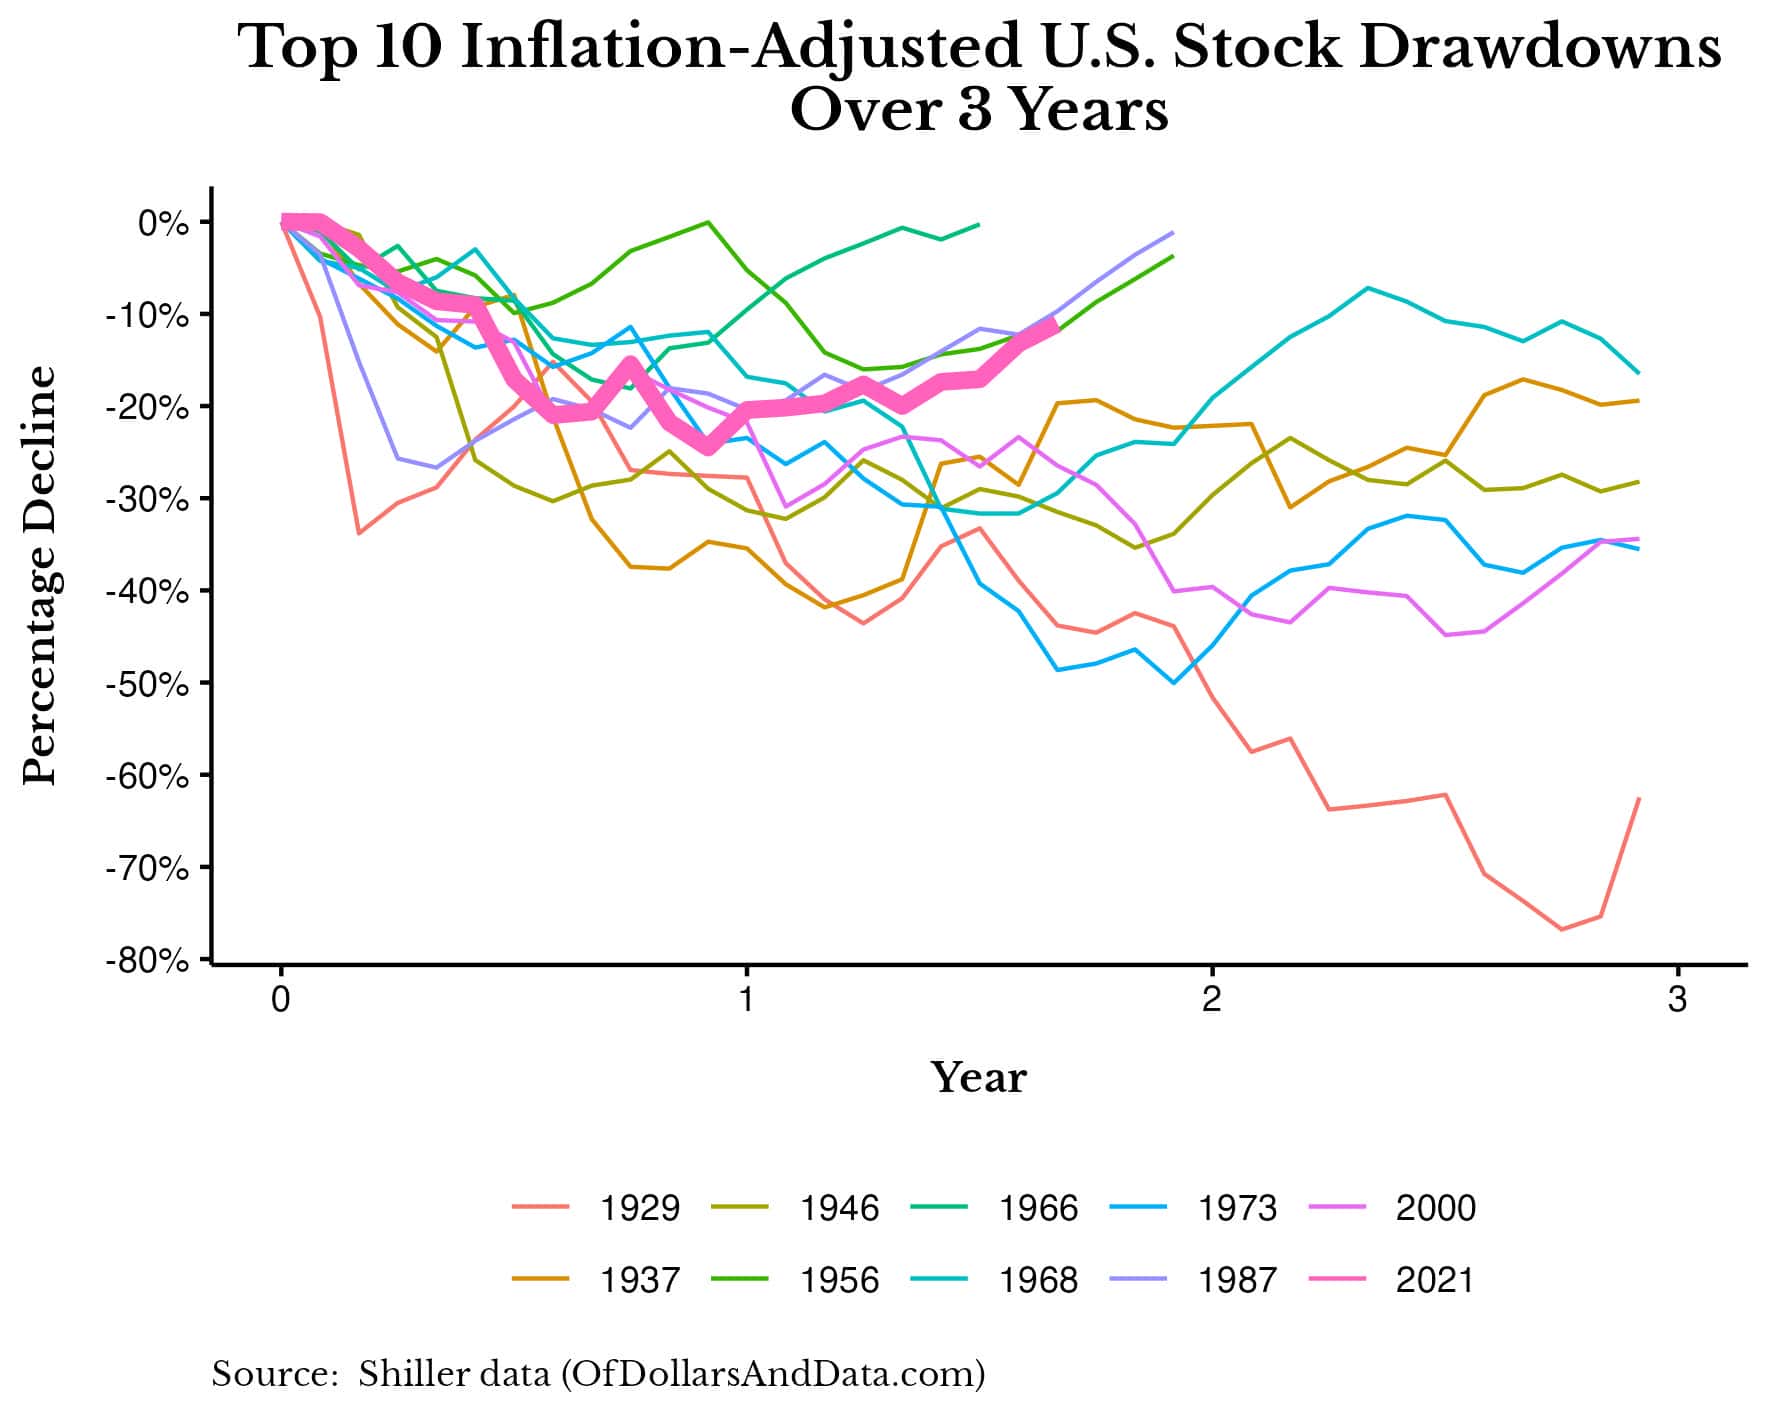
Albert Einstein once [allegedly] said, “If you want to know the future, look at the past.” Well, based on the past, the worst part of our current decline seems to be behind us.
We can see this clearly if we compare the top 10 worst inflation-adjusted drawdowns in U.S. stock market history against each other. As you can see, our current decline (highlighted in pink below) already seems to be on the road to recovery:
And, when we examine a longer time horizon, we see that U.S. market declines don’t tend to bottom, recover, and then fall further in the future.
No, that’s not how they typically work. In practice, the U.S. stock market tends to fall, reach its bottom, and then recover, as you can see in the chart below:
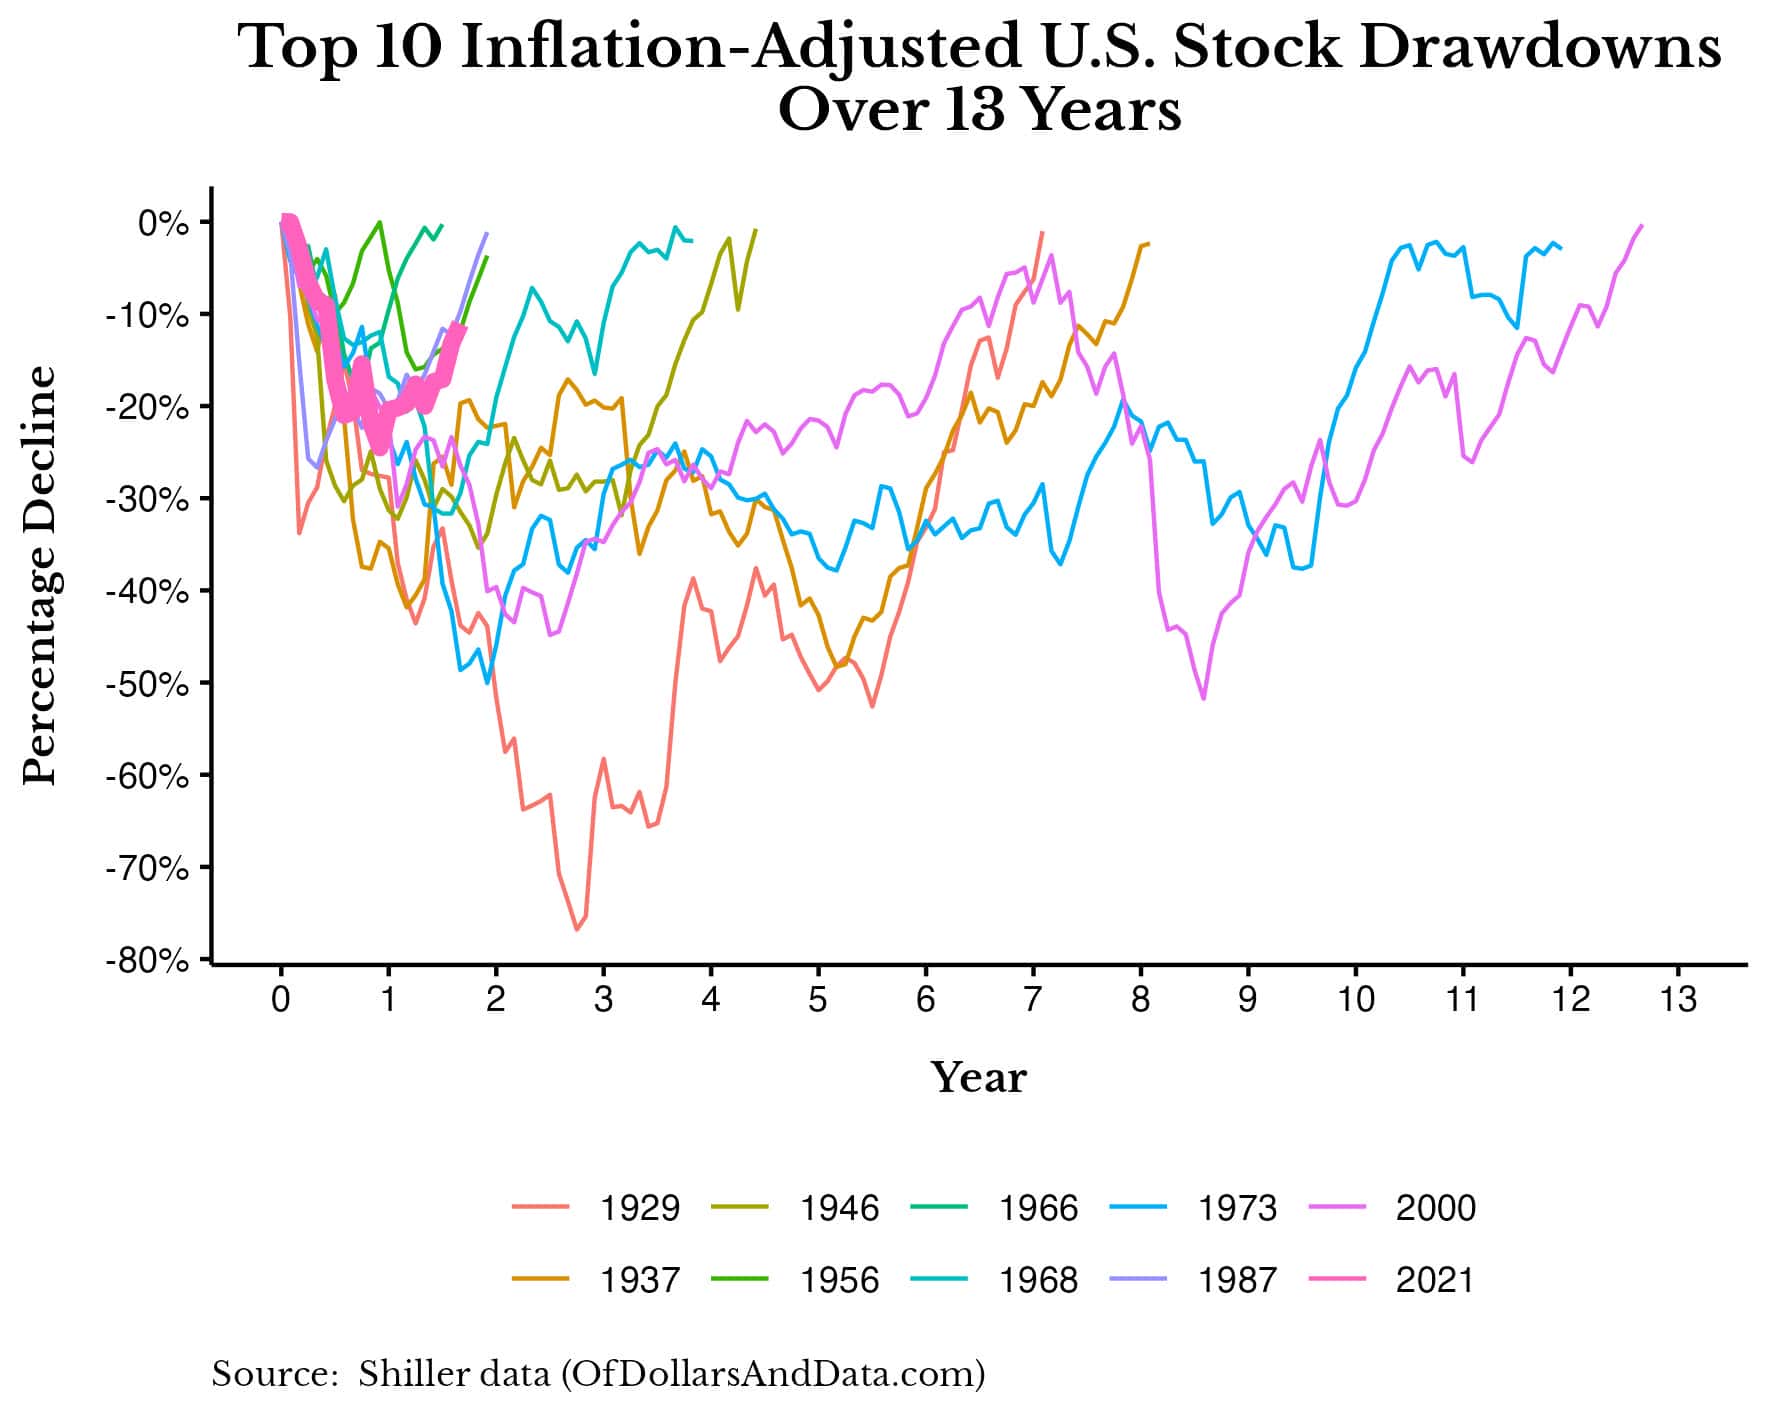
The two exceptions to this rule occurred in 1937 and 2000 where a secondary decline followed an initial decline years later.
You can see these two declines the chart below (with our current decline added in blue for context):
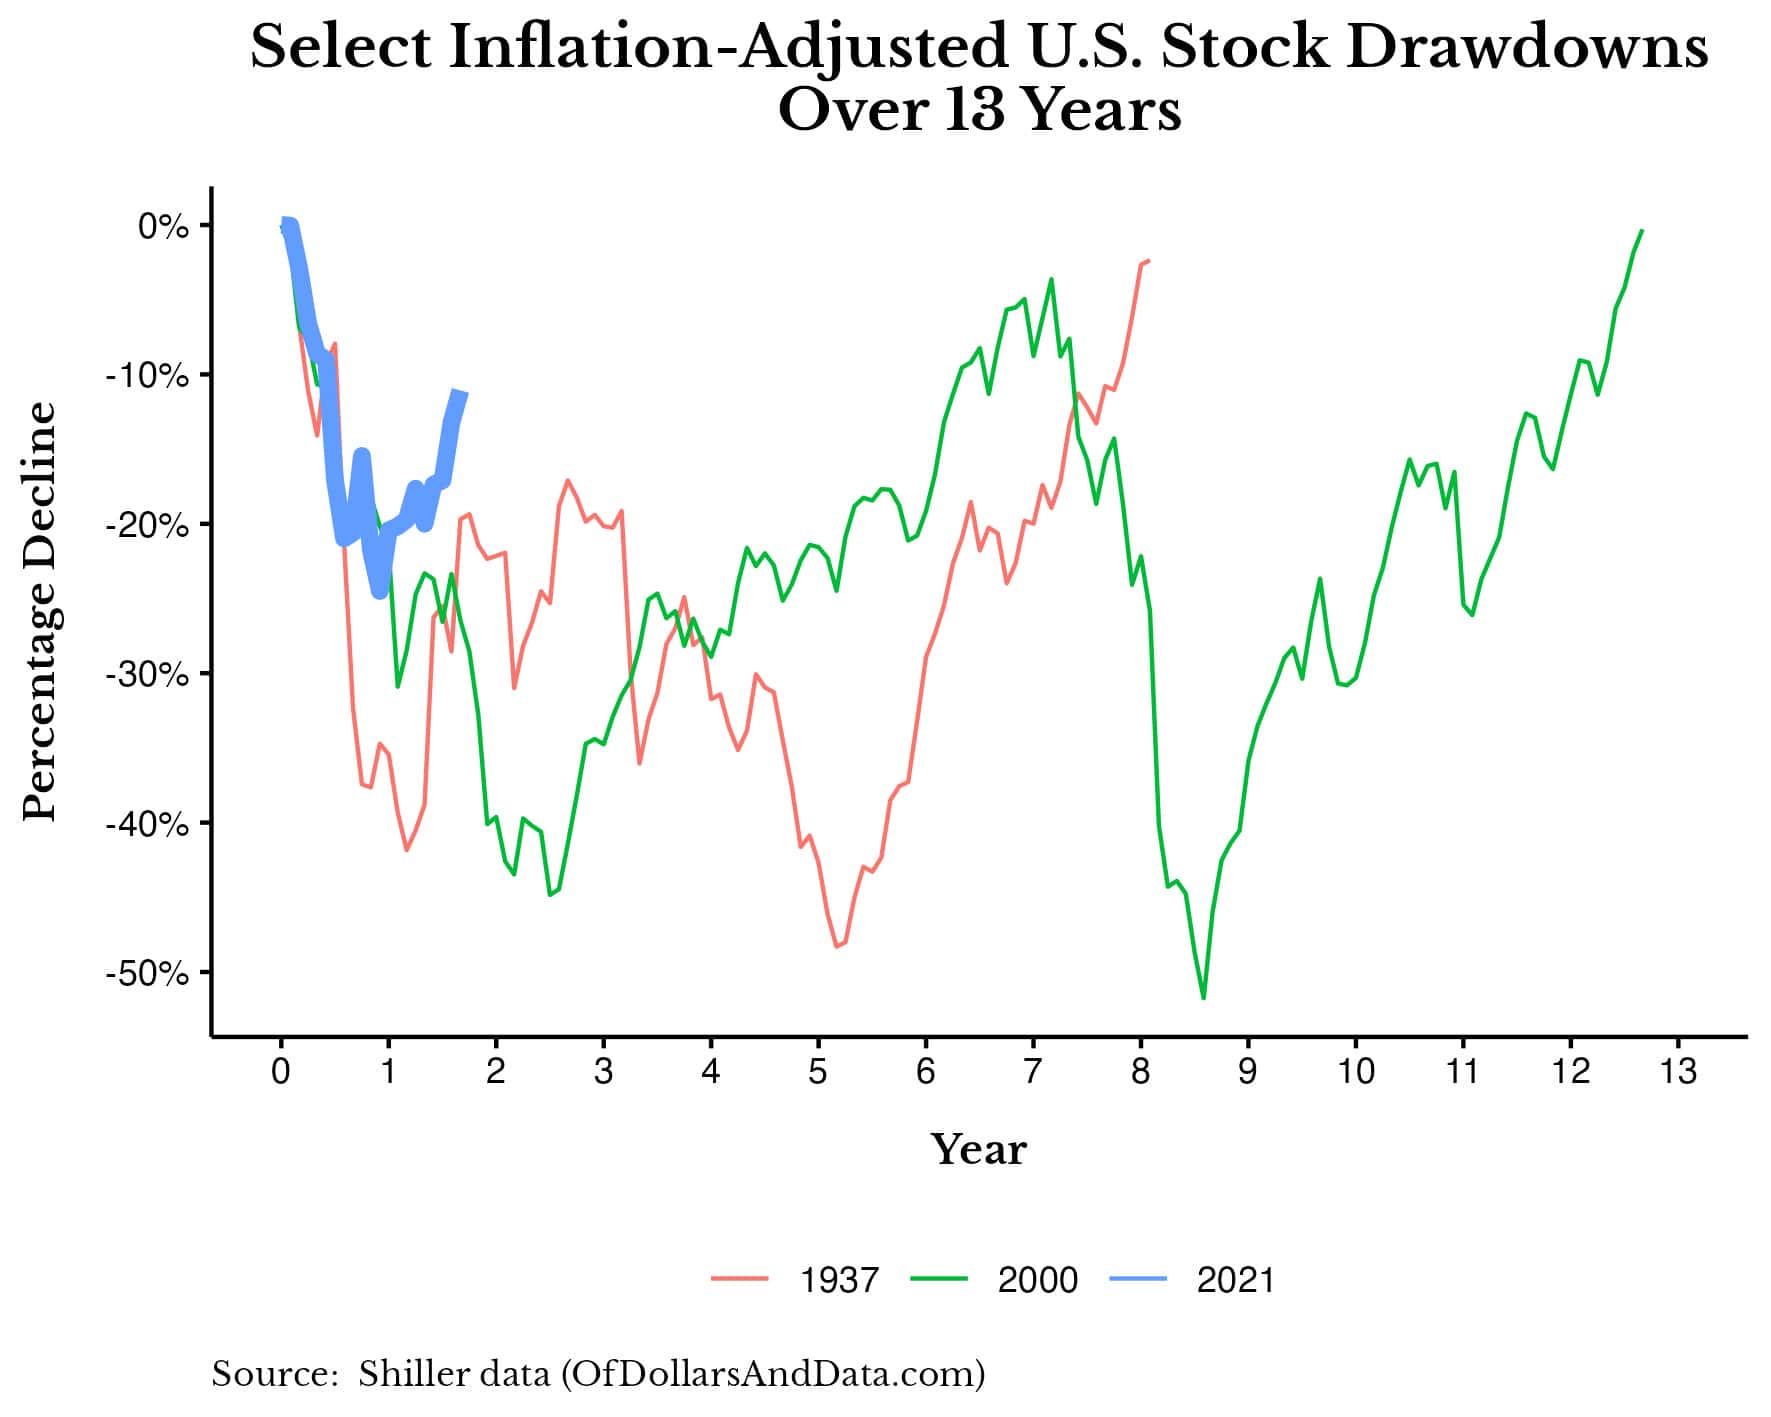
While it is definitely possible that our current decline could follow a similar path as the 1937 or 2000 declines, I wouldn’t bet on it. Why?
Because, the causes of the secondary declines in 1937 and 2000 were unforeseen events that had little to do with the initial declines.
In 1937, the market initially fell due to monetary and fiscal policy issues but didn’t ultimately bottom until May 1942, at the point of maximum bearishness during WWII. And in the case of the early 2000s decline, the market was nearly recovered from the DotCom Bubble when the Great Financial Crisis hit and sent it even lower. In both cases, the second decline had almost nothing to do with the first decline.
I believe the same thing will be true today. If we were to see a double-dip to a new low in 2023 (or beyond), it won’t be because inflation ticked back up to 5%-6% for a few months. No, it will be because of something we couldn’t predict at all.
While you might see this as bad news, I see it as good news. Why? Because these kinds of black swan events have two redeeming qualities. First, they are rare, which makes them unlikely to occur. And, second, because they are unpredictable, it’s very difficult to prepare for them ahead of time. Therefore, why should we worry about them?
This might seem like a naive question from someone who tells you to “ignore the noise” and “Just Keep Buying” but it’s not. It’s fundamental to the way you invest your money.
After all, if you can’t prepare for something that is unlikely to happen, what’s the point in getting all worked up about it? There is no point. We will just have to cross that bridge when we get there.
If this line of thinking doesn’t console you, then consider that the 4th quarter is historically the strongest for U.S. stocks. If this doesn’t help, then “sin a little” and shift more of your future investments into Treasury bills. If Treasury bills worry you, then buy more farmland or Bitcoin or whatever else helps you sleep at night.
Either way, I can’t provide you with the answer. I can only show you the data and then let you decide for yourself.
And the data suggests that predicting the future is incredibly difficult. So, we should choose an approach that is agnostic to whatever the future holds.
For me, that means the continual purchase of a diverse set of income-producing assets. The assets will change, but the philosophy will not.
So when someone asks, “Is the U.S. stock market as bad as it seems?” I don’t worry about the answer.
Happy investing and thank you for reading.
If you liked this post, consider signing up for my newsletter.
This is post 366. Any code I have related to this post can be found here with the same numbering: https://github.com/nmaggiulli/of-dollars-and-data

