It’s official. The S&P 500 is up over 20% from its October 2022 lows and we’ve technically entered a new bull market:
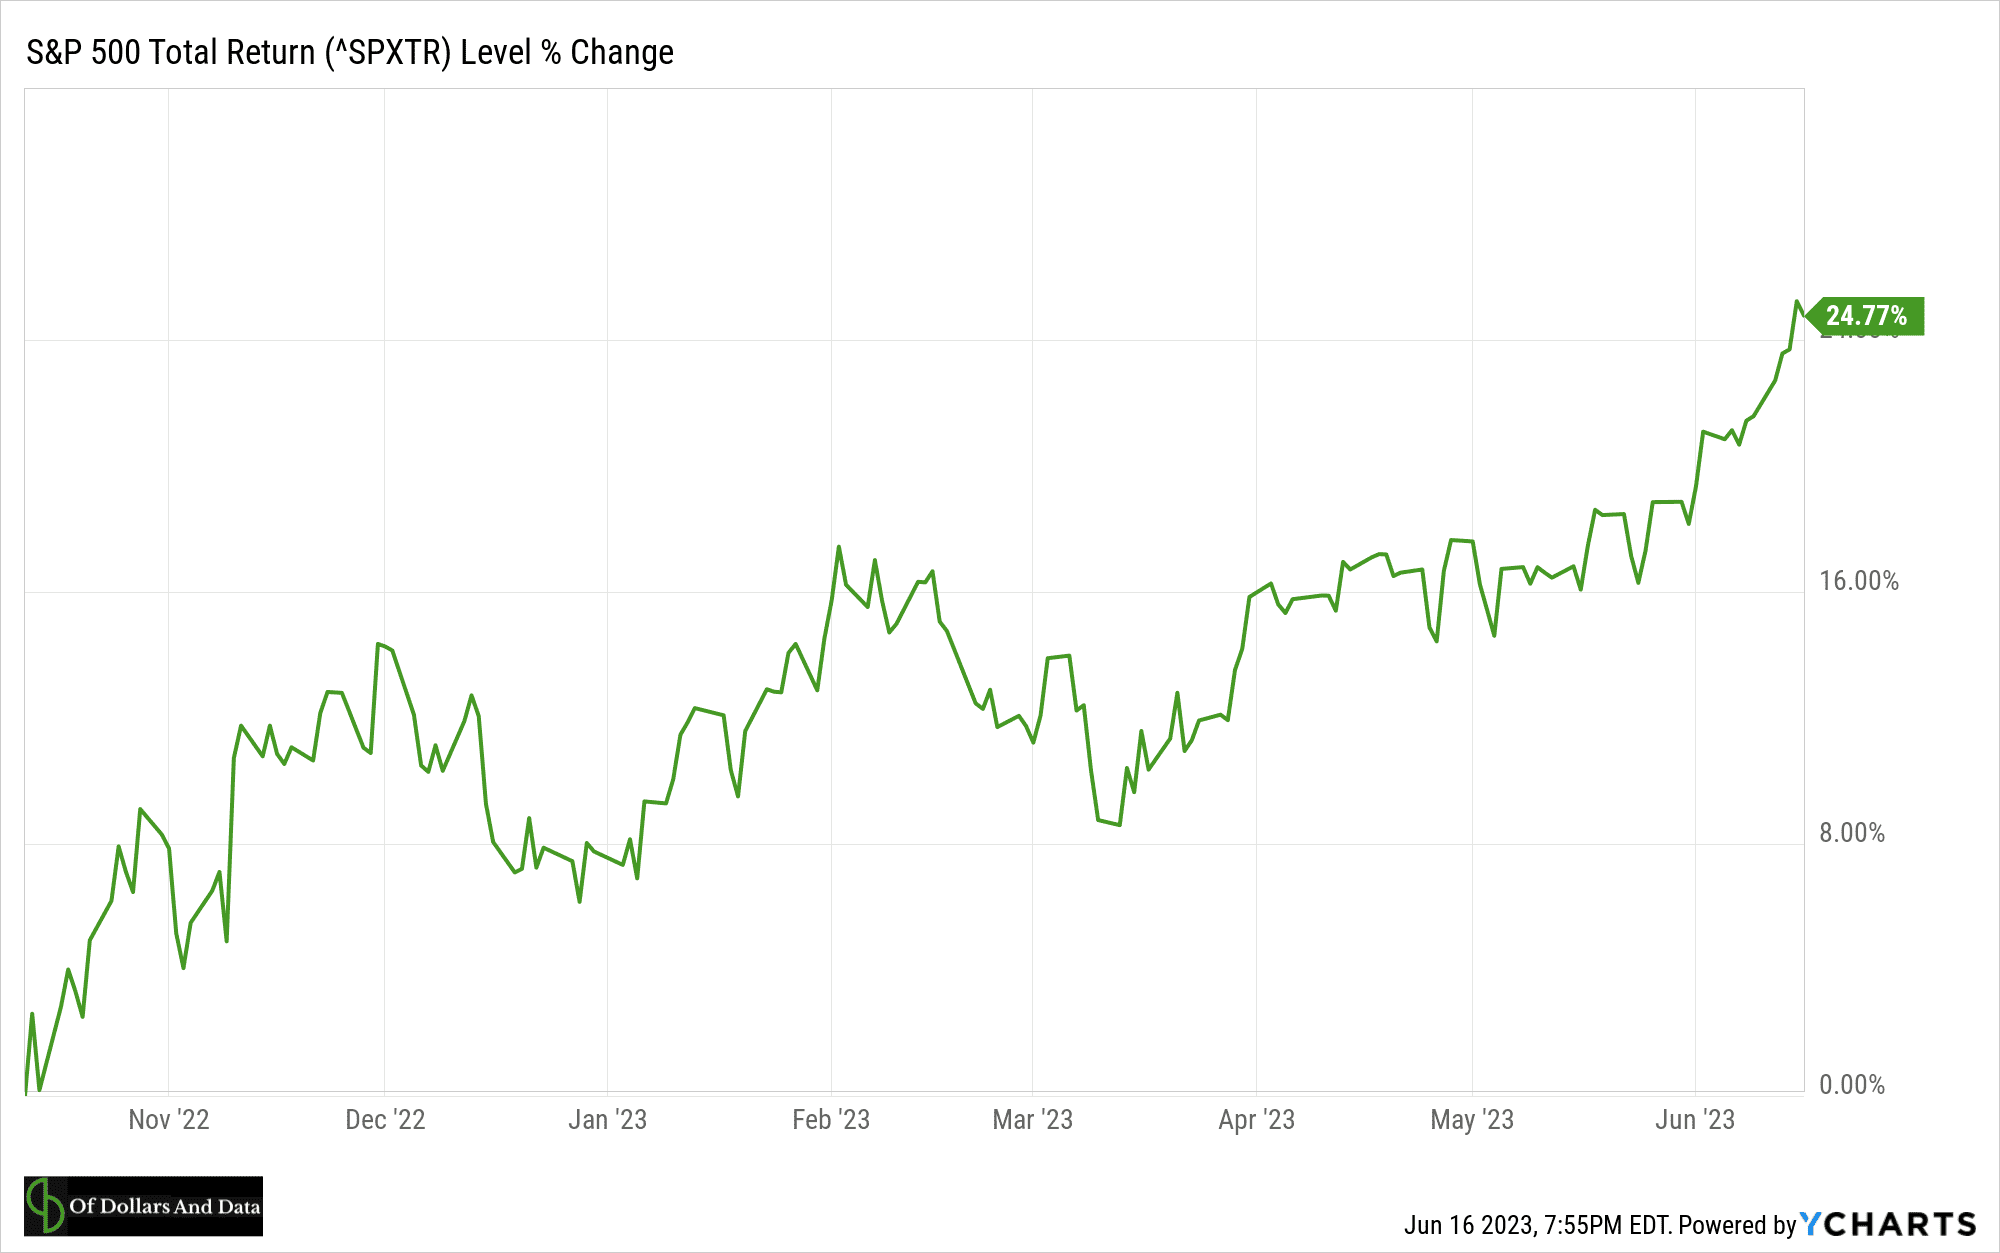
But, before you break out the champagne, there are a few things that you should consider about this new bull market we find ourselves in:
- We still aren’t at all-time highs. As much as I want to celebrate the recent rise in stocks, the S&P 500 is still in a drawdown. The index closed at a record of 4,796.56 on January 3, 2022 and hasn’t seen that level anytime since. Even if we include re-invested dividends, the S&P 500 is about 6% off its highs:
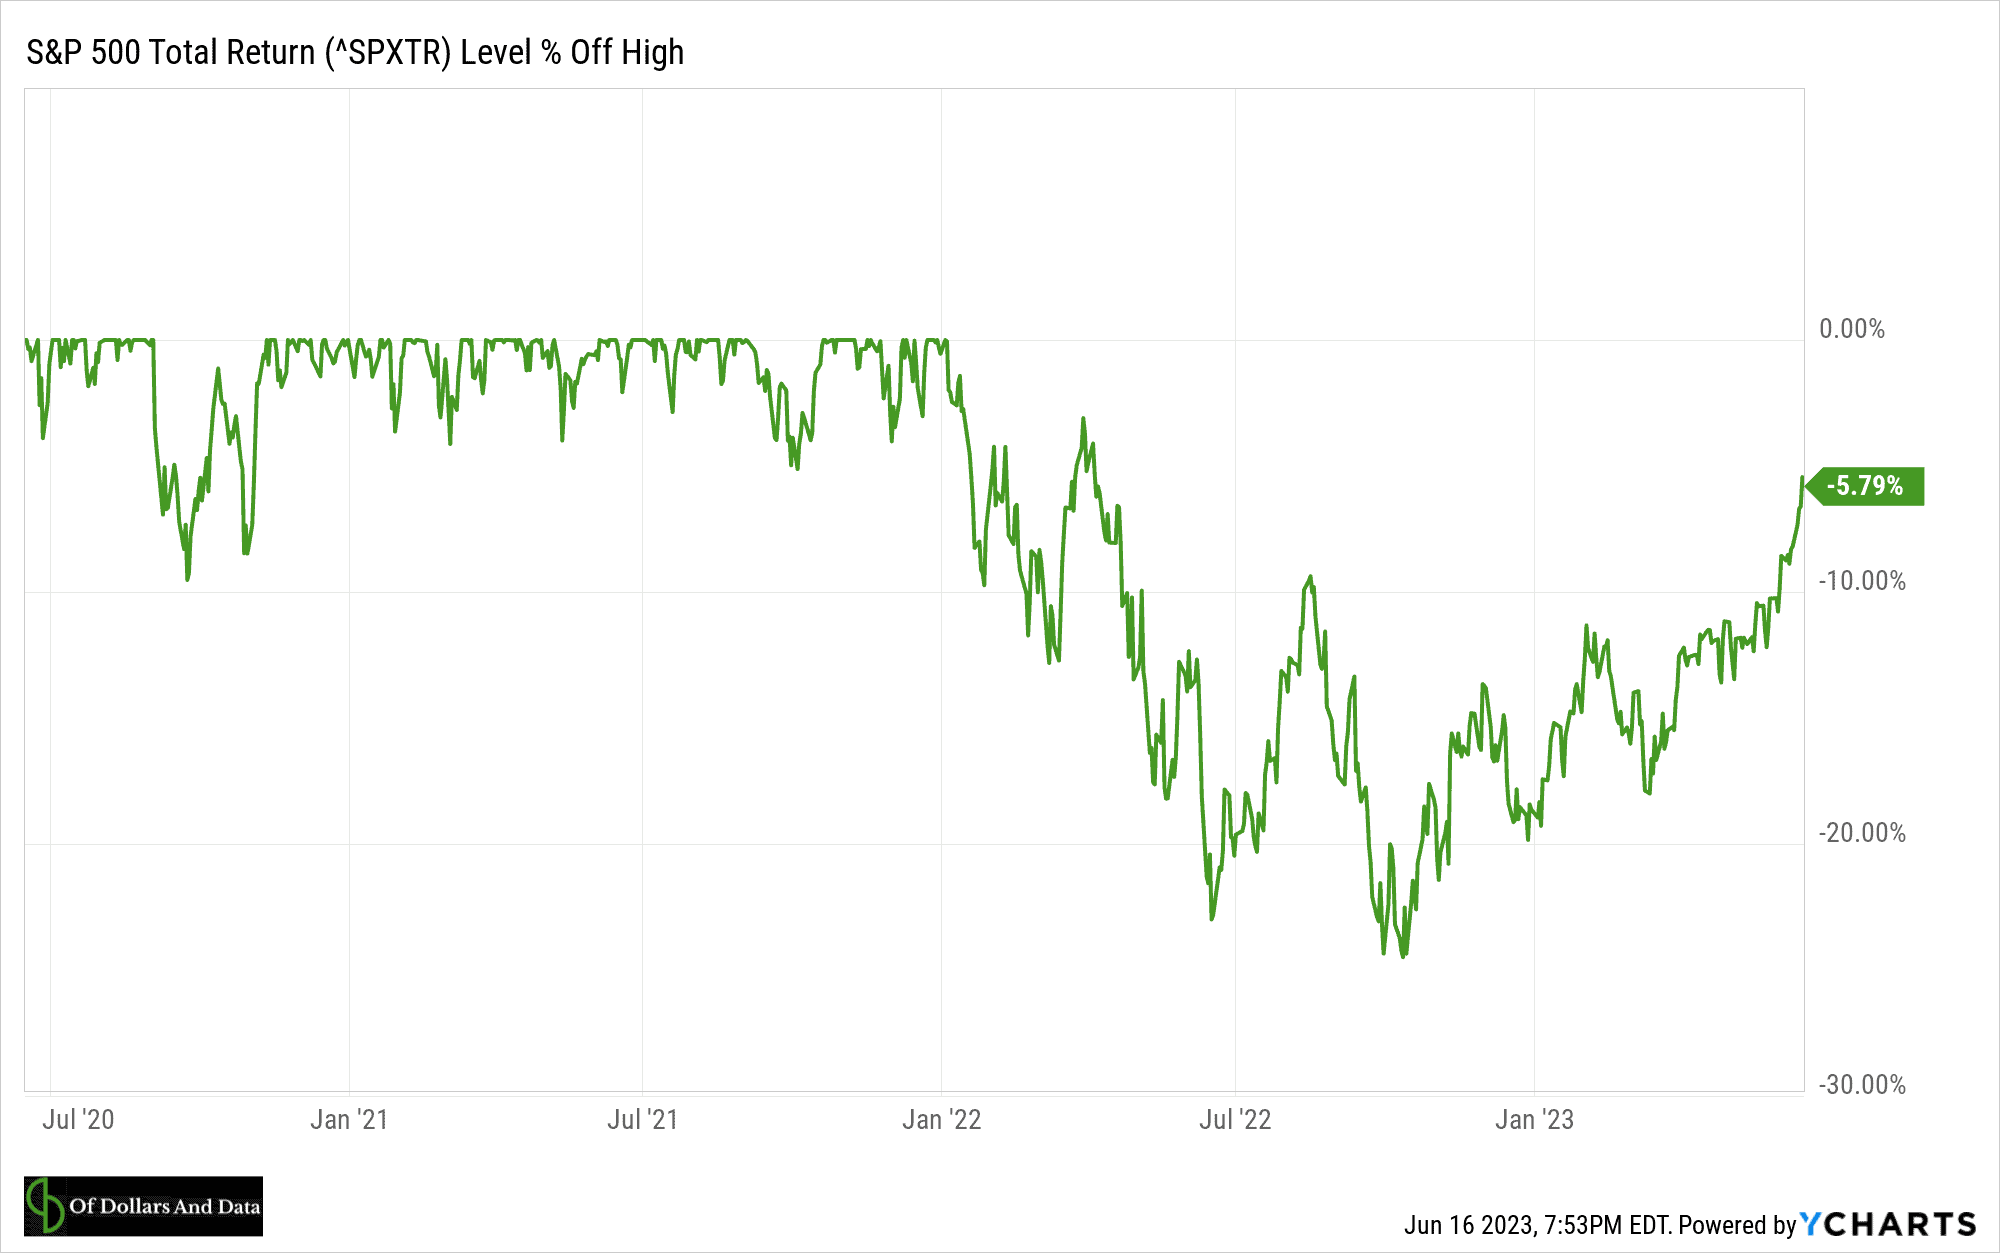
A year ago I blogged about the frequency of false rallies during bear markets and we may be experiencing such a fakeout today. I don’t say this because I’m pessimistic about the future, but because drawdowns can last longer than we might imagine.
- Inflation is still higher than normal. Though the annual inflation rate hit a recent low of 4% over the past year, we are still in an environment where individuals are dealing with the effects of rising costs. We see this both among consumers and investors.
- According to the Federal Reserve 2022 report on the Economic Well-Being of U.S. Households, “more adults experienced spending increases than income increases” over the past year, with 23% of adults reporting that their spending had increased but their income had not.
- For investors, the impact of inflation has been equally troublesome. Though U.S. stocks are only 6% below their all-time highs on a total return basis, once we adjust for inflation, the actual drawdown is closer to 15% (according to Robert Shiller’s data). This means that even if U.S. stocks hit new all-time highs, we would still have a way to go before our purchasing power fully recovered.
- Overall, while inflation does seem to be slowing down, the damage it has caused is already done. We can’t escape the fact that we need 18% more money today to buy the same set of goods that we could’ve bought in January 2020. Though the data is moving in the right direction, we should still be weary of inflation’s long-term impact.
- This is the most concentrated bull market maybe ever. Even though a new bull market is upon us, it’s being driven by an exceptionally small number of stocks. As S&P Global recently noted, so far in 2023 the entire gain in the S&P 500 can be explained by just 7 companies:
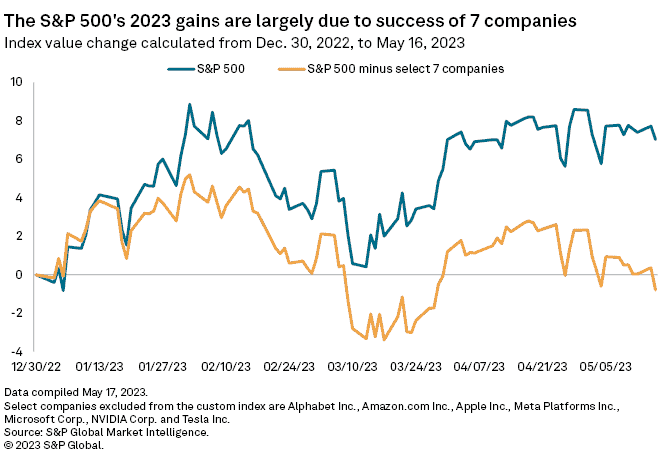
If we removed these 7 companies from the index (orange line pictured above), the S&P 500 would be flat on the year. There’s plenty of research demonstrating that a small number of companies drive the vast majority of the market’s overall return. For example, I highlighted one such piece in Just Keep Buying:
As Hendrik Bessembinder found in his paper “Do Stocks Outperform Treasury Bills?”: “the best-performing 4% of listed companies explain the net gain for the entire U.S. stock market since 1926.”
But, is this true on a year-to-year basis? Are a small percentage of stocks responsible for the index’s gain during a typical year?
I don’t know the answer to this because I don’t have the data on the list of companies included in the S&P 500 over time (along with their returns). However, I did look into this for a few recent years where the S&P 500 had a positive return and here is what I found:
- 2017: 203 stocks (40%) accounted for the index’s gain.
- 2019: 328 stocks (65%) accounted for the index’s gain.
- 2020: 60 stocks (12%) accounted for the index’s gain.
- 2021: 258 stocks (52%) accounted for the index’s gain.
- 2023 (through May 31): 7 stocks (~1%) accounted for the index’s gain.
After seeing this data, it’s quite apparent that our current rally is a major outlier in terms of its lack of market breadth. In other words, a very small number of companies are driving all of the gains and that isn’t normal.
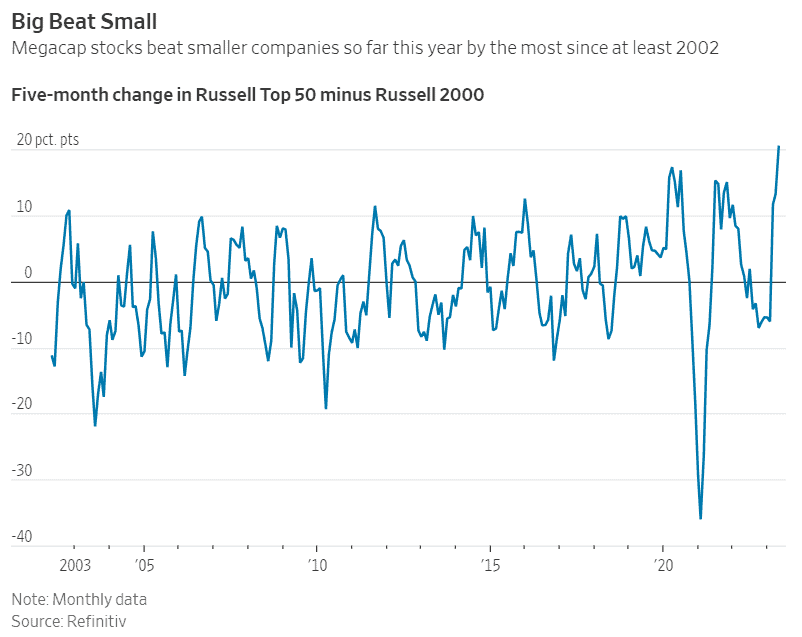
More importantly, these companies are some of the biggest ones out there. As the chart below illustrates, this is the most that megacap stocks have outperformed small stocks going back to 2002:
When you combine the current drawdown, the possibility of further inflation, and the high amount of market concentration in our current rally, you can see why I’m hesitant to take a victory lap for the new bull market. Though I’m always bullish in the long-term, I’m not necessarily bullish in the short-term. And while I just wrote about how down & sideways markets (like the market we are in today) tend to have higher future returns, it’s possible that this time is different.
I don’t say this to scare you or because I plan to change my investment strategy if this turns out to be correct. No, I say it because I have to mentally prepare myself for what may come. Because if I don’t, then I might abandon my beliefs when the going gets tough. You might do the same as well.
Because choosing an investment philosophy is only half the battle. The other half is sticking to it. In my case that philosophy is Just Keep Buying or “the continual purchase of a diverse set of income-producing assets.” I understand that Just Keep Buying is easier said than done. Because you don’t buy income-producing assets in a vacuum. You buy them in the real world where the media can influence you, where your friends can influence you, and where your family can influence you.
The trick is not to let them. The trick is to find something that works for you and tune everything else out. For me that means analyzing historical data and understanding how markets have behaved in the past. This doesn’t change how I invest that often, but it does help me keep an even keel with my emotions.
And right now my mind is telling me not to get too excited because we may have a long road to recovery ahead of us. Though the bulls are back in town, the bears haven’t gone into hibernation just yet.
Thank you for reading.
If you liked this post, consider signing up for my newsletter.
This is post 353. Any code I have related to this post can be found here with the same numbering: https://github.com/nmaggiulli/of-dollars-and-data

